Detection of N15NH+ in L1544
Abstract
Context. Excess levels of isotopes which have been detected in primitive solar system materials are explained as a remnant of interstellar chemistry which took place in regions of the protosolar nebula.
Aims. Chemical models of nitrogen fractionation in cold clouds predict an enhancement in the gas-phase abundance of -bearing molecules, thus we have searched for variants of the ion in L1544, which is one of the best candidate sources for detection owing to its low central core temperature and high CO depletion.
Methods. With the IRAM telescope we have obtained deep integrations of the line at .
Results. The line has been detected toward the dust emission peak of L1544. The abundance ratio in resulted , very close to the protosolar value of , higher than the terrestrial ratio of , and significantly lower than the lower limit in L1544 found by Gerin et al. (2009, ApJ, 570, L101) in the same object using ammonia isotopologues.
Key Words.:
ISM: clouds – molecules – individual object (L1544) – radio lines: ISM1 Introduction
The isotopic ratio has been measured in a variety of solar system bodies, including giant and rocky planets, comets, and meteorites. Its value exhibits large variations, depending on the selected object and the source for the measurement (Owen et al. 2001; Meibom et al. 2007), with the global Jovian value of representing probably the best approximation of the protosolar value (Fouchet et al. 2004). This value differs significantly from the terrestrial one of , and even larger excess was found in primitive solar system materials like meteorites, interplanetary dust particles (IDPs), and cometary dust particles returned by the Stardust mission (Alexander et al. 1998; Messenger 2000; Messenger et al. 2003; Aléon & Robert 2004; Clayton & Nittler 2004; McKeegan et al. 2006); to date, the largest enhancement detected is a ratio of (corresponding to about four times the terrestrial abundance of ) in the hotspots of the meteorite Bells (Busemann et al. 2006). The lack of any significant enhancement in the material with the largest content (Floss et al. 2004) rules out a nucleosynthetic origin for the nitrogen fractionation and suggests that, as with deuterium, the -rich material results from low-temperature gas-phase ion-molecule reactions and catalysis on cold interstellar dust grains (e.g. Charnley & Rodgers 2002).
The early model of fractionation in the interstellar medium (ISM) developed by Terzieva & Herbst (2000) predicted only a modest enrichment and was thus unable to account for such large enhancements. Subsequently, Charnley & Rodgers (2002) showed that much higher ratios can be generated in high-density cores, where CO is depleted onto dust grains, but N2 remains in the gas phase, as appears to be the case in many pre-stellar cores (Caselli et al. 1999; Bergin et al. 2002; Tafalla et al. 2002; Bergin & Tafalla 2007). The key fractionation processes are the exothermical reactions (Terzieva & Herbst 2000)
| (1) |
| (2) |
which, at low temperatures, drive into molecular nitrogen through the dissociative recombination of dyazenilium ions (Molek et al. 2007). Under normal interstellar conditions, and atoms are continuously exchanged into molecular nitrogen through the sequence
| (3) |
but in heavily depleted regions, there is insufficient OH to drive the above sequence. In these conditions, is preferentially incorporated into gas-phase N2 through the dissociative recombination of and , and into solid NH3 through the production of + via N + He+, successive hydrogenation of +, production of H3 and freeze-out onto dust grain surfaces (Charnley & Rodgers 2002; Rodgers & Charnley 2008b). Assuming selective depletion, this chemistry leads to accretion of ammonia ice with high enrichment, up to one order of magnitude with respect to the elemental ratio, more than sufficient to explain the largest measured enhancements. However, this theoretical model is still to some extent speculative, due to the paucity of observational data on key -bearing molecules in dense prestellar cores. In this context, the observation of -containing diazenylium ion in selectively depleted dark clouds is an efficient probe to assess if the nitrogen fractionation process is at work in the way described, as the model predicts an enhancement in the abundance of both and .
Previous searches of isotopic variants of N2H+ have been carried out a long time ago (Womack et al. 1992; Linke et al. 1983) and the detection was successful only toward massive star forming regions, owing to the low sensitivity achieved and also because of the selection of sources, which did not concentrate on heavily CO-depleted, centrally concentrated cores (not known at that time). To date, no observational data on and in the ISM are available, thus we initiated a survey of -diazenylium in cold quiescent clouds, starting from L1544, which we expected to be a very good candidate source for the detection because () the deuterium enhancement in this source is very large (N2D+/N2H+ , Crapsi et al. 2007); () deuterated species are excellent tracers of the high density gas in the center of the core (Caselli et al. 2002a), where CO is more heavily depleted and thus where the highest 15N enhancement is expected from the above reasoning; and () recent observations revealed that its central region has a temperature of only (Crapsi et al. 2007), thus, due to the small zero-point energy changes associated with -fractionation, these low temperatures are expected to yield higher ratios. We report here the positive detection of the emission at in this cold dense molecular core.
2 Observations
The millimetre and submillimetre spectra of and were recently investigated in the laboratory by Dore et al. (2009), and the data were used by the authors to produce accurate hyperfine line lists adopting the quadrupole coupling and spin-rotation constant of the parent species (Caselli et al. 1995). The same data have also been included in the Cologne Database for Molecular Spectroscopy (CDMS, Müller et al. 2001, 2005), where lists of hyperfine-free rotational transitions of -containing isotopologues of the dyazenylium ion are also presented.
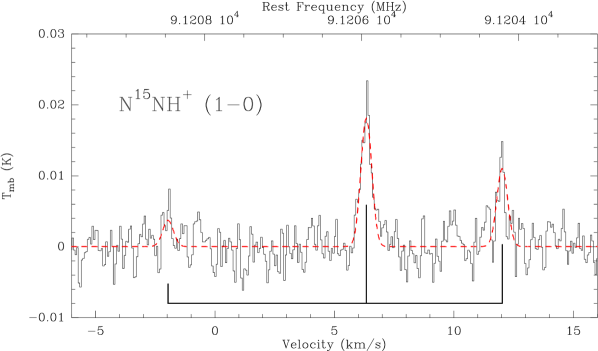
The observations toward the quiescent Taurus starless core L1544 were performed with the IRAM antenna, located at Pico Veleta (Spain) during one observing session in June 2009. Since the transitions of and have rest frequencies of and , respectively, it was not possible to observe both lines simultaneously with the same detector settings due to the current limitations in the telescope hardware. In the initial observing strategy, a splitting of the telescope time into two separate runs was planned; but owing to the unstable weather consitions, we decided to employ the whole allocated time integrating the transition in order to obtain a spectrum with sufficient signal-to-noise ratio. We used the EMIR receivers in the E090 configuration, observing the line in the lower-inner sideband. The observations were performed in frequency switching mode, with a throw of ; the backend used was the VESPA correlator set to a spectral resolution of (corresponding to ) and spectral bandpass of . Telescope pointing was checked every two hours on nearby planets and bright radio quasars and was found accurate to ; the half power beam width (HPBW) was . Scans were taken toward the peak of the continuum dust emission of L1544 (Caselli et al. 2002a), the adopted coordinates were , . We integrated for a total of 27.25 hours, with two orthogonal polarizations simutaneously observed and averaged together to produce the final spectrum. The rms noise level achieved was about , allowing for a clear detection of emission line toward L1544, as illustrated by Fig. 1. The spectrum is presented in units of and was corrected assuming a source filling factor of unity and using the forward and main beam efficiencies appropriate for , and , respectively.
3 Results
The data processing was done with the GILDAS111See GILDAS home page at the URL: http://www.iram.fr/IRAMFR/GILDAS. software (e.g. Pety 2005); due to the wavy background produced by the frequency switching observing method, extensive polynomial baseline subtraction had to be applied to obtain reasonable flat spectra. Since the nuclear spin of is , has only one quadrupolar nucleus, with , thus its rotational lines are split into a triplet, making its detection easier than of the parent species whose hyperfine structure is spread over seven components (Caselli et al. 1995).
Figure 1 displays the averaged spectrum taken toward L1544. The two stronger and transitions are clearly seen, while the weak component is detected at level. Average line parameters can be estimated by fitting Gaussian profiles to the detected lines with the HFS routine implemented in CLASS, which allows to take into account the hyperfine components self-consistently. Adopting the hyperfine splittings and intensities of the transition calculated by Dore et al. (2009), the HFS fit gives a systemic velocity and an intrinsic line width ; it also indicates, as expected, a low optical depth for the line, thus no information on the excitation temperature can be derived from the observational data. The results of the HFS fit are summarised in Table 1, and the resulting spectral profile is superimposed in Fig. 1 as a dotted trace.
The column density of has been calculated from the integrated line intensity of the strongest component, which exhibits the best spectral profile. The Gaussian fit gives and . We adopted the constant excitation temperature approximation (Caselli et al. 2002b), assuming a value of as derived from observations of the hyperfine structure toward the same object and the same offset position (Caselli et al. 2002a). From the solution of the radiative transfer equation with the assumption of optically thin emission, one has the following expression for the total column density (Caselli et al. 2002b)
| (4) |
where is the emission Einstein’s coefficient for the hyperfine transition, is the radiation temperature of a black body at temperature , is the upper state energy, and is the spin-rotational partition function for the excitation temperature obtained by summing over all energy levels of importance.
The coefficient for the hyperfine line was calculated from the formula given by Dore et al. (2009) and with the weighted average of the literature values of the dipole moments, (Havenith et al. 1990, Table II), resulting . Substitution of all terms of Eq. (4) gives a total column density of toward L1544 of , where the estimated uncertainty is obtained by propagating the errors on , , and the integrated intensity derived from the present observations.
4 Discussion
The column density of the main dyazeniulim ion derived toward the “dust peak” of L1544 by Crapsi et al. (2005) is and thus the resulting [/] abundance ratio is , which is well comparable with the recognised protosolar value of the ratio, as measured in the Jupiter atmosphere (, Fouchet et al. 2004), or in osbornite-bearing inclusions from meteorites (, Meibom et al. 2007).
Very recently Gerin et al. (2009) reported on a search for 15NH2D in dense cores, with the aim of measuring the nitrogen isotopic ratio in the ISM. They observed several sources, including L1544, obtaining ratios ranging from 350 and 850. In L1544 the detection of 15NH2D was not achieved, leading to an estimation of a lower limit of 700 for this ratio. The value we obtained for is nearly two times smaller than this estimate, indicating that the mechanism of nitrogen fractionation at work in these cold dense cores produces marked differences of enhancement among different chemical species.
The time dependent coupled gas/solid chemical model of Charnley & Rodgers (2002) (see also Rodgers & Charnley 2008b) predicts that at the end of evolution significant amounts of -rich ammonia are frozen onto ice mantles, while the gas phase becomes enriched at early times, before the complete depletion of molecules. Improved models (Rodgers & Charnley 2008a; Gerin et al. 2009) which include additional ion/neutral and neutral/neutral reaction channels predict that assuming typical dense-core parameters, enrichment of ammonia is only moderate in the gas phase, while much stronger enrichment is expected for (Gerin et al. 2009, figure 2). Thus, it appears that our finding is not compatible with the above picture, given that the ratio in L1544 is consistent with the / abundance ratio in the local ISM (Wilson & Rood 1994). In any case, further observations are needed to effectively test these chemical models. In particular, the detection of the other isotopologue will be very interesting, since due to the different exothermicities of the reactions (1) and (2), the two ions should be fractionated to a different degree. Rodgers & Charnley (2004) predicted a gas-phase ratio of about 2, which differs significantly from the equal abundances that would exist without the fractionation mechanism. A tentative determination of this ratio is found in Linke et al. (1983) who obtained 1.25 in DR 21 (OH), but it is likely that new determinations in centrally CO-depeleted cores might yield higher values.
Acknowledgements.
The authors thank the anonymous referee and the editor for their helpful observations. We are grateful to the IRAM staff for their support during the observations. LB acknowledges travel support to Pico Veleta from TNA Radio Net project funded by the European Commission within the FP7 Programme. LD acknowledges support from the University of Bologna (RFO funds).References
- Aléon & Robert (2004) Aléon, J. & Robert, F. 2004, Icarus, 167, 424
- Alexander et al. (1998) Alexander, C. M. O., Russell, S. S., Arden, J. W., et al. 1998, Meteor. Planet. Sci., 33, 603
- Bergin et al. (2002) Bergin, E. A., Alves, J., Huard, T., & Lada, C. J. 2002, ApJ, 570, L101
- Bergin & Tafalla (2007) Bergin, E. A. & Tafalla, M. 2007, ARA&A, 45, 339
- Busemann et al. (2006) Busemann, H., Young, A. F., Alexander, C. M. O., et al. 2006, Science, 312, 727
- Caselli et al. (1995) Caselli, P., Myers, P. C., & Thaddeus, P. 1995, ApJ, 455, L77
- Caselli et al. (1999) Caselli, P., Walmsley, C. M., Tafalla, M., Dore, L., & Myers, P. C. 1999, ApJ, 523, L165
- Caselli et al. (2002a) Caselli, P., Walmsley, C. M., Zucconi, A., et al. 2002a, ApJ, 565, 331
- Caselli et al. (2002b) Caselli, P., Walmsley, C. M., Zucconi, A., et al. 2002b, ApJ, 565, 344
- Charnley & Rodgers (2002) Charnley, S. B. & Rodgers, S. D. 2002, ApJ, 569, L133
- Clayton & Nittler (2004) Clayton, D. D. & Nittler, L. R. 2004, ARA&A, 42, 39
- Crapsi et al. (2005) Crapsi, A., Caselli, P., Walmsley, C. M., et al. 2005, ApJ, 619, 379
- Crapsi et al. (2007) Crapsi, A., Caselli, P., Walmsley, M. C., & Tafalla, M. 2007, A&A, 470, 221
- Dore et al. (2009) Dore, L., Bizzocchi, L., Degli Esposti, C., & Tinti, F. 2009, A&A, 496, 275
- Floss et al. (2004) Floss, C., Stadermann, F. J., Bradley, J., et al. 2004, Science, 303, 1355
- Fouchet et al. (2004) Fouchet, T., Irwin, P. G. J., Parrish, P., et al. 2004, Icarus, 172, 50
- Gerin et al. (2009) Gerin, M., Marcelino, N., Biver, N., et al. 2009, A&A, 498, L9
- Havenith et al. (1990) Havenith, M., Zwart, E., Meerts, W. L., & ter Meulen, J. J. 1990, J. Chem. Phys., 93, 8446
- Linke et al. (1983) Linke, R. A., Guélin, M., & Langer, W. D. 1983, ApJ, 271, L85
- McKeegan et al. (2006) McKeegan, K. D., Aléon, J., Bradley, J., et al. 2006, Science, 314, 1724
- Meibom et al. (2007) Meibom, A., Krot, A. N., Robert, F., et al. 2007, ApJ, 656, L33
- Messenger (2000) Messenger, S. 2000, Nature, 404, 968
- Messenger et al. (2003) Messenger, S., Stadermann, F. J., Floss, C., Nittler, L. R., & Mukhopadhyay, S. 2003, Space Sci. Rev., 106, 155
- Molek et al. (2007) Molek, C. D., McLain, J. L., Poterya, V., & Adams, N. G. 2007, J. Phys. Chem. A, 111, 6760
- Müller et al. (2005) Müller, H. S. P., Schlöder, F., Stutzki, J., & Winnewisser, G. 2005, J. Mol. Spectrosc., 742, 215
- Müller et al. (2001) Müller, H. S. P., Thorwirth, S., Roth, D. A., & Winnewisser, G. 2001, A&A, 370, L49
- Owen et al. (2001) Owen, T., Mahaffy, P. R., Niemann, H. B., Atreya, S., & Wong, M. 2001, ApJ, 553, L77
- Pety (2005) Pety, J. 2005, in EdP-Sciences Conference Series, ed. F. Casoli, T. Contini, J. Hameury, & L. Pagani, Vol. SF2A-2005, 721
- Rodgers & Charnley (2004) Rodgers, S. D. & Charnley, S. B. 2004, MNRAS, 352, 600
- Rodgers & Charnley (2008a) Rodgers, S. D. & Charnley, S. B. 2008a, ApJ, 689, 1448
- Rodgers & Charnley (2008b) Rodgers, S. D. & Charnley, S. B. 2008b, MNRAS, 385, L48
- Tafalla et al. (2002) Tafalla, M., Myers, P. C., Caselli, P., Walmsley, C. M., & Comito, C. 2002, ApJ, 569, 815
- Terzieva & Herbst (2000) Terzieva, R. & Herbst, E. 2000, MNRAS, 317, 563
- Wilson & Rood (1994) Wilson, T. L. & Rood, R. T. 1994, ARA&A, 32, 191
- Womack et al. (1992) Womack, M., Ziurys, L. M., & Wyckoff, S. 1992, ApJ, 387, 417
| Line | Rest frequencya | coefficient | ||||
|---|---|---|---|---|---|---|
| (MHz) | s-1 | (km s-1) | (mK km s-1) | (km s-1) | ||
| 0.533(54)d | ||||||