The Extended X-ray Nebula of PSR J1420–6048
Abstract
The vicinity of the unidentified EGRET source 3EG J1420–6038 has undergone extensive study in the search for counterparts, revealing the energetic young pulsar PSR J1420-6048 and its surrounding wind nebula as a likely candidate for at least part of the emission from this bright and extended gamma-ray source. We report on new Suzaku observations of PSR J1420–6048, along with analysis of archival XMM Newton data. The low background of Suzaku permits mapping of the extended X-ray nebula, indicating a tail stretching north of the pulsar. The X-ray data, along with archival radio and VHE data, hint at a pulsar birthsite to the North, and yield insights into its evolution and the properties of the ambient medium. We further explore such properties by modeling the spectral energy distribution (SED) of the extended nebula.
1 Introduction
The campaign to identify 3EG J1420–6038 has revealed sources across the electromagnetic spectrum from radio to VHE -rays. The complex of compact and extended radio sources in this region is referred to as the Kookaburra (Roberts et al., 1999), and covers nearly a square degree along the Galactic plane. Within a Northeasterly excess in this complex labeled “K3” D’Amico et al. (2001) discovered PSR J1420–6048 (hereafter J1420), a young energetic pulsar with period 68 ms, characteristic age kyr, and spin down energy . The NE2001 dispersion measure model (Cordes & Lazio, 2002) of this pulsar places it 5.6 kpc distant. Subsequent ASCA observations by Roberts et al. (2001b) revealed extended X-ray emission around this pulsar, and Ng et al. (2005) further examined the K3 pulsar wind nebula (PWN) with Chandra and XMM-Newton, resolving a bright inner nebula along with fainter emission extending from the pulsar. Aharonian et al. (2006b) report on the discovery of two bright VHE -ray sources coincident with the Kookaburra complex. HESS J1420-607 is centered just north of J1420, with best fit extension overlapping the pulsar position. The other H.E.S.S. source appears to correspond to the Rabbit nebula half a degree southwest, which is also observed in the radio (Roberts et al., 1999) and X-ray (Roberts et al., 2001a). Most recently, PSR J1420-6048 was detected by the Fermi Large Area Telescope (LAT) (Abdo et al., 2009). This crowded region clearly merits further study, and we report on new X-ray results obtained with Suzaku and XMM-Newton, as well as SED modeling of the K3 nebula.
2 Data Analysis
The Suzaku pointing (obsID 503110010) occurred on January 11-12 2009 for a total of 50.3 ks. We utilize the standard pipeline screened events, and analyze the XIS front side (XIS0 and XIS3) and back side (XIS1) illuminated chips with XSelect version 2.4. We also obtained recent archival XMM data to augment the Suzaku data; observation 0505840101 occurred on February 15 2008, for 35.0 ks, while observation 0505840201 added 5.6 ks. The second data set has a slightly different CCD placement, and suffers from high background, so we only use the 35.0 ks of data. We apply the standard data processing, utilizing SAS version 9.0. After screening the data for periods of high background 19.9 ks remain with the MOS chips. The PN chip suffers greatly from flaring, and we discard this data. Spectral fits are accomplished with XSPEC version 12.5.
2.1 Broadband Morphology and Point Sources
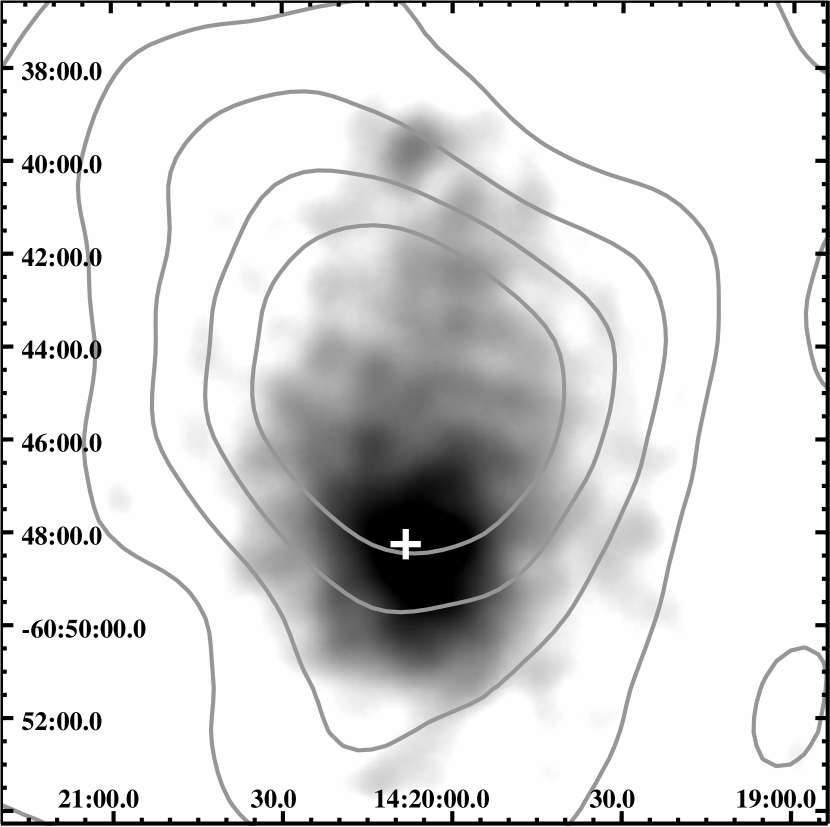
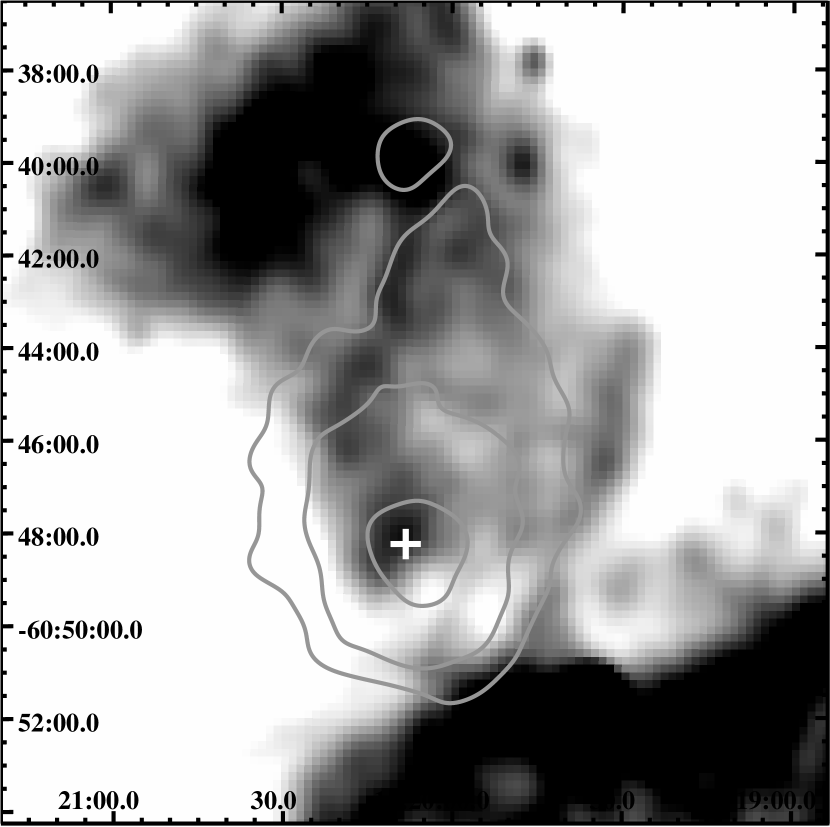
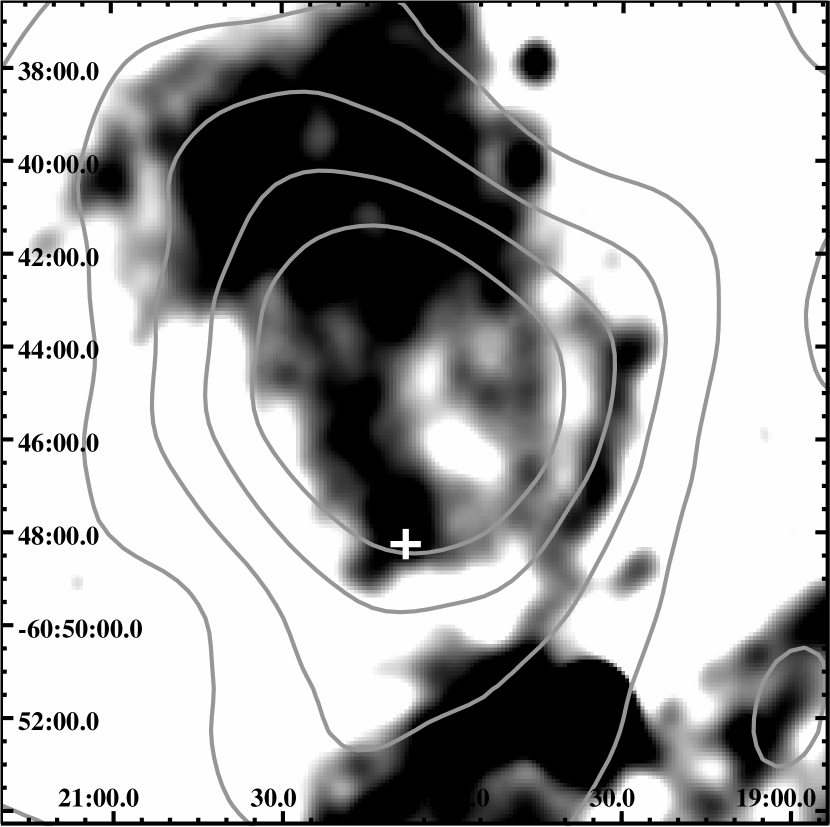
Suzaku X-ray emission is peaked in the vicinity of the pulsar, with a bright halo extending and a fainter tail extending north . A number of other excesses of emission correspond to point sources, as discussed below. Figure 1 shows the Suzaku data in the 2–10 keV band, which highlights the extended PWN emission to the north. Also depicted is the XMM exposure, clearly showing a number of point sources, though no obvious extended emission is apparent.
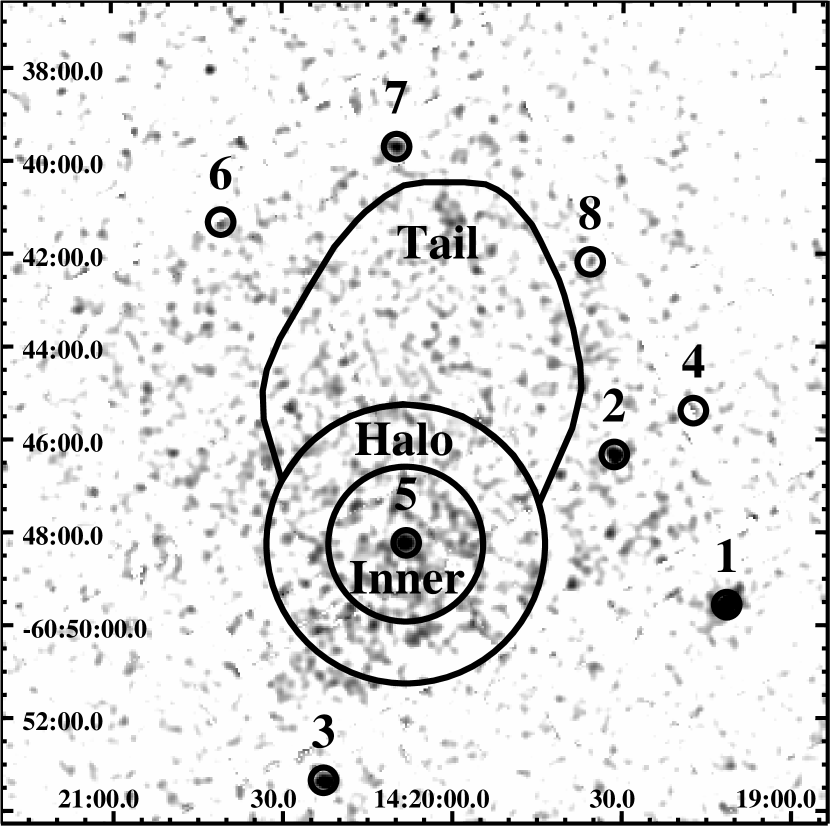
To identify X-ray point sources we use the SAS source detection function edetectchain on the XMM MOS chips and search in two energy bands of 0.3–2 keV and 2–10 keV for sources with a probability of arising from random Poissonian fluctuations. The source detection algorithm also attempts to determine source extension via a Gaussian model, though all detections are consistent with a point source. Counts are therefore extracted from a 15 pixel () radius circle. A total of 8 sources pass this test, 4 of which also appear in Ng et al. (2005): PSR J142–6048 (source 5 in our dataset), the X-ray sources denoted star 1 (source 1) and star 3 (source 2), and another point source to the southeast (source 3) unlabeled by (Ng et al., 2005) but visible in their XMM exposure. This source to the southeast is also a field star, as it appears quite bright in DSS2 red images. Of the four remaining sources, only one, a hard bright source north of the J1420 labeled source 7, lacks an optical counterpart. Source 7 also overlaps a radio hotspot to the north. Below we list the properties of these sources, defining the hardness ratio as: HR= where and are MOS counts in the 0.3–2 keV and 2–10 keV bands, respectively. It is worth noting that PSR J1420–6048 is only the fifth brightest point source in the XMM field and that all 8 XMM sources appear as excesses in the soft band Suzaku data as well. All point sources are quite soft, save for J1420 and source 7.
| No. (**(Ng et al., 2005) counterpart) | R.A. | Dec. | Pos. Err. | Counts | HR |
|---|---|---|---|---|---|
| 1 (Star 1) | |||||
| 2 (Star 3) | |||||
| 3 (Unlabeled) | |||||
| 4 | |||||
| 5 (PSR J1420–6048) | |||||
| 6 | |||||
| 7 | |||||
| 8 |
On a larger scale, extended emission is observed in all wavebands. Australia Compact Telescope Array (ATCA) observations within the error ellipse of 3EG J1420–6038 (which is broad enough to encompass both the K3 wing and the Rabbit nebula) by Roberts et al. (1999) revealed the “K3” excess, a resolved knot of emission surrounding the pulsar of flux density 20 mJy at 20 cm with index . Adjacent is the “K2 wing,” with 1 Jy at 20 cm and index of . Closer inspection of the both the 13 cm and 20 cm continuum maps reveal that J1420 lies on the southeastern rim of an apparent radio shell in radius. This shell is also apparent in the SUMSS 843 MHz map of the region. The center of this shell coincides with a dearth of emission in Spitzer maps. We place extended PWN upper limits in the radio by measuring the 843 MHz, 20 cm and 13 cm flux densities from the entire shell (which is significantly larger than the X-ray extension), finding 0.61, 0.75 Janksy and 0.58 Jansky, respectively. We deem these flux densities to be upper limits since the poor spatial resolution of Suzaku prevents ascertaining how the radio and X-ray emitting regions relate. We also remeasure the K3 excess and find flux densities of 15 mJy, 19 mJy and 17 mJy at 843 MHz, 20 cm and 13 cm, respectively, consistent with the result of Roberts et al. (1999)). At higher energies HESS J1420–607 shines at 13% of the Crab (Aharonian et al., 2006b), with photon index of 2.2 and extent of centered north of the pulsar. The H.E.S.S. spectrum is extracted from a circle to minimize contamination from HESS J1418-609 (The Rabbit) to the southwest.
2.2 Spectrum
The XMM point source identification described above is valuable since the broad Suzaku PSF hinders the disentanglement of point sources from extended emission. We are accordingly free to define extended regions for spectral analysis while steering clear of the X-ray point sources; we label these “Inner,” “Halo,” and “Tail”. All spectral extraction regions lie external to the Suzaku half power radius of the 8 point sources (except the very faint and soft source 8, which slightly overlaps the “Tail”). The Northernmost emission is encompassed by the “Tail” region which extends north of the pulsar from . Suzaku does best with large regions, and accordingly we capture the pulsar and surrounding PWN emission with a circular region of radius (“Halo”). To best isolate the pulsar and inner PWN we also use a circle we call “Inner,” which is the minimum size recommended for Suzaku spectral analysis. The Suzaku background region occupies the northern and eastern edges of the field of view.
We extract Suzaku XIS spectra with XSelect from all three active XIS chips, while response files (both ARF and RMF) are generated with the xisresp script. The ASCA FTOOL addascaspec is utilized to combine the spectra and responses of the XIS front side illuminated chips (XIS0 and XIS3). The XIS1 back side illuminated chip possesses a markedly different response function from the front side illuminated chips, and so is analyzed in parallel rather than added to the other two chips. Finally, spectra are binned to a minimum of 30 counts per bin. The high XMM background prevents an adequate fit to the extended emission (flux errors of %). We are able, however, to extract the spectrum from the “Inner” region encompassing the pulsar. To minimize calibration errors due to differing chips and distance from the pointing axis, we select an XMM background region on the northeast corner of the central chip containing PSR J1420-6048. We extract XMM spectral data with the SAS function evselect, create responses with the functions rmfgen and arfgen, and group to 30 counts per bin.
To best probe spectral index variations we make a global estimate for the best fit hydrogen column density. To maximize the signal to noise, we simultaneously fit for the Suzaku “Halo” spectrum and the “Inner” XMM spectrum. For an absorbed power law model we find a of (90 % single parameter error). An individual fit to the inner PWN region indicates that an absorbed power law model provides the best fit to the data; addition of a blackbody, neutron star atmosphere, or thermal plasma (mekal) component does not improve the fit. Below 2 keV the fit to all regions significantly underestimates the flux. This feature is not well fit with a thermal plasma, neutron star atmosphere, or blackbody, and might simply constitute excess soft emission from the myriad faint sources in this crowded region. The column is marginally consistent with the value measured by Roberts et al. (2001b) of using ASCA GIS data ( radius), and matches well with the short Chandra ACIS exposure fit by Ng et al. (2005) ( radius aperture) of (1 error). The nominal total Galactic H column in this direction is estimated as (Kalberla et al., 2005) and (Dickey & Lockman, 1990).
With fixed at , we extract spectra from the three regions described above. Table 1 lists the results of fitting an absorbed power law to these regions in the 2-10 keV range; errors are 90% single parameter values. We quote 2–10 keV fluxes to compare to previous work, minimize sensitivity to the hydrogen column density fit, and mitigate soft X-ray contamination in this crowded region. In the inner region we fit simultaneously the XMM and Suzaku data, and find a power law index of . The entire “Halo” is fit with an index of , implying a steeper power law near the edge of the nebula. To further explore this, we extract the spectrum from an annulus of radius from J1420. For such annular regions the Suzaku response normalization proves unreliable, though the spectral shape is still of value. We find a power law index of ; this is indeed softer (though within errors) of the inner PWN. Further spectral softening is hinted at in the outer nebula “Tail,” which boasts an index of .
| Region | abs. flux | unabs. flux | /dof | ||
|---|---|---|---|---|---|
| cm-2 | ††2-10 keV fluxes in units of | ††2-10 keV fluxes in units of | |||
| Inner◇◇Simultaneous fit to Suzaku and XMM data | **held fixed | 333/345 | |||
| Halo | **held fixed | 219/309 | |||
| Tail | **held fixed | 138/224 |
These spectral values are largely consistent (though with smaller errors) with previous data fits. Ng et al. (2005) extract the spectrum of the inner nebula from a 2’ circle, which gives (for fixed at ) (projected multidimensional 1 sigma error), unabsorbed 2-10 keV flux (1 sigma single parameter error). Roberts et al. (2001b) measure a power law index of and a 2-10 keV flux of for an extraction region of size .
3 SED Fitting
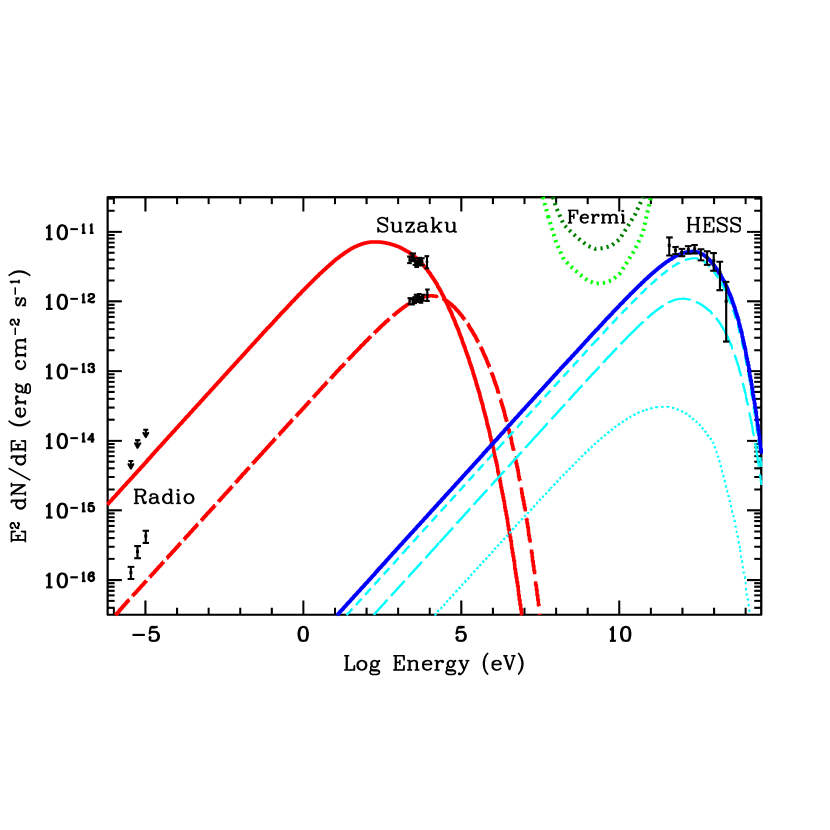
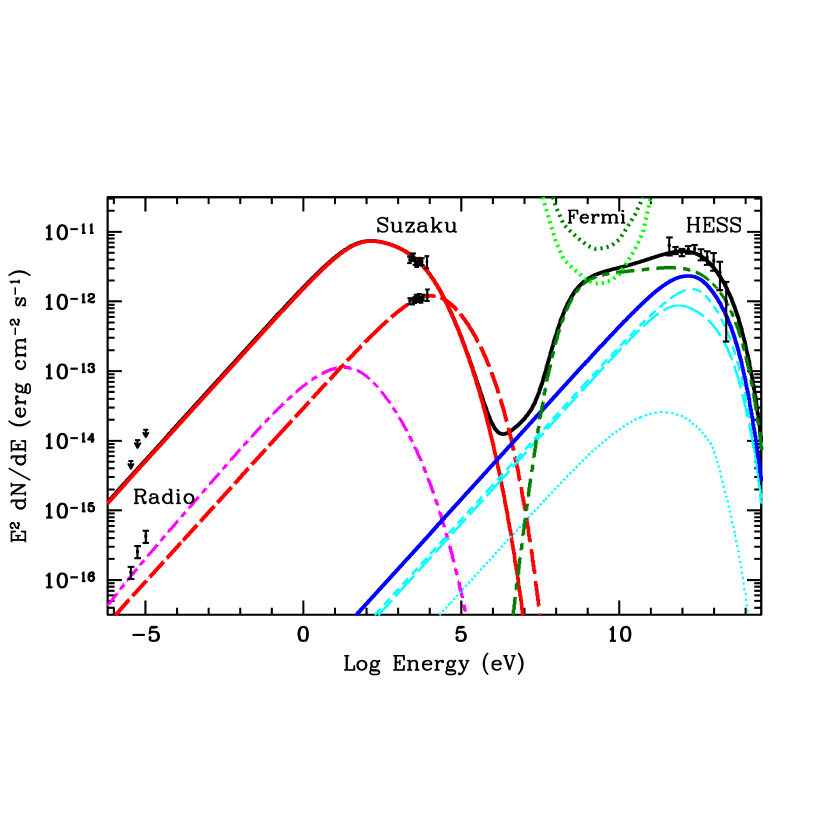
Matching SED data points can help constrain physical properties of the source. To this end we we apply a two-zone time-dependent numerical model with constant injection luminosity. We inject a power law spectrum of relativistic particles (either electrons or protons) with a high energy exponential cutoff into zone 1, and then evolve this spectrum over time according to radiation losses from synchrotron and IC (Klein-Nishina effects included). The resultant spectrum is subsequently injected into zone 2 and further evolved. Adiabatic cooling is ignored, given that offsetting heating effects of the SNR reverse shock interaction with the PWN may significantly alter particle energetics. The typical timescale for the reverse shock to reach the PWN is kyr (Reynolds & Chevalier, 1984), while the characteristic age of the pulsar is only 13 kyr, so this perturbation may still be felt. The complex nature of this interaction is also why we use a constant injection luminosity rather than allowing injection luminosity to vary with pulsar spin down power. Injection (and evolution) occurs in time steps much smaller than the assumed age. We consider a low density environment with density = 1 cm-3 and photon fields comprised of CMBR, near IR, and far IR (though starlight is unimportant due to Klein-Nishina suppression of IC at high photon energies). Our two zones are defined as the inner region surrounding the pulsar (zone 1) and the broader extended nebula (zone 2). Figures 3 and 4 show the SED of J1420. While we must select spectral extraction regions such that interference from stellar sources is minimized and region surface brightness remains significantly above background, the nebular flux extends beyond these regions. An estimate of the total nebular flux is essential if we wish to compare the X-ray flux with the VHE flux, which is extracted from a large circle. To estimate the total extended nebula flux, we extract 2-10 keV counts from a large ellipse in radius which seems to encompass the majority of the X-ray flux (excluding point sources within this field) and find 40% more counts in this region than the combined “Halo” plus “Tail” minus “Inner” region. We therefore extrapolate that the total extended nebular flux is 40% greater than the combined “Halo” plus “Tail” minus “Inner” fluxes. Accordingly, for SED modeling of the extended nebula we plot the spectral points from the “Tail” region, scaled up to represent this estimated 2-10 keV flux of .
wn Figures 3 and 4 We plot the gamma-ray flux from HESS J1420–607, along with radio and X-ray data. Also indicated are the Fermi LAT one-year and ten-year flux limit for a point source residing in a background greater than the extragalactic background, which is reasonable for the Galactic plane.
3.0.1 Leptonic gamma-ray emission model
For an X-ray spectral index approximately flat on the SED plot one cannot easily match the X-ray data to the H.E.S.S. data. A single electron injection component works, but only after significant fine tuning of injection and ambient medium parameters. A dual component injection comprises the other alternative, though the attentive reader might note that the northern X-ray nebula spatially corresponds quite well to the H.E.S.S. position and size, hinting at a single electron population responsible for both types of emission. If one assumes all particles evolve in the same spatial region (and hence same magnetic field and ambient photon field) one cannot independently fit the X-ray data to one component and VHE data to another significantly different component. Therefore, we refrain from displaying the unsatisfactory dual component fits, and focus on a single component model.
A single electron component demands that the H.E.S.S. detection arise from IC scattering of far IR photons, as the CMB provides insufficient seed photons to account for the VHE peak given the constraints imposed by the X-ray data. For the Galactic radius of J1420, far IR photons typically peak at K with a density eV (Porter et al., 2006). We find a better fit with a denser far IR photon field (2 eV), which is reasonable given the large scatter in ambient photon fields throughout the Galaxy. The starlight photon field is taken to have a temperature of 3500 K with density 1 eV.
The innermost region is populated by young electrons emitting in a relatively strong magnetic field. In the ideal case of a magnetic dipole, the pulsar surface magnetic field can be estimated as where is in seconds. This gives a surface magnetic field of G for PSR J1420–6048. If one assumes the magnetic field is dipolar out to the light cylinder, and then falls off as the inverse of radius past the light cylinder, the volume averaged magnetic field out to from the pulsar is calculated as . Without knowledge of where the bulk of the synchrotron emission stems from (given the poor spatial resolution of Suzaku) we therefore adopt a mean magnetic field of of for the innermost region. Electrons responsible for the hard X-rays can diffuse out of this region in as little as 400 years, as shall be seen in Section 4. We therefore evolve the inner zone 1 electrons over 500 years. A power-law distribution of electrons with the standard index of 2 is injected, with a high energy cutoff at 400 TeV. For these parameters, we require an energy in the innermost region of erg in the form of leptons, where distance . The electron index of 2 underpredicts the K3 radio flux excess by a factor of . A slightly softer electron index allows us to fit the radio points, but increases the energy requirements by a factor of and results in an outer nebula radio flux butting up against the upper limits established above. Better constraints on the non-thermal radio emission from this region would aid greatly in differentiating between models.
In a magnetic field of evolving over 500 years results in a lepton spectral break at TeV. This broken spectrum is subsequently injected into zone 2, the outer nebula. With this electron spectrum and for the photon field described above the outer nebula requires a total lepton energy of erg in order to fit the H.E.S.S. data. This energy requirement is reasonable for an extended PWN, and can be compared to the Vela X nebula possessing erg in the form of leptons (de Jager, 2007). Evolving the electrons over 12.5 kyr places the X-ray and VHE emitting electrons in the cooled regime for the G field we select to match the X-ray data.
3.0.2 Hybrid hadronic and leptonic gamma-ray emission model
One can also model the VHE gamma-rays as the product of pion decay from proton proton interactions. The timescale for pion production via p-p interactions is given by years (Blumenthal, 1970); this timescale is significantly greater than the expected age of the system, so the proton spectrum is treated as static. For an injected power law proton spectrum, we calculate the photons from proton-proton interactions and subsequent and -meson decay following Kelner et al. (2006). Proton-proton interactions also yield mesons which decay into secondary electrons, which we evolve over 13 kyr. IC and synchrotron emission from the resultant secondary electron spectrum are subsequently calculated.
Secondary electrons evolved over 13 kyr cannot possibly account for the radio or X-ray data from the extended nebula for plausible magnetic fields. We nevertheless indicate on Figure 4 the synchrotron radiation from secondary electrons. The X-ray data must therefore be attributed to synchrotron radiation from a primary electron population. We adopt the same two-zone lepton model described above, though with the outer nebula parameters tweaked slightly. We adopt the typical far IR field density of eV, reduce lepton injection energy by % in the outer nebula, and adopt a magnetic field of G for this region. A magnetic field any greater than this is precluded both by the radio data and by increased synchrotron cooling, which steepens the synchrotron slope in the Suzaku range. With these parameters gammas from pion decay can account approximately equally with IC emission for the VHE data. The hadronic contribution to the H.E.S.S. detection can be modeled by a a proton power law of index 2, cutoff at 200 TeV, and energy erg. The SED from this hybrid hadronic plus leptonic scenario is shown in Fig 4. We omit the inconsequential IC radiation from secondary electrons.
4 Discussion
X-ray flux extending north of the pulsar indicates a spatial extent of pc. Though this requires an average flow speed of under 1% the speed of light for a 13 kyr age, diffusion across magnetic field lines can be an extremely slow process. For a cooling limited electron source with Bohm diffusion, the diffusion timescale varies with size (), magnetic field (), and electron energy () as:
Therefore over the kyr lifetime of J1420, the inferred presence of distant VHE electrons is likely due to a different process than simple diffusion, as discussed in the next section.
The observation of hard synchrotron X-rays requires an efficient particle accelerator, since in a transverse magnetic field the mean synchrotron photon energy () scales as:
Such energetic electrons cool rapidly, however, on a timescale of:
Therefore the cooling timescale for electrons radiating photons at mean energy is:
Synchrotron cooling dominates over IC cooling for electron energies above 5 TeV for the external photon and magnetic fields chosen, so we consider only synchrotron cooling in the following discussion. The electron cooling break results in a similar break in the emitted photon spectrum, which scales with magnetic field and age () as:
This break is apparent in the models plotted in Figures 3 (break at eV) and 4 (break at 30 eV).
The break location is also of key importance to IC modeling of the H.E.S.S. detection. Electrons upscatter blackbody photons (at temperature ) to a mean energy of:
where we scale to the value adopted for the far IR field. HESS J1420–607 appears to peak in flux at TeV; we expect this peak to result from a cooling break rather than an exponential cutoff in the electron spectrum due to the need for significant numbers of VHE electrons to synchrotron radiate in the X-ray regime. Inserting the value of TeV into Equation 6 we see that at the break:
This VHE break is primarily due to synchrotron cooling, so substituting Equation 7 into Equation 3 yields an estimate for the mean magnetic field strength in the nebula:
While this range of magnetic field (which ignores IC cooling) should not be taken too seriously, the fact that the 8 G field we selected for single component modeling also matches the X-ray data lends some credence to this estimate.
Comparing the merits of each model, we find that the leptonic model provides a slightly better fit to the data, without the cost of the additional spectral components of the hybrid model. In addition, in order for pion decay to account for the VHE emission completely the energy in protons exceeds erg for a typical density of , and the fit to the lower energy H.E.S.S. data points is unimpressive. Even with erg in hadrons, a primary electron population required to match the X-ray data contributes significantly to the VHE flux via IC, as seen in Figure 4. Only by raising the ambient magnetic field to G and lowering the total energy budget of this electron population can the IC from these electrons be rendered insignificant. Yet for a magnetic field of this magnitude synchrotron cooling results in a 2–10 keV photon spectrum far steeper than our measured data, plus such a high magnetic field over such a large region would be surprising. The high energy requirement in hadrons, as well as the need for two, rather than one, highly tuned injection components makes the hybrid model a less appealing explanation for the observed extended nebula fluxes than a single electron population. In addition, further support for the leptonic model stems from its ability to account for the innermost X-ray flux with a younger population of similar electrons radiating in the stronger magnetic field near the pulsar.
Early detection by the Fermi LAT of the K3 nebula would undermine this assumption of a single electron component, however, as in this model very little flux is expected in the GeV range. Furthermore, a photon index of (where is the electron index) is expected, which for our injection would imply a hard LAT index of 1.5. Detection by the LAT is much more likely in the hadronic scenario, and one would expect a GeV index of . A LAT index steeper than 2 cannot be matched by either model, and would imply the existence of another particle population, likely electrons. Indeed, de Jager et al. (2008) suggested the Vela X nebula could be modeled with two populations of electrons. Such a situation for the K3 nebula would allow for detection by the LAT, and might also explain the radio excess. LAT detection of the K3 nebula would also greatly aid in distinguishing between scenarios, though even LAT flux upper limits might preclude the hybrid model.
4.1 Birthsite
The radio, X-ray, and VHE data all hint at a pulsar birthsite to the north. The possible radio filament extending to the hotspot to the North might mark the synchrotron trail of J1420’s proper motion. The nature of the X-ray (source 7) and radio point source at the end of this tail remains mysterious, though an AGN provides a likely candidate. The radio “filament” might also mark the eastern boundary of the apparent radio shell mentioned in Section 2. Under this assumption, the pulsar could have originated northwest at the center of this shell. With this assumption, electrons spewed off the pulsar and left behind by its motion should also synchrotron radiate in the X-rays and emit VHE photons via IC scattering off field photons. The observed X-ray tail to the North, and the H.E.S.S. position offset in this direction nicely support this hypothesis. If the pulsar indeed originated distant this implies a reasonable velocity of
The northern tail could alternatively indicate an asymmetric reverse shock returning from the South has crushed and displaced the K3 PWN, much like the situation observed in Vela X (Blondin et al., 2001). The pulsar birthsite would remain unconstrained by our X-ray observations in this scenario. Indeed, Johnston & Weisberg (2006) measured the polarization angle of the polarization sweep, which they argue correlates with the velocity. The perpendicular of this line (marking the pulsar spin and likely proper motion axis if it is emitting in the orthogonal mode) points southwest back to the shell body of the Kookaburra away. Association would require a very high space velocity of .
5 Conclusions
The Suzaku data provides the first deep mapping of the asymmetric extended X-ray emission surrounding J1420. The spectral index appears to soften in the outer nebula, as expected in a leptonic model with synchrotron cooling of electrons. SED studies of this nebula allow for a hybrid leptonic hadronic model, yet favor a pure leptonic model if one takes into account energy requirements and the degree of tuning required to fit the hybrid model. The outer nebula also yields information about the pulsar birthsite, hinting at an origin to to the North, though admittedly the northern X-ray tail could be due to reverse shock interaction with the PWN and therefore not correspond to the pulsar velocity. Further investigation of the apparent radio shell along with deeper Chandra imaging of the compact nebula might also help elucidate the origin of PSR J1420–6048.
Acknowledgments: We thank Stefan Funk for useful comments on this paper.
References
- Abdo et al. (2009) Abdo, A. A., & for the Fermi LAT collaboration 2009, arXiv:0910.1608
- Aharonian et al. (2006a) Aharonian, F., et al. 2006, A&A, 448, L43
- Aharonian et al. (2006b) Aharonian, F., et al. 2006, A&A, 456, 245
- Blondin et al. (2001) Blondin, J. M., Chevalier, R. A., & Frierson, D. M. 2001, ApJ, 563, 806
- Blumenthal (1970) Blumenthal, G. R. 1970, Phys. Rev. D, 1, 1596
- Cordes & Lazio (2002) Cordes, J. M., & Lazio, T. J. W. 2002, arXiv:astro-ph/0207156
- D’Amico et al. (2001) D’Amico, N., et al. 2001, ApJ, 552, L45
- de Jager (2007) de Jager, O. C. 2007, ApJ, 658, 1177
- de Jager et al. (2008) de Jager, O. C., Slane, P. O., & LaMassa, S. 2008, ApJ, 689, L125
- Dickey & Lockman (1990) Dickey, J. M., & Lockman, F. J. 1990, ARA&A, 28, 215
- Johnston & Weisberg (2006) Johnston, S., & Weisberg, J. M. 2006, MNRAS, 368, 1856
- Kalberla et al. (2005) Kalberla, P. M. W., Burton, W. B., Hartmann, D., Arnal, E. M., Bajaja, E., Morras, R., Pöppel, W. G. L. 2005, A&A, 440, 775
- Kelner et al. (2006) Kelner, S. R., Aharonian, F. A., & Bugayov, V. V. 2006, Phys. Rev. D, 74, 034018
- Ng et al. (2005) Ng, C.-Y., Roberts, M. S. E., & Romani, R. W. 2005, ApJ, 627, 904
- Porter et al. (2006) Porter, T. A., Moskalenko, I. V., & Strong, A. W. 2006, ApJ, 648, L29
- Reynolds & Chevalier (1984) Reynolds, S. P., & Chevalier, R. A. 1984, ApJ, 278, 630
- Roberts et al. (1999) Roberts, M. S. E., Romani, R. W., Johnston, S., & Green, A. J. 1999, ApJ, 515, 712
- Roberts et al. (2001a) Roberts, M. S. E., Romani, R. W., & Kawai, N. 2001, ApJS, 133, 451
- Roberts et al. (2001b) Roberts, M. S. E., Romani, R. W., & Johnston, S. 2001, ApJ, 561, L187