Searching for the inverse-Compton emission from bright cluster-centre radio galaxies
Abstract
We use deep archival Chandra and XMM-Newton observations of three of the brightest cluster-centre radio galaxies in the sky, Cygnus A, Hercules A and Hydra A, to search for inverse-Compton emission from the population of electrons responsible for the low-frequency radio emission. Using simulated observations, we derive robust estimates for the uncertainties on the normalization of an inverse-Compton component in the presence of the variations in background thermal temperature actually seen in our target objects. Using these, together with the pressures external to the lobes, we are able to place interesting upper limits on the fraction of the energy density in the lobes of Hydra A and Her A that can be provided by a population of relativistic electrons with standard properties, assuming that the magnetic field is not dominant; these limits are consistent with the long-standing idea that the energy density in these lobes is dominated by a non-radiating particle population. In Cygnus A, we find evidence in the spectra for an additional hard component over and above the expected thermal emission, which is plausibly a detection of inverse-Compton emission; even in this case, though, some additional non-radiating particles and/or a departure from our standard assumptions on the electron spectrum are necessary to allow pressure balance at the mid-point of the lobes. As this is not the case in other Fanaroff-Riley class II radio galaxies, we suggest that the rich environment of Cygnus A may have some effect on its lobe particle content.
keywords:
galaxies: active – X-rays: galaxies– radiation mechanisms: non-thermal1 Introduction
Inverse-Compton emission appears in many powerful, Fanaroff & Riley (1974) class II (hereafter FRII) radio galaxies (e.g. Hardcastle et al. 2002; Isobe et al. 2002; Kataoka & Stawarz 2005; Croston et al. 2005; Hardcastle & Croston 2005; Isobe et al. 2005; Konar et al. 2009; Isobe et al. 2009) to be the dominant X-ray emission mechanism on the scales of the radio lobes, readily detectable in X-ray observations with moderate sensitivity using Chandra, XMM-Newton, or, for giant sources, Suzaku. The close similarity between the radio and X-ray structures, the agreement between predicted and observed flux levels, and, where it can be measured, the spectrum of the emission are all consistent with the inverse-Compton model (e.g. Hardcastle & Croston 2005). This allows us to use lobe-related X-ray emission as a very sensitive probe of the energy density in low-energy electrons within the lobes, and, for example, to search for variations in the magnetic field and electron energy spectrum as a function of position (e.g. Isobe et al. 2002; Hardcastle & Croston 2005; Goodger et al. 2008). Comparison of the energy densities in electrons and magnetic field in the lobes with the external pressures (e.g. Hardcastle et al. 2002; Croston et al. 2004; Konar et al. 2009) suggests that the lobes of these inverse-Compton detected sources do not contain an energetically dominant population of non-radiating particles such as protons.
Less attention has been paid so far to the implications of inverse-Compton emission in the large number of objects in which it has so far not been detected. This includes, at the time of writing, all classical twin-jet FRI sources, as well as FRII radio galaxies in environments much richer than a poor cluster, including some well-studied objects such as Cygnus A (Wilson et al. 2000), 3C 123 (Hardcastle et al. 2001), 3C 295 (Harris et al. 2000) and 3C 220.1 (Worrall et al. 2001). In such objects it is assumed that the inverse-Compton emission is present at some level (as it must be, since inverse-Compton emission is a required counterpart of the observed synchrotron emission) but is not readily visible, even in sources in which it might otherwise be predicted to be seen, because of the bright thermal bremsstrahlung from the group or cluster environment.
| Source | 3C name | LAS | LLS | (cm-2) | |||||
|---|---|---|---|---|---|---|---|---|---|
| (Jy) | (W Hz-1 sr-1) | (arcsec) | (kpc) | (NRAO) | (LAB) | ||||
| Hydra A | 3C 218 | 0.054 | 228 | 0.70 | 470 | 493 | |||
| Hercules A | 3C 348 | 0.154 | 351 | 1.00 | 193 | 515 | |||
| Cygnus A | 3C 405 | 0.0565 | 9660 | 0.74 | 129 | 141 | |||
Superficially, this explanation makes some physical sense in the case of the FRIIs in rich cluster environments. If we assume [motivated by the results of Hardcastle et al. (2002) and Croston et al. (2005)] that the internal pressure in these objects is dominated by electrons and magnetic field, with the electrons being energetically dominant by some factor , i.e.
(where is the electron energy, is the electron energy spectrum, is the magnetic field strength and is the magnetic constant) and moreover that the electron energy spectra at the (numerically dominant) low energies are similar in all sources, then for pressure balance with an external medium with pressure we have
and thus the normalization of the electron energy spectrum scales linearly with . The volume emissivity for inverse-Compton scattering of a given photon field goes as the number density of electrons of the appropriate energy (with Lorentz factors for scattering of CMB photons into the X-ray at ) and so the observed inverse-Compton surface brightness goes as the line-of-sight depth through the lobe, , times . On the other hand for thermal bremsstrahlung we have , where is the temperature and and are the proton and electron densities respectively, we know that where is a constant of order unity, and we have a volume emissivity that goes as . It follows that the volume emissivity scales as as , where is a characteristic line-of-sight depth that depends on the spatial structure of the hot gas but that will be of the same order of magnitude as . Neglecting temperature effects (i.e. making the observationally motivated assumption that varies comparatively little over the typical environments of radio galaxies, and that differences in pressure are dominated by differences in density) we see that there is a stronger dependence of the bremsstrahlung emissivity on than there is for the inverse-Compton emissivity; thus, at any given redshift (which fixes both the photon number density of the CMB and the rest-frame waveband in which we are operating) we expect that there will be some external pressure at which thermal bremsstrahlung will come to dominate the observed X-ray surface brightness, and therefore will prevent a straightforward detection of inverse-Compton emission.
It is much less obvious that this type of argument can explain the lack of observed inverse-Compton emission in the lobes of FRI sources, which are often found in group environments very similar to those of low-power FRIIs and so might be expected to have similar levels of inverse-Compton detectability. However, in these sources we already know that the model discussed above is not valid, in the sense that the internal pressure of the lobes is almost certainly not supplied by electrons and magnetic fields close to equipartition (e.g. Croston et al. 2008 and references therein). In this case quantitative limits on inverse-Compton emission from the lobes would put some constraints on the contribution of electrons to the total internal pressure. In the past we have used the lack of detected inverse-Compton emission to rule out models in which the energetics of FRI lobes are dominated by electrons (e.g. Hardcastle, Worrall & Birkinshaw 1998b, Croston et al. 2003) but little work has been done beyond that except in some rather specialized cases (e.g. Jetha et al. 2008).
In this paper we explore the constraints that can be put on the level of lobe inverse-Compton emission that is present in systems, both FRI and FRII, in which it cannot readily be detected by eye. We show that it is possible to place interesting limits on the inverse-Compton emission from powerful FRIs and intermediate-morphology sources even in rich environments, supporting a model in which electrons provide a negligible fraction of the internal pressure in the large-scale lobes of these objects. We argue that there is a significant detection of inverse-Compton emission from the lobes of the powerful FRII Cygnus A, although the simulation-derived uncertainties on its normalization are large. Our results may shed some light on the mechanism by which the large-scale components of radio sources in rich environments come to be dominated by a non-radiating particle population.
In what follows we use a concordance cosmology with km s-1 Mpc-1, and . Spectral indices are the energy indices and are defined in the sense that flux ; the photon index .
2 Data
Our aim is to select sources that sample a range of radio morphological or luminosity classes, from twin-jet to classical FRII sources, and that a priori plausibly should have a strong inverse-Compton signal. In the past (Hardcastle & Croston 2005, Goodger et al. 2008) we have based our selection on low-frequency radio flux, on the basis that this is a good indicator of the presence of the electrons required to scatter microwave-background photons into the X-ray band. If we look at the brightest ten or so extragalactic objects in the sky at 100-MHz frequencies, the radio galaxies that do not yet have lobe inverse-Compton detections (setting aside the special case of Cen A; see Hardcastle et al. 2009 for a discussion of the existing and future limits on inverse-Compton emission from this object) are Cygnus A (3C 405), Virgo A (M87, 3C 274), Hydra A (3C 218) and Hercules A (3C 348). Of these, we exclude M87 because of the very complex relationship between its thermal X-ray emission and large-scale low-frequency radio structure (e.g. Simionescu et al. 2007) leaving us with Cyg A, Her A and Hydra A (Table 1). Conveniently these three are, respectively, an archetypal FRII source, an object with intermediate FRI/FRII morphology (e.g. Gizani & Leahy 2003) and a plumed FRI, probably a wide-angle tail (by the definition of Leahy 1993), although it is worth noting (see Table 1) that all three lie well above the original FRI/FRII luminosity break ( W Hz-1 sr-1). All three of these radio galaxies lie in rich cluster environments and have X-ray emission that is clearly dominated by thermal bremsstrahlung and that does not display a particular complex relationship to the radio source. Thus they provide both a scientifically interesting sample and an appropriate starting point for a study of inverse-Compton emission in the presence of dominant thermal emission.
| Source | Observatory | Date | Observation ID | Detector | Livetime (s) |
|---|---|---|---|---|---|
| Hydra A | XMM-Newton | 2007 May 11 | 0504260101 | EPIC | 56801, 91356, 91092 |
| Hercules A | Chandra | 2005 May 09 | 5796 | ACIS-S | 47544 |
| 2005 May 25 | 6257 | ACIS-S | 49518 | ||
| Cygnus A | Chandra | 2000 May 21 | 360 | ACIS-S | 34720 |
| 2005 Feb 22 | 5830 | ACIS-I | 23454 | ||
| 2005 Feb 16 | 5831 | ACIS-I | 51093 | ||
| 2005 Feb 15 | 6225 | ACIS-I | 24308 | ||
| 2005 Feb 19 | 6226 | ACIS-I | 23833 | ||
| 2005 Feb 25 | 6228 | ACIS-I | 16038 | ||
| 2005 Feb 23 | 6229 | ACIS-I | 22753 | ||
| 2005 Feb 21 | 6250 | ACIS-I | 6957 | ||
| 2005 Sep 07 | 6252 | ACIS-I | 29653 |
Large amounts of archival X-ray data are available for all three of these sources (Table 2). For Hydra A, with a largest angular size around 7 arcmin, we have chosen to use the XMM-Newton dataset described by Simionescu et al. (2009), although there is also deep Chandra data (Wise et al. 2007). For Her A we use unpublished archival Chandra data which go somewhat deeper than the observations described by Nulsen et al. (2005). Finally, for Cygnus A, we use the extensive Chandra dataset described by e.g. Wilson, Smith & Young (2006).
The X-ray data were reprocessed from the archive in the standard manner using ciao 3.4 for the Chandra observations and sas 8.0 for XMM. For the XMM data we filtered using the standard flags. As the observation was somewhat affected by flaring, we filtered data in the standard manner, using a light curve for the whole FOV of each camera in the nominal energy range 10–15 keV and excluding intervals where the count rate in this band exceeded 1 count s-1 (pn) or 0.35 s-1 (MOS). No time filtering was necessary for the Chandra data. Spectra were extracted using especget (XMM) or specextract (Chandra) and grouped to have either 40 (XMM) or 20 (Chandra) counts per bin after background subtraction (the larger binning factor used for the XMM data was intended to compensate for the lower signal-to-noise of the regions of interest). Throughout the paper spectral fitting was carried out using xspec 12.
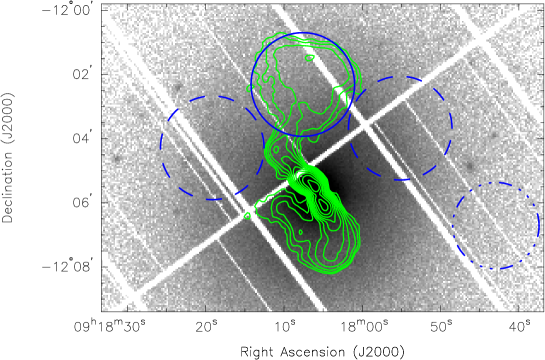
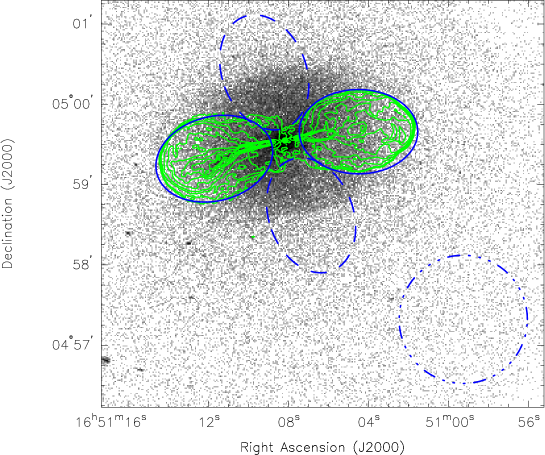
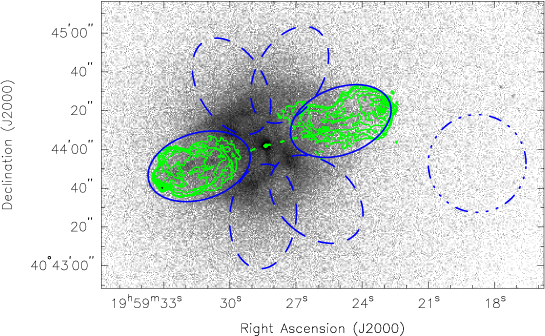
Radio data are necessary to interpret inverse-Compton detections or upper limits. For Cygnus A, we used the 5-GHz radio map of Carilli et al. (1991), obtained from the NCSA Astronomy Digital Image Library111http://imagelib.ncsa.uiuc.edu/imagelib.html. For Hydra A, we used the 74-MHz and 330-MHz images of Lane et al. (2004), kindly supplied by Wendy Lane, while for Her A the maps used are the 1.4 and 5-GHz maps of Gizani & Leahy (2003), kindly provided by Paddy Leahy. X-ray images of the three objects investigated in this paper, with radio contours and lobe regions overlaid, are shown in Fig. 1.
Finally, for spectral fitting, especially of complex models, it is necessary to have an estimate of the level of Galactic absorption. When searching for weak non-thermal inverse-Compton emission in the presence of strong thermal emission, an incorrect estimate of the absorbing column can lead to false positives (or negatives), while leaving it free in the fits is also likely to have bad effects. There are several sources of systematic errors in the standard way of inferring this from the Galactic neutral hydrogen column density, . Firstly, we invariably make the assumption, except when forced not to, that the neutral hydrogen is the only tracer of metals in the Galaxy, although molecular hydrogen can be important at some locations on the sky; secondly, we assume a fixed elemental abundance in the absorbing material; and thirdly, we have to rely on radio-based measurements of the column density which may not be accurate. The first of these is not known to be a problem in the case of any of our targets, and there is little we can do about the second. However, to assess the degree to which the third is a problem, we used two different widely used databases to estimate interpolated values for the Galactic . These were the compilation of Dickey & Lockman (1990), as provided by the standard Chandra on-line proposal planning tool COLDEN222See http://cxc.harvard.edu/toolkit/colden.jsp ., and the more recent, higher-resolution Leiden/Argentine/Bonn Galactic HI survey (Kalberla et al. 2005) for which an on-line search tool is also available333See http://www.astro.uni-bonn.de/~webaiub/english/tools_labsurvey.php. Both values are tabulated in Table 1 and it will be seen that there are differences at the level of 10–20 per cent for each source, which allows us to get an idea of the potential systematic effects on the results. We comment below on the effects of using the two different estimates of Galactic in our spectral fitting.
3 Methods
In systems in which there is a clear excess of X-ray emission associated with the lobe, estimating the inverse-Compton flux and, if possible, measuring its spectrum is relatively easy, using local (off-lobe) background regions to account for contamination by thermal emission from the regions in front of and behind the lobe (as done by, e.g., Hardcastle & Croston 2005). By doing this we implicitly assume that any difference between the surface brightness of thermal emission on and off-lobe may be neglected; this is a safe assumption if the lobe-related emission is clearly dominant.
The situation is very different in our chosen targets. Here it is no longer safe to assume that the variation in the surface brightness of the thermal emission can be neglected; there may well be visible ‘cavities’ in the thermal emission associated with the lobes, as already seen in Cygnus A (Wilson et al. 2006) and Hydra A (Wise et al. 2007), in which case naïve local background subtraction would give negative fluxes for any inverse-Compton emission. More problematically, there may be variations in the temperature or abundance of the thermal emission on scales comparable to those of the lobe. Failure to account for these can in principle give spectral differences between the lobe and off-lobe regions that can mimic the power-law spectrum of inverse-Compton emission. On the other hand, accounting for them by allowing the fitted temperature or abundance of the thermal emission coincident with the lobe to vary freely will almost certainly reduce or remove any spectral evidence for additional inverse-Compton emission. In assessing the implications of any spectral detection or non-detection of inverse-Compton emission it is necessary to understand (1) whether the method being employed is actually capable of detecting inverse-Compton if it is present, (2) whether it is biased and what the uncertainties are on any detection, and (3) what upper limits on inverse-Compton emission can be assigned in the case of a non-detection.
To investigate these problems we carried out extensive xspec simulations for each source. We first defined spectral extraction regions appropriate to the lobes of the radio sources of interest. These consisted of the lobe region itself; two adjacent, identically sized regions (‘off-lobe’ regions) intended to allow us to estimate the local properties of thermal emission; and an ‘off-source’ background region for which the surface brightness of thermal emission was much less than that in the on-source regions (though for all of these sources it is hard to select a local background region which is free of any thermal emission) which was used as background for all three on-source regions. We extracted spectra from these regions using the appropriate ciao and sas tools, and by fitting apec models to measure the temperature and abundances in the three on-source regions, assuming that they can be described by a single temperature, we were able to characterise the properties of the thermal emission near to the lobes. (Details of the fitted results for the target sources are discussed in the next section of the paper.)
Using these fits we were then able to simulate, within xspec, realistic observations of sources with comparable properties, using the response files determined from the real datasets. Our simulations included a spectrally realistic background (modelled using fits to the real background data) and the simulated data were background-subtracted and grouped in exactly the same way as for the real data. The normalizations of the thermal (apec) models used for the three on-source regions, and their metal abundance (assumed constant, since spatial variations in abundances for our targets, though non-zero where they have been investigated, are not large on the relevant scales: see Simeonescu et al. (2009) and Smith et al. (2002) for the cases of Hydra A and Cygnus A respectively), were based on the real data, so that the statistics were guaranteed to be realistic. However, the temperatures of the thermal models were not fixed for each simulation, but drawn from a Gaussian distribution with a mean set equal to the temperature determined from a joint fit to the two off-lobe regions and with a dispersion estimated from the standard deviation of the two individually fitted temperatures; this was intended to take account both of the uncertainty in the fitted temperatures and of the possibility of variation in the temperature as a function of the position in the cluster. In addition, a power-law component with a fixed photon index (for these simulations we initially used 1.5; see below for more discussion of this point) and a variable normalization was added to the simulated data for the lobe region. For a non-zero normalization of this component, we could investigate whether a given method for estimating the level of inverse-Compton could recover an unbiased estimate of the normalization and estimate confidence limits on fits. If the normalization was set to zero, the simulations allowed us to estimate upper limits for non-detections.
We emphasise that this method is mainly designed to assess the effect on the power-law normalization of point-to-point variations in the temperature and normalization of a single-temperature model. Taking account of possible multiple temperatures within a region would be possible, but cumbersome, and clearly impossible to do in full generality, since the regions of interest could contain an arbitrary number of different components. However, the uncertainties on the power-law normalization should be reasonably accurate to the extent that the orginal models used are reasonable representations of the off-lobe regions, i.e. that the fit of a single-temperature model is reasonably good. We do not require a thermal model to represent the cluster physics exactly so long as it characterizes the overall spectral shape and its variations adequately.
Within this framework we investigated four possible methods for estimating the level of inverse-Compton emission from the lobe regions from spectral fitting. In all four, the basic approach was to fit models consisting of thermal emission only to the two off-lobe regions and a model consisting of thermal emission plus a power-law component with fixed to the lobe region, with the thermal normalizations of all regions free to vary in order to take proper account of the known or probable cavities in the X-ray emission associated with the radio lobes. The models differed in the way in which they related the properties of the thermal emission from the off-lobe and lobe regions, as summarized below:
-
1.
Abundances for lobe and off-lobe regions are tied together, but the on-lobe temperature is free to vary.
-
2.
Both abundances and temperatures for the lobe and off-lobe regions are tied together (i.e. we fit a single temperature and abundance for the whole region).
-
3.
The two off-lobe regions are allowed to have different temperatures, and the temperature fitted to the lobe region is constrained to be the mean of the temperatures fitted to the two off-lobe regions (the abundance is jointly derived from the two off-lobe regions; as in practice little abundance variation is seen, a model in which the mean abundance was used would be similar).
-
4.
A single temperature and abundance are determined from a joint fit to the off-lobe regions only, and then frozen in a separate fit to the lobe region (i.e. only the normalization of the thermal and non-thermal components are free to vary in the fit to the lobe region).
Clearly these four models represent different tradeoffs between, on the one hand, the necessity to constrain some aspect of the lobe model from the off-lobe data and, on the other, the recognition that properties of the thermal emission may be different for lobe and off-lobe regions. The simulations showed, however, that only the most restrictive model (model iv) allowed an unbiased recovery of low-level simulated power-law emission. In models (i)-(iii), the normalization of the recovered power-law component was always systematically low, presumably because either the abundance or the temperature of the dominant thermal model tended to vary so as to account for some of the simulated power law. Model (iv) is unbiased, even in the presence of quite large scatter in the simulated temperature for the three regions444One can imagine that model (iv) would be biased in a situation in which the thermal component of the lobe spectrum had a temperature, abundance or normalization that was systematically biased with respect to the off-lobe spectra, but it is essentially impossible to deal with this situation with the existing data, so we must simply make the assumption that this is not the case in order to proceed., although of course larger uncertainties on the true temperature in the lobe region result in larger scatter on the inferred power-law normalization. In what follows, therefore, we use model (iv) to estimate the normalization of the power-law component in fits to the real data, and we interpret the results using the confidence limits on power-law normalization derived from simulations.
Finally, we investigated the results of using a steeper photon index for the simulated power laws. As we will discuss below, it is not clear what the appropriate photon index for inverse-Compton models is. We found that steeper photon indices produce systematically higher upper limits on the 1-keV power-law normalization. This is presumably because the difference between thermal and non-thermal models is most obvious at the highest energies: softer non-thermal models are more easily concealed by thermal emission. Although we use the results of the simulations with in what follows, we comment where appropriate on the effects of a steeper photon index.
4 Results
For each of the three sources we extracted spectra and carried out spectral fits for the on- and off-source regions shown in Fig. 1 and described in the following subsections. The results of the fits (for both values of ) are tabulated in Table 3. Errors quoted are 1 statistical errors except where otherwise stated. Constraints on the particle content as a function of assumptions about the electron energy spectrum are summarized in Table 4.
| Source | Region | Off-lobe | Lobe | |||||
|---|---|---|---|---|---|---|---|---|
| used | kT (keV) | Abundance | /dof | 1-keV flux (nJy) | /dof | 1-keV flux limit (nJy) | ||
| Hydra A | Bubble | NRAO | 2282/1944 | 0.6 | 1107/964 | |||
| LAB | 2243/1944 | 0 | 1070/964 | |||||
| Her A | Lobe | NRAO | 528/580 | 0 | 321/327 | |||
| LAB | 535/580 | 0 | 328/327 | |||||
| Cyg A | W lobe | NRAO | 3340/3128 | 82 | 1624/1675 | |||
| LAB | 3892/3128 | 72 | 1758/1675 | |||||
| E lobe | NRAO | 3926/3619 | 185 | 2443/2218 | ||||
| LAB | 4733/3619 | 178 | 3005/2218 | |||||
4.1 Hydra A
For Hydra A we extracted spectra for and around the large-scale bubble seen in low-frequency radio observations (Fig. 1), as this seemed to us to be the region of the source that was most likely to be bright in inverse-Compton emission compared to its surroundings.
The best-fitting temperatures for the off-lobe, cluster regions around 3.6 keV and abundances around 0.30 solar (Table 3) are in reasonably good agreement with the properties of the ICM at this distance from the nucleus obtained by Simionescu et al. (2009) using a more complex thermal model. Fixing the temperature and abundance for the lobe region and allowing the normalization of the power law to vary, we obtain a power-law normalization consistent with zero within the errors derived from the fit for both values of . Using our xspec simulations, we derive a 99 per cent confidence upper limit on the power-law normalization corresponding to 39 nJy at 1 keV for the NRAO values: the values from the alternative value are similar.
We can now ask what this implies for the electron population. Clearly the number density of the population of electrons around cannot be so high as to cause the inverse-Compton emission to exceed the limit we have derived. For a given assumption about the low-energy () electron energy spectrum, which is not constrained by any observation, we can then put an upper limit on the amount of the internal pressure of the lobe provided by electrons. The low-energy electron energy spectrum is parameterized by the electron energy index , such that , and the low-energy Lorentz factor cutoff, , and the ratio of the energy density in non-radiating particles and in electrons is given by the factor conventionally denoted . Making the assumptions that the lobe is a sphere uniformly filled with electrons, non-radiating particles and magnetic field such that (1) the observed synchrotron spectrum is reproduced, (2) the external thermal pressure is equal to the internal pressure due to the particles and field (this is a conservative assumption; the internal pressure cannot be less than the external pressure), and (3) the lobe is not magnetically dominated, we can then ask what values of , and are consistent with the inverse-Compton upper limit. To do this we used the inverse-Compton code of Hardcastle, Birkinshaw & Worrall (1998a), which numerically integrates the results of Rybicki & Lightman (1979) for an arbitrary electron energy spectrum given a spherical source geometry, taking into account scattering of both the microwave background and synchrotron photons. We took the external pressure to be Pa, based on our measured temperature and an external density derived from the deprojection of David et al. (2001) for a radius of 3.5 arcmin.
We initially limited the parameter space to be explored by making the conservative assumption that . Then for (a conventional choice based on the assumption of first-order Fermi particle acceleration) the upper limit on inverse-Compton emission becomes a lower limit on : we find that for these choices. In other words, for these assumptions, the electrons contribute of the energy density in the lobe, with the balance being made up almost entirely of non-radiating particles. (Assumption (3) above means that the magnetic field energy density is always negligible in comparison to the particle energy density, though for very large values of it starts to exceed the electron energy density.) Increasing decreases the total electron energy density further: for the electrons contribute of the energy density in the lobe.
Higher values of rapidly increase the total electron energy density for a given constraint at . So with , we find that the upper limit on the electron energy density is of the total, falling to for . For , the inverse-Compton emission provides no constraint for but restricts the electron energy density contribution to the total for . These limits are in fact less strong than they appear, since a choice of means that the inverse-Compton photon index should be , which, as discussed above, increases the limits on the power-law normalization and so the 1-keV flux, not taken into account in the above calculations. However, the flat spectral index () measured at high frequencies at the base of the lobes in Hydra A (Taylor et al. 1990) is inconsistent with , while it has been argued (Young et al. 2005) that is the correct value to adopt in FRI sources. We consider that the results for are the ones most likely to reflect reality.
4.2 Her A
For Her A we investigated both the E and W lobes. Because of the symmetry of the source we were able to use identical off-lobe regions for both lobes. There is a clear detection of the E jet in this Chandra observation, corresponding to the radio structures denoted E5, E6 and E11 by Gizani & Leahy (2003), which we mask out in our observation of the E lobe.
The best-fitting temperature for the off-lobe regions was keV, with abundance solar, which is consistent with the earlier Chandra measurements of Nulsen et al. (2005), bearing in mind that our regions necessarily span the strong surface brightness drop described in that paper. For both lobes and for both values, a fit with fixed temperature and abundance gave a best-fitting power-law normalization of zero. There is thus no spectroscopic evidence for inverse-Compton emission in this source despite the clear elongation of the X-ray emission in the direction of the lobes. The 99 per cent upper limit on the inverse-Compton flux for both lobes that we derive from our xspec simulations corresponds to a flux density at 1 keV of 38 nJy, independent of the choice of value. This comparatively large value is a result of the large difference (nearly 0.6 keV) between the best-fitting temperatures for the two off-lobe regions when fitted separately.
Using the deprojection of Nulsen et al. (2005) we estimate the pressure at the radius of the lobes, 1 arcmin, to be Pa. (This is the pressure just inside the surface brightness/density jump.) Applying the same method as used for Hydra A, we find that the electrons can contribute at most of the total particle energy density for , , and around for . For with , the inverse-Compton limit imposes no constraint on the fraction of internal energy contributed by the electrons (i.e. they can provide all the required internal pressure without violating the limit). As the flattest-spectrum structure in the jet has (Leahy & Gizani 2003) there is some evidence that is likely to be close to 2.0, assuming that most particle acceleration takes place in the jet and that the injection spectral index is flat. The X-ray detection of the jet supports this model in the sense that it suggests that particle acceleration does take place in the jet, assuming a synchrotron origin for the X-rays.
We note that the strong depolarization asymmetry (Gizani & Leahy 2003) implies that the source is some way from the plane of the sky (Gizani & Leahy 2004 estimate an inclination angle of to the line of sight). Including projection in our analysis would decrease the external pressure but increase the expected inverse-Compton emissivity (since the lobes would be larger) so the limits on the contribution of electrons to the total energy density would remain roughly similar. Detailed modelling of the cluster density profile and the constraints on projection angle imposed by the observed depolarization should be possible with existing data, but is well beyond the scope of the present paper.
4.3 Cygnus A
For Cygnus A we extracted spectra for both radio lobes, masking out the well-known X-ray detected hotspots (e.g. Harris et al. 1994). Overlapping but independent off-lobe regions were used for the two lobes. There is evidence for temperature variation within the lobe and off-lobe regions in discrete features (Wilson, Smith & Young 2006; Belsole & Fabian 2007) but the contribution to the spectrum of these features, given their low surface brightness contrast, is expected to be minimal and we do not attempt to exclude them.
For the W lobe the derived temperatures and abundances for the NRAO are very similar to those expected from the radial profiling of earlier work (e.g. Smith et al. 2002) (our regions extend between about 0.2 and 1 arcmin from the nucleus). The best-fitting temperatures are significantly higher using the lower LAB column density, but the values are also significantly worse, consistent with the fact that Smith et al. fitted a cm-2. Here the addition of a power-law model gives a well-constrained non-zero normalization corresponding to 82 nJy (NRAO) or 72 nJy (LAB), well above the detection threshold from simulations. Deriving 90 per cent confidence error bars from simulation, we can claim a detection with a flux of nJy at 1 keV (here and hereafter we only use the values corresponding to the NRAO value, noting that the results are similar for the LAB , so that we are not dominated by systematic errors).
For the E lobe we again find an apparent detection of power-law emission, this time with a flux density of nJy again with 90 per cent confidence error bars derived from simulation). For this lobe, the power-law component represents a little less than half of the total counts seen in the spectrum. In both cases, of course, we are fitting a power-law model with a fixed photon index of 1.5, and consequently we cannot rule out the possibility that the second spectral component is a hot thermal component (with keV) but we neglect this possibility in what follows since we have an a priori reason to suppose that we might see a hard power-law component in Cyg A. The effect of reducing the assumed is seen (Table 3) to be, as expected, to reduce the inferred flux density in the power law, but in neither case does it render the detection insignificant.
Given the very large error bars (which arise because of the large amount of temperature structure in Cyg A: essentially the simulations are taking into account the fact that we do not know the true temperature associated with the thermal emission from the lobes) the fluxes of the two lobes are consistent with each other. The fact that the E lobe appears brighter may partially be explained by the fact that this lobe contains a relatively bright linear feature which (in spectral fitting with a power-law model using local background subtraction) could account for around 28 nJy of the power-law flux. However, as the flux of this feature is negligible within the uncertainties on our measurement, we do not correct for it in our analysis.
We briefly investigated whether the normalization we had estimated for the power-law component could be affected by the presence of temperature structure in the cluster. We considered the spectrum of the western off-lobe region since the western lobe detection is considerably the weaker of the two. Initially we noted that when we fitted the temperature of these two regions with a free Galactic the value we obtained was cm-2; this is consistent with the results of Smith et al. (2002) and very similar to the NRAO value. This is encouraging since spectra where multi-temperature effects are significant are often best fitted with values significantly below the Galactic value. Fixing to the NRAO value again, we next fitted the spectra of the western off-lobe regions with a model consisting of the sum of two APEC models, with tied but free abundances and completely free temperatures and normalizations. This gave a moderate improvement in the fit to the spectrum ( for 3125 degrees of freedom: compare results for single-temperature fits in Table 3) with keV, keV, abundance solar. However, when we fitted this model, with fixed temperatures and abundances but free normalizations for the two temperatures, together with an additional power-law component, to the spectrum of the W lobe, the fitting statistic was basically identical to that for the single-temperature model ( for 1674 d.o.f.) and the power-law normalization was essentially unchanged (71 nJy at 1 keV). Similar results were found for the E lobe. We conclude that temperature structure of this type has little effect on our results, though of course a strongly spatially varying soft component with low abundance could mimic our power-law detection.
We therefore considered the implications of these apparent detections of inverse-Compton emission for the particle content of the source. We take the external electron densities estimated for the Cygnus A lobes by Dunn & Fabian (2004) which, together with our temperatures, give an external pressure of Pa at the mid-point of the lobes, arcsec from the core [this agrees with earlier estimates, such as those by Hardcastle & Worrall (2000) and Wilson et al. (2006), bearing in mind that there is nearly an order of magnitude variation in external density, and therefore pressure, along the lobes]. This allows us to model the lobes in the same way as for the previous two sources. However, there are two additional complications. One is that the photon energy density in the bright lobes of Cyg A is dominated by synchrotron photons, not CMB photons; therefore the synchrotron self-Compton process is dominant, and the code of Hardcastle et al. (1998a), which assumes spherical symmetry, cannot give exact answers. We have verified using a more sophisticated inverse-Compton code (Hardcastle et al. 2002), which by modelling the source using an arbitrarily fine grid can account for the self-illumination of any source geometry at the cost of greatly increased computing time, that the correction for a uniform ellipsoid is only of the order of 10 per cent, which is negligible given the errors in the measured flux density. Secondly, here we have a detection, rather than an upper limit, to deal with; this means that, assuming pressure balance, we can actually measure one of the free parameters (, , etc) rather than setting limits on it.
Both lobes are brighter than the prediction for IC at equipartition for , and , which is around 20 nJy. Thus here we already know, without considering external pressure constraints, that we expect the electron energy density to dominate over that of the field. However, the external pressure we use here exceeds by almost an order of magnitude the minimum pressure in the lobes, which is of the order of Pa for [similar results have been found by Hardcastle & Worrall (2000) and by Dunn & Fabian (2004)]. If we assume , and then the electron density required if the lobes are to be in pressure balance gives inverse-Compton emission that exceeds the observed value by a factor 5.5 (W lobe) to 2.4 (E lobe), and cannot be consistent even given the large errors; thus we cannot supply the missing pressure with electrons alone for this value. To make the prediction consistent with observation we require (W lobe) or 1 (E lobe), implying that non-radiating particles are either in rough energy equipartition with the electrons or dominant by a small factor. However, only modest increases in are needed to restore pressure balance and match the observed level of inverse-Compton emission ( – ). In these models the electrons still dominate the magnetic field energy density by a large factor but no non-radiating particles are required. For we could accommodate the inverse-Compton observations, obtain pressure balance and have . But unlike the situation in some FRIIs in poorer environments (e.g. Hardcastle et al. 2002, Croston et al. 2004), there does not appear to be a possible sitation in which , and both the inverse-Compton and pressure balance constraints are satisfied with -fields close to the equipartition value if we assume that the sources is close to the plane of the sky. Projection would have some effect, but, as discussed above (and see Hardcastle & Worrall 2000 for more) the effect is not likely to be that large, especially for a source, like Cygnus A, where the angle to the line of sight is likely to be .
Finally, it is worth commenting on the assumption of pressure balance in the case of a powerful FRII like Cygnus A. Our implicit assumption throughout the discussion here and in other papers is that the lobes are characterised by a single pressure, with a high internal sound speed in the lobes acting to smooth out any pressure differences on a timescale that is short compared to the dynamical time of the source. At the same time, FRIIs in general, and Cygnus A in particular, have external pressures that necessarily vary along the length of the lobes; in Cygnus A’s case, as noted above, this variation is an order of magnitude in pressure terms. When discussing pressure balance of the lobes we are in fact talking about pressure balance at (roughly) the mid-point of the lobe; the outer edge of the lobe in this case would have to be expanding and the inner edge contracting or, equivalently, moving outwards under buoyancy [the ‘cocoon crushing’ process discussed by Williams (1991) and Hardcastle & Worrall (2000)] if the midpoint were in pressure balance. In fact, there is some evidence for mildly supersonic expansion even at the midpoint of the lobes of Cygnus A in the shape of the weak shocks argued for by Wilson et al.(2006). If these are shocks, then the pressure in the lobes should be equal to the pressure in the shocked gas, and using the values for the mass density in this region quoted by Wilson et al. in fact gives densities a factor 2 lower than the value from Dunn et al., although clearly any inference of density in these regions is very geometry-dependent. The key point, though, is that uncertainty is introduced into our constraints on particle content by the uncertain dynamical state of the lobes of the source. If we required the lobe to be expanding supersonically in all directions (which is certainly not supported by the observations of Wilson et al. (2006)) then we would need to use external pressures corresponding to the central regions of the cluster, which are a factor of a few higher, in our calculations above, leading to correspondingly more extreme constraints on and on the fraction of the lobe energy density contributed by the electron population.
| Source | Constraints on electron energy content | |||
|---|---|---|---|---|
| Hydra A | 1 | – | ||
| 10 | ||||
| Her A | 1 | – | – | |
| 10 | – | |||
| Cyg A | 1 | – | 1 | – |
5 Discussion and conclusions
The results of the previous section may be summarized as follows:
-
•
Constraints on the inverse-Compton emission from the lobes, on the assumption that the lobes are in pressure balance with the external medium, that they are uniformly filled with particles and field, and that they are not magnetically dominated, set limits on the fraction of the lobe energy density provided by electrons.
-
•
Because the lobe internal pressure is determined by the integrated electron energy spectrum, and not its normalization at , the results depend on the slope of the (assumed power-law) low-energy electron spectrum, , and its low-energy cutoff, . Increasing reduces the lobe internal pressure for a given IC emissivity, while increasing increases it. Our fiducial assumptions are , (though the latter neglects the possibility of Coulomb losses against any thermal particles present in the lobes, a process thought to operate effectively in supernova remnants; see, e.g., Vink 2008).
-
•
For a given choice of and , and a value of , the ratio between the energy densities of radiating and non-radiating particles, there are only two possible solutions for the magnetic field strength, , that allow us to achieve pressure balance given the observed synchrotron emissivity in the radio (which sets the electron energy spectrum normalization). If we assume that particles are dominant, so that the lower value of should always be the one chosen, we can then constrain by comparing the predicted and actual inverse-Compton emissivity. Increasing decreases the inverse-Compton flux, so an upper limit on inverse-Compton flux corresponds to a lower limit on .
-
•
As shown in Table 4, for , we find for the large-scale lobes of Hydra A, for the lobes of Her A, and – for Cygnus A (where a statistically significant detection of excess hard emission from the lobes allows a measurement rather than a limit to be derived, although the errors are large). All these values of decrease if the assumed is increased, but within the limits set on by radio observations is not possible for either Hydra A or Her A. In other words, the electrons must contribute a small fraction of the total internal energy density in the FRI Hydra A and the intermediate source Her A, with the bulk of it, assuming particle dominance, being provided by a non-radiating particle population. For the FRII Cygnus A, the electron content of the lobes is close to the value required to provide pressure balance with the external medium at the mid-point of the lobes without a dominant contribution from non-radiating particles, but is insufficient to drive a strongly supersonic lobe expansion.
It has of course been known for a long time that solutions with and do not appear to be viable in the jets, lobes and plumes of FRI radio galaxies (e.g. Hardcastle et al. 2007 and references therein). In some cases the lack of detected inverse-Compton emission has been used to rule out a model in which the lobes are electron-dominated (Hardcastle et al. 1998b, Croston et al. 2003) while the use of the external pressure and the radio fluxes to estimate a quantity equivalent to is widespread (e.g. Dunn & Fabian 2004). All previous attempts to estimate in FRIs, though, rely on some assumption about the magnetic field strength, normally one equivalent to equipartition between the field and the particle population. The novelty of our work is that it demonstrates that inverse-Compton constraints can be used to remove the necessity for this assumption; our values of are not just a quantity that depends on the ratio of minimum internal to external pressures, but real measurements that incorporate all the available information. For models corresponding to the lower limits on , we have for Hydra A and Her A, though we emphasise that we have ruled out a priori magnetically dominated models, and the non-detections in inverse-Compton provide no additional evidence for that assumption.
An interesting feature of the existing constraints on pressure balance in lobes has been the apparent difference between FRI and FRII sources found in earlier work. As discussed in Section 1, when the magnetic field strengths are constrained using inverse-Compton detections in FRIIs, the internal pressures are typically comparable to the external pressures with no additional non-radiating particles and only modest departures from equipartition (that is, solutions with , () are implied, although typically a contribution from non-radiating particles of order () cannot be ruled out). In typical FRIs, by contrast, it seems that solutions with () are required by the data. Our result for Cyg A confuses this simple picture. Although we appear to detect inverse-Compton emission, as in other FRIIs, and the implied electron energy densities are quite close to what would be required to provide pressure balance, unlike the case for the FRIs, the data do require some non-radiating particles and/or a departure from our fiducial electron energy spectrum in order to allow pressure balance with the external environment. We emphasise that in general, and also in the specific case of Cyg A, there are large uncertainties on inferences of electron energy densities from inverse-Compton observations, so that the differences between Cygnus A and other FRIIs may not be as significant as they appear here. However, an intriguing possibility is that the apparent difference could be related to the very much richer environment of Cyg A when compared to other FRIIs that have been studied with inverse-Compton observations. In FRIs, there is some evidence that the required non-radiating particle population may be related to entrainment (and subsequent efficient heating) of external material, since jetted sources like Hydra A tend to have larger pressure deficits than lobed ones like Her A (Croston et al. 2008). Conceivably the entrainment rates of the jets close to the centre of the rich cluster environment of Cygnus A are high enough that the process operating in FRIs is also relevant there, so that there is an environmental dependence for lobe particle content both in FRIs and in FRIIs. The entrainment model for FRIs will be discussed in detail in a forthcoming paper (Croston & Hardcastle, in prep.). For FRIIs, detailed testing of this idea must await observations capable of detecting inverse-Compton emission in other sources in rich environments.
This work has demonstrated both the potential and the severe difficulties of inverse-Compton studies of lobe particle content in the presence of a hot thermal environment. The very large uncertainties on the inferred parameters even for such a bright inverse-Compton source as Cygnus A, with such good X-ray data, make it clear that our technique is not likely to be applicable to less sensitive studies of more distant luminous FRIIs in clusters. The best results were obtained for Hydra A, where the bubbles are large and the surface brightness of thermal bremsstrahlung reasonably low; there are almost certainly other well-studied large radio sources for which inverse-Compton constraints would yield useful information. However, our work clearly highlights the current problems in making a spectral separation between inverse-Compton and thermal emission. To pin down the electron content in lobes in general, we need the ability to image in somewhat harder X-rays, above the cutoff in thermal bremsstrahlung, with good sensitivity and moderate angular resolution. Hard X-ray imaging instruments such as the Nuclear Spectroscopic Telescope Array (NuSTAR), or, failing that, the International X-ray Observatory (IXO) will eventually make this possible.
Acknowledgements
MJH thanks the Royal Society for a research fellowship. We thank Wendy Lane and Paddy Leahy for providing us with published radio maps of Hydra A and Her A respectively. We also thank an anonymous referee for comments which allowed us to make significant improvements to the paper. This research has made use of the NASA/IPAC Extragalactic Database (NED) which is operated by the Jet Propulsion Laboratory, California Institute of Technology, under contract with the National Aeronautics and Space Administration. This work is partly based on observations obtained with XMM-Newton, an ESA science mission with instruments and contributions directly funded by ESA Member States and the USA (NASA). The National Radio Astronomy Observatory is a facility of the National Science Foundation operated under cooperative agreement by Associated Universities, Inc.
References
- [] Baars, J.W.M., Genzel, R., Pauliny-Toth, I.I.K., Witzel, A., 1977, A&A, 61, 99
- [] Belsole, E., Fabian, A.C., 2007, in Böhringer H., Pratt G.W., Finoguenov A. & Schuecker P., eds, Heating vs. cooling in galaxies and clusters of galaxies, Springer-Verlag, Heidelberg, p.101
- [] Carilli, C.L., Perley, R.A., Dreher, J.W., Leahy, J.P., 1991, ApJ, 383, 554
- [] Croston, J.H., Hardcastle, M.J., Birkinshaw, M., Worrall, D.M., 2003, MNRAS, 346, 1041
- [] Croston, J.H., Birkinshaw, M., Hardcastle, M.J., Worrall, D.M., 2004, MNRAS, 353, 879
- [] Croston, J.H., Hardcastle, M.J., Harris, D.E., Belsole, E., Birkinshaw, M., Worrall, D.M., 2005, ApJ, 626, 733
- [] Croston, J.H., Hardcastle, M.J., Birkinshaw, M., Worrall, D.M., Laing, R.A., 2008, MNRAS, 386, 1709
- [] David, L.P., Nulsen, P.E.J., McNamara, B.R., Forman, W., Jones, C., Ponman, T., Robertson, B., Wise, M., 2001, ApJ, 557, 546
- [] Dickey, J.M., Lockman, F.J., 1990, ARA&A, 28, 215
- [] Dunn, R.J.H., Fabian, A.C., 2004, MNRAS, 355, 862
- [] Fanaroff, B.L., Riley, J.M., 1974, MNRAS, 167, 31P
- [] Gizani, N.A.B., Leahy, J.P., 2003, MNRAS, 342, 399
- [] Gizani, N.A.B., Leahy, J.P., 2004, MNRAS, 350, 865
- [] Goodger, J.L., Hardcastle, M.J., Croston, J.H., Kassim, N., Perley, R.A., 2008, MNRAS, 386, 337
- [] Hardcastle, M.J., Croston, J.H., 2005, MNRAS, 363, 649
- [] Hardcastle, M.J., Worrall, D.M., 2000, MNRAS, 319, 562
- [] Hardcastle, M.J., Birkinshaw, M., Worrall, D.M., 1998a, MNRAS, 294, 615
- [] Hardcastle, M.J., Worrall, D.M., Birkinshaw, M., 1998b, MNRAS, 296, 1098
- [] Hardcastle, M.J., Birkinshaw, M., Worrall, D.M., 2001, MNRAS, 323, L17
- [] Hardcastle, M.J., Birkinshaw, M., Cameron, R., Harris, D.E., Looney, L.W., Worrall, D.M., 2002, ApJ, 581, 948
- [] Hardcastle, M.J., Kraft, R.P., Worrall, D.M., Croston, J.H., Evans, D.A., Birkinshaw, M., Murray, S.S., 2007, ApJ, 662, 166
- [] Hardcastle, M.J., Cheung, C.C., Feain, I.J., Stawarz, Ł., 2009, MNRAS, 393, 1041
- [] Harris, D.E., Carilli, C.L., Perley, R.A., 1994, Nat, 367, 713
- [] Harris, D.E., Nulsen, P.E.J., Ponman, T.P., Bautz, M., Cameron, R.A., Donnelly, R.H., Forman, W.R., Grego, L., Hardcastle, M.J., Henry, J.P., Jones, C., Leahy, J.P., Markevitch, M., Martel, A.R., McNamara, B.R., Mazzotta, P., Tucker, W., Virani, S.N., Vrtilek, J., 2000, ApJ, 530, L81
- [] Isobe, N., Tashiro, M., Makishima, K., Iyomoto, N., Suzuki, M., Murakami, M.M., Mori, M., Abe, K., 2002, ApJ, 580, L111
- [] Isobe, N., Makishima, K., Tashiro, M., Hong, S., 2005, ApJ, 632, 781
- [] Isobe, N., Tashiro, M.S., Gandhi, P., Hayato, A., Nagai, H., Hada, K., Seta, H., Matsuta,, K., 2009, ApJ, 706, 454
- [] Jetha, N.N., Hardcastle, M.J., Babul, A., O’Sullivan, E., Ponman, T.J., Raychaudhury, S., Vrtilek, J., 2008, MNRAS, 384, 1344
- [] Kalberla, P.M.W., Burton, W.B., Hartmann, D., Arnal, E.M., Bajaja, E., Morras, R., Pöppel, W.G.L., 2005, A&A, 440, 775
- [] Kataoka, J., Stawarz, Ł., 2005, ApJ, 622, 797
- [] Konar, C., Hardcastle, M.J., Croston, J.H., Saikia, D.J., 2009, MNRAS, 400, 480
- [] Kühr, H., Witzel, A., Pauliny-Toth, I.I.K., Nauber, U., 1981, A&A, 45, 367
- [] Lane, W.M., Clarke, T.E., Taylor, G.B., Perley, R.A., Kassim, N.E., 2004, AJ, 127, 48
- [] Leahy, J.P., 1993, in Röser H.-J., Meisenheimer K., eds, Jets in Extragalactic Radio Sources, Springer-Verlag, Heidelberg, p. 1
- [] Nulsen, P.E.J., Hambrick, D.C., McNamara, B.R., Rafferty, D., Bîrzan, L., Wise, M.W., David, L.P., 2005, ApJ, 625, L9
- [] Rybicki, G.B., Lightman, A.P., 1979, Radiative Processes in Astrophysics, Wiley, New York
- [] Simionescu, A., Böhringer, H., Brüggen, M., Finoguenov, A., 2007, A&A, 465, 749
- [] Simionescu, A., Roediger, E., Nulsen, P.E.J., Brüggen, M., Forman, W.R., Böhringer, H., Werner, N., Finoguenov, A., 2009, A&A, 495, 721
- [] Smith, D.A., Wilson, A.D., Arnaud, K.A., Terashima, Y., Young, A.J., 2002, ApJ, 565, 195
- [] Spinrad, H., Djorgovski, S., Marr, J., Aguilar, L., 1985, PASP, 97, 932
- [] Taylor, G.B., Perley, R.A., Inoue, M., Kato, T., Tabara, H., Aizu, K., 1990, ApJ, 360, 41
- [] Vink, J., 2008, A&A, 486, 837
- [] Williams, A.G., 1991, in Hughes P.A., ed., Beams and Jets in Astrophysics, Cambridge University Press, Cambridge, p. 342
- [] Wilson, A.S., Smith, D.A., Young, A.J., 2006, ApJ, 644, L9
- [] Wilson, A.S., Young, A.J., Shopbell, P.L., 2000, ApJ, 544, L27
- [] Wise, M.W., McNamara, B.R., Nulsen, P.E.J., Houck, J.C., David, L.P., 2007, ApJ, 659, 1153
- [] Worrall, D.M., Birkinshaw, M., Hardcastle, M.J., Lawrence, C.R., 2001, MNRAS, 326, 1127
- [] Young, A., Rudnick, L., Katz, D., DeLaney, T., Kassim, N.E., Makishima, K., 2005, ApJ, 626, 748