Inconsistency between WMAP Data and Released Map
Abstract
A remarkable inconsistency between the calibrated differential time-ordered data (TOD) of the Wilkinson Microwave Anisotropy Probe (WMAP) mission, which is the input for map-making, and the cosmic microwave background (CMB) temperature maps published by the WMAP team is revealed, indicating that there must exist a serious problem in the map making routine of the WMAP team. This inconsistency is easy to be confirmed without the use of WMAP map-making software. In view of the importance of this issue for cosmology study, the authors invite readers to check it by themselves.
1 INTRODUCTION
The CMB data from the WMAP mission are the most important bases of cosmology study, and the accuracy of the CMB map recovered from the WMAP data is essential for precision cosmology. Recently, we have found there notably exist observational effects on released WMAP maps. The WMAP mission measures temperature differences between sky points using differential radiometers consisting of plus-horn and minus-horn[1]. When an antenna horn points to a sky pixel, the other one will scan a ring in the sky with an angular radius of to the centre pixel. These measured TOD are transformed into the full-sky temperature anisotropy map by a map-making process[2]. In released five-year WMAP (WMAP5) CMB maps we find significant distortion from hot Galactic sources: the pixels in the scan ring of a hot pixel are systematically cooled, and the strongest anti-correlations between temperatures of a hot pixel and its scan-ring appear at a separation angle [3]. The above results are confirmed by Aurich, Lustig and Steiner[4]. Furthermore, we also detect the no-negligible effect of imbalance observations in published WMAP5 maps: systematic dependence of temperature vs. observation number difference between the two horns of a radiometer produced by the input transmission imbalance, and significant correlation between pixel temperature and observation number in WMAP data[5]. These recent findings of systematic error in published WMAP temperature maps push us forward to further check the WMAP map-making processing.
In this work, we find a remarkable inconsistency between the WMAP TOD and published temperature map. The revealed inconsistency demonstrates that there certainly exists a serious problem in WMAP map-making process, and it is worth checking the reliability of released WMAP results by reproducing CMB temperature maps from the original raw data independently from the WMAP team. We built a self-consistent software package of map-making from TOD. Our software successfully passes a variety of tests. With our software, new CMB maps from WMAP TOD are produced, which, in contrary to those published by the WMAP team, are well consistent with the input calibrated TOD.
2 METHOD
We use a simple method, the residual TOD test, to check the consistency of WMAP map-making. Let denotes the temperature anisotropy at a sky pixel . In a certain band, the observed difference of the th observation , where and are the sky pixels pointed by the plus-horn and minus-horn during the observation respectively. From total observations, the differential TOD
| (1) |
with being the scan matrix. Most of elements except for and . The WMAP team produces the released temperature map from the calibrated TOD by using their map-making software[2,6].
For testing the consistency between the WMAP TOD and the released map reconstructed from by map-making, we calculate for each observation the residual between the measured calibrated difference and the calibrated difference predicted by the reconstructed map, , to get the residual TOD
| (2) |
If the temperature map is properly reconstructed, only the instrument noise should be left in . To check it, we produce the correlation map of the residual TOD
| (3) |
where is diagonally dominant[2]
| (4) |
with being the total number of observations for pixel . Combining eq. (3) and eq. (4), we can compute the temperature of the correlation map of the residual TOD for each sky pixel simply by
| (5) |
If the temperature map published by the WMAP team is reconstructed correctly, the correlation map should remain only the map-making error with low amplitude and no significant structured signal on it. Because eq. (3) is linear, we have For a correctly reconstructed map , both and will be equal to , and then will be exactly zero, despite the inevitable numerical computation error, or the map making error.
3 RESULT
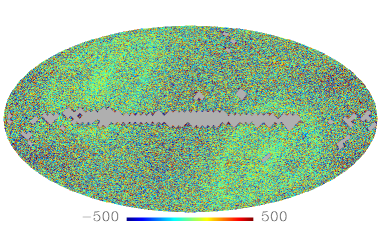
Now we check the consistency of released temperature map with the used WMAP TOD. We download the calibrated TOD from the WMAP team’s website (fttp://lambda.gsfc.nasa.gov/). In map-making, not all the measured TOD are used by the WMAP team. During the preprocess of map-making, bit-coded quality flags are set[7]. A non-zero flag indicates that either the observation is problematic in a specific respect, or the beam boresight is away from one of the out planets no more than , which is the antennae main beam radius limit[8]. In both cases, the corresponding data are at least less optimal, and some of these data are not used by the WMAP team in the map-making. We follow the WMAP team’s flagging convention111(1) GENERAL FLAG – Test on bits 0, 1, 3, 4, 5. This discards data when the observatory is not in observing mode, the Sun is visible over the shield, but includes data when either the Earth or Moon is visible over the shield (but still in the far sidelobes of the radiometer beams). (2) DA-SPECIFIC FLAGS – Test on bit 0, re-test on bits 1–10. Bit 0 allows exclusion of data with known thermal disturbances or radiometer upsets. Bits 1–10 show that a planet is close to a radiometer beam. If bit 1–10 is set, compute the distance between the indicated planet and the radiometer beam centre based on the instantaneous pointings for all points within the frame, and discard only those points for which the planet lies within of the beam. to get the used WMAP5 year-1 TOD. Figure 1 shows the map obtained by eq. (5) from the used WMAP5 year-1 TOD and the released WMAP5 year-1 temperatures of Q1-band, where visible structures along the ecliptic plane and around the ecliptic poles left and the rms amplitude K, which is much higher than the expected rms error of K estimated by the WMAP team with flight-like simulations for their map-making algorithm[2], demonstrating that there certainly exists a remarkable problem in the WMAP map-making process.
We then write out our map-making programs to reconstruct new temperature map from the used WMAP5 year-1 TOD. According to the WMAP document[2], only three extra corrections are needed: the noise removal, the sidelobe correction, and the transmission imbalance correction. The sidelobe correction is applied only to the K-band, and other two corrections are applied to all bands. We perform various tests, i.e. the residual dipole component test, the map-making convergence test, and the end-to-end test etc, to make it sure that our data pipeline is in a self-consistent manner.
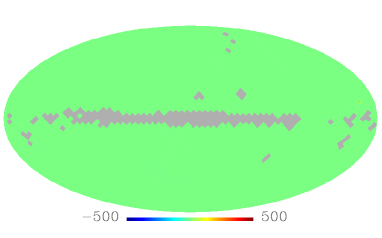
With our map-making program and the used WMAP5 year-1 Q1-band TOD, we produce new temperature map, and with the new map and eq. (5) we calculate the residual TOD. The correlation map of the residual TOD is calculated and shown in Figure 2, where no significant structures can be seen and the rms amplitudes is less than K, almost 2000 times lower than what from the WMAP team’s map-making products and close to the rms error of K for our map-making, demonstrating that the inconsistent problem presented in §2 can be prevented by improving map-making algorithm.
4 DISCUSSION
The remarkable structured noise left in the residual TOD of the WMAP official map shown in Figure 1 indicates that there must exist a serious problem in the map-making routine of the WMAP team, and that many previous cosmology studies based on the released WMAP temperature maps should be seriously affected. It will be very helpful if the WMAP team can thoroughly recheck their map-making process to find out where and how the error occurs. But until now they have insisted that their result has no problem, and prevented to discuss it with us. In view of the importance of this issue for cosmology study, we invite readers to explore it by themselves. In testing the consistency between the released map and WMAP TOD, the calculations for the residual TOD in eq. (2) and its correlation map in eq. (5) are considerably easy without the use of the WMAP map-making software. The WMAP calibrated TOD and official maps can be found at the website fttp://lambda.gsfc.nasa.gov/. Readers can produce the used TOD from the calibrated TOD by using the WMAP team’s flagging convention, or download the WMAP5 year-1 TOD used in this work from the website of Tsinghua Center for Astrophysics at http://dpc.aire.org.cn/data/wmap/09072731/release_v1/tod_for_test/.
REFERENCES
1. Bennett, C.L. et al., 2003, ApJ, 583, 1
2. Hinshaw, G. et al., 2003, ApJS, 148, 63
3. Liu, H. & Li, T.P., 2009, Sci China G-Phy Mech Astron, 52, 804; arXiv:0809.4160v2
4. Aurich, R., Lustig, S. & Steiner, F., 2009, arXiv:0903.3133
5. Li, T.P., Liu H., Song L.M., Xiong S.L. & Nie J.Y., 2009, MNRAS, 398, 47
6. Jarosik, N. et al., 2007, ApJS, 170, 263
7. Limon, M. et al., 2008, Wilkinson Microwave Anisotropy Probe (WMAP) : The Five-Year Explanatory Supplement, Greenbelt, MD: NASA/GSFC; Available in electronic form at http://lambda.gsfc.nasa.gov
8. Hill, R. S., et al. 2009, ApJS, 180, 246