Production of and 3 mesons in the He reaction at 1360 and 1450 MeV
Abstract
The cross sections of the He, He and He reactions have been measured at the beam kinetic energies = 1360 MeV and = 1450 MeV using the CELSIUS/WASA detector setup. At both energies, the differential cross section of the meson in the He reaction shows a strong forward-backward asymmetry in the CMS. The ratio between the He and He cross sections has been analysed in terms of isospin amplitudes. The reconstructed invariant mass distributions of the , 3He and 3He systems provide hints on the role of nucleon resonances in the production process.
pacs:
13.75-nHadron-induced low- and intermediate energy reactions and scattering and 14.40-BeLight mesons and 25.40 VeNuclear reactions above meson production threshold1 Introduction
The reaction has long been used to study the production of charged and neutral mesons and mesonic systems. Studying reactions with 3He in the final state gives insight in the reaction dynamics involving three nucleons and in meson-nucleon final state interactions.
The reaction has been of
particular interest. Several studies near the kinematic threshold
berger ; mayer ; mersmann ; smyrski ; adam , where mostly -waves are
involved in the production process, show a threshold enhancement. This
enhancement has been interpreted as an indication of a quasi-bound
3He nuclear state wilkin1 . Measurements of the
angular distribution at slightly higher energies from PROMICE/WASA
bilger and ANKE rausmann indicate the presence of
-waves at an excess energy of 20 MeV, while at
40 MeV even higher partial waves are required in order to describe the
data. The angular distributions from Refs. bilger ; rausmann have
a strong forward-backward asymmetry with a backward suppression, a
maximum at 0.5 and a forward plateau
or dip. At slightly overlapping excess energies, there are data from
GEM betigeri and Saturne banaigs which disagree with
the
PROMICE/WASA and ANKE results. At high energies ( 120
MeV), the data bank is scarce. Backward production of mesons in
was studied at 17 different beam
energies at the SPES IV spectrometer Berthet . Parts of the
angular distribution at = 1450 MeV was measured by SPES
III Kirchner . The CELSIUS/WASA collaboration has recently
studied the reaction at two beam
energies, i.e. =1450 MeV and =1360 MeV, which
correspond to excess energies of 252 MeV and 299 MeV, respectively.
The differential cross section was measured in the backward hemisphere
and at forward angles. At =1450 MeV, the backward points overlap
with those from Ref. Kirchner . The angular distribution at
=1360 MeV obtained with CELSIUS/WASA is the first measured at
this energy.
The direct production of three pions, i.e. pions which do not originate from e.g. or decay, has so far received little theoretical and experimental attention. In the isobar model discussed in Ref. 3pi1 , three-pion production should proceed via an excitation of one or two baryon resonances, like or the Roper , followed by their subsequent decays. Three-pion production in proton-proton collisions was studied at high energies alexander ; colleraine ; almeida and at lower energies by CELSIUS/WASA pauly . In the latter work, the ratio between and was measured and discussed in terms of isospin amplitudes. The ratio was measured to be which suggests that the being the leading part of the reaction mechanism, in line with the isobar model presented in Ref. 3pi1 .
In the He case, it is straightforward to show that the total cross sections expressed in isospin amplitudes are
| (1) |
| (2) |
where denotes the isospin of the three pions. In the simple statistical approach as outlined by Fermi fermi , all amplitudes in eq. 1 and eq. 2 are put equal and the cross terms are neglected. Though not justified, this simplification enables a rough comparison between two channels for which no other, more realistic, model exists. The cross section ratio then becomes
| (3) |
If is put to 0, the ratio becomes 4. In this work, the ratio has been estimated experimentally at 1360 MeV, which corresponds to an excess energy of = 395 MeV for and = 386 MeV for , and at 1450 MeV, which corresponds to = 441 MeV for and = 432 MeV for .
Multipion production is also interesting since it constitutes the most
important background to other meson production reactions like He, He, He and
He.
This paper is organised as follows: in the next section, the reader is
introduced to the CELSIUS/WASA experiment. In section 3,
the measurement of the He reaction is
presented and in section 4, the He and
He
reactions are studied and compared. Finally the results are summarised
and discussed in section 5.
2 The CELSIUS/WASA experiment
The measurements were carried out at the The Svedberg Laboratory in Uppsala, Sweden. The WASA detector Zabierowski was, until June 2005, an integrated part of the CELSIUS storage ring. In the measurements presented here, a target of deuterium pellets Ekstrom ; Nordhage was used, designed for a 4 detector geometry and high luminosity.
The 3He ions were detected in the Forward Detector (FD) calen , covering polar angles from 3o to 18o. The FD consists of the Window Counter (FWC) for triggering, the Proportional Chamber for precise angular information (FPC), the Trigger Hodoscope (FTH) for triggering and offline particle identification and the Range Hodoscope (FRH) for energy measurements, particle identification and triggering. Mesons and their decay products are mainly detected in the central detector (CD), which consists of the Plastic Scintillating Barrel (PSB), the Mini Drift Chamber (MDC) and the Scintillating Electromagnetic Calorimeter (SEC). Charged particles, mainly pions, are discriminated from neutral ones by their signals in the PSB, that also provides azimuthal angular information and covers a polar angular range from to . The momenta of charged particles are extracted by tracking in a magnetic field in the MDC. The SEC measures angles and energies of photons from meson decays and covers polar angles from to .
A special trigger was developed to select events with 3He in the final state, based on the condition that 3He events give high energy deposit in the FWC and that hits detected by the FWC and the consecutive detectors FTH and FRH should match in the azimuthal angle. It was carefully checked in the offline analysis that the energy deposit thresholds were set sufficiently low to accept 3He ions in the full energy range, i.e. giving an unbiased 3He sample.
In the offline analysis, the 3He ions are identified in the FD by first obtaining a preliminary particle identity (PID) using the --method. In short, we compare the light output in the detector layer where the particle stops to the light output in the preceding layer. The of the PID hypothesis was then calculated by comparing the measured energy deposits in all detector layers traversed by the particle to the calculated energy deposits. Particle hypotheses giving a larger than a certain maximum value were rejected. For details, see Ref. karinthesis ; karin3 .
3 The He reaction
The WASA data collected at MeV and MeV correspond to excess energies = 252 MeV and = 299 MeV and to CM momenta of = 516 MeV/c and = 568 MeV/c. Here and in the following, the star indicates that a kinematic variable is in the CM system.
The WASA Forward Detector does not cover the entire 3He phase space in the He reaction at these energies. The maximum emission angle of the 3He in the laboratory system is 18.5o at =1360 MeV and 19.6o at =1450 MeV and the FD only covers angles up to 18.0o.
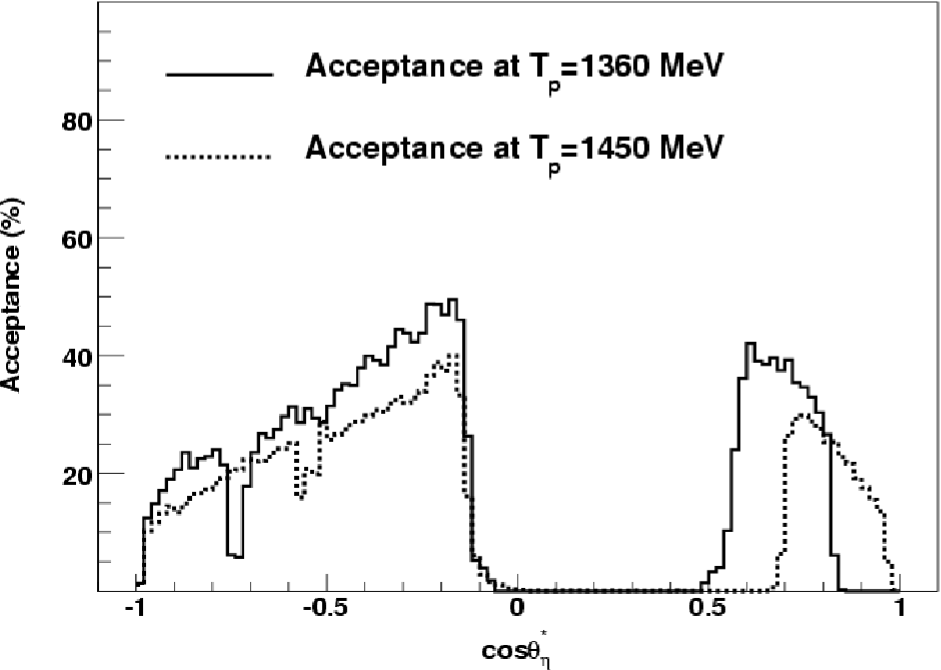
In figure 1, the acceptances at both energies are shown as a function of , when constraints optimised for selection (see section 3.1.1) are applied. The acceptance drops at high and low angles due to 3He ions emitted at small laboratory angles, 3o. The middle hole in the acceptance is caused by 3He ions emitted at large angles 18o. The acceptance drops at (1360 MeV) and (1450 MeV) are caused by 3He ions stopping between two layers of the FRH.
3.1 Event selection
The three main decay channels of the , i.e. (BR=39.3), (BR=32.6) and (BR=22.7) have all been separated and studied with the WASA setup. In this work, we focus on since it provides a clean sample with good statistics. The simultaneous study of and allow valuable cross checks of the results.
3.1.1
In this case all final state particles – one 3He and two photons – can be measured with good acceptance. We thus have an over-constrained measurement and thereby, we can check if an event is consistent with the expected kinematics. This reduces the background significantly and gives a clean sample.
The criteria for selection are given in table 1. Assuming phase space production, they give an acceptance of 20% at 1360 MeV and 14% at 1450 MeV.
| 3He giving signal in the FPC and stopping in the FRH |
| 2 photons in the SEC with 20 MeV |
| one -combination fulfilling |
| He 10000 |
| no overlapping hits in the PSB and the SEC |
| 160He |
Figure 1 shows how the acceptance varies as a function of . The acceptance is limited by the geometrical coverage of the FD, by photons missing the CsI modules in the calorimeter and by the efficiency reduction due to 3He ions undergoing nuclear interaction before depositing all their energy.
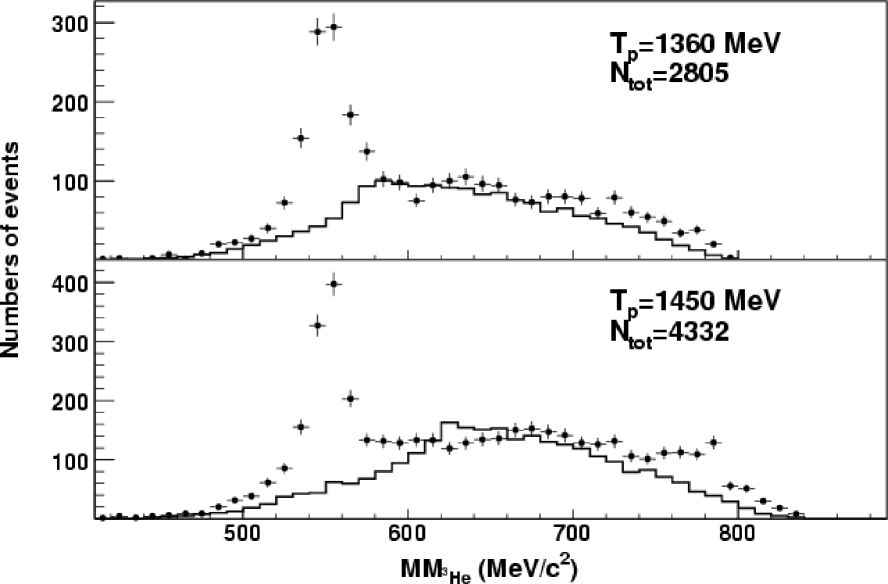
The upper panel of figure 2 shows the 3He missing
mass for all events fulfilling the constraints optimised for selection at =1360 MeV. The bottom
panel shows the =1450 MeV case. Phase space Monte Carlo
simulations of the main background channel, , are also shown, normalised to fit the
data. They reproduce the background in the experimental data fairly
well, except for an enhancement at high 3He missing mass at
=1450 MeV which is caused by
events
that accidentally satisfy the criteria. Assuming phase space
production give an acceptance of 3.6 at =1360 MeV and 4.0
at =1450 MeV. Other reactions, e.g. , were found to give a
negligible contribution to the
background.
3.1.2
In this case we need six photons from the three decays in order to indentify the events. The Scintillator Electromagnetic Calorimeter (SEC) has a small “hole” in the backward part and one large in the forward part, where the photons escape undetected. Therefore, in most events at least one, but often several, photons escape detection. The acceptance is therefore significantly reduced compared to the case.
The constraints optimised for selection are given in table 2.
| 3He giving signal in the FPC and stopping in the FRH |
| 6 photons in the SEC with 20 MeV |
| one -combination fulfilling |
| two other -combinations fulfilling |
| He 20000 |
| no overlapping hits in the PSB and the SEC |
Assuming phase space production, this gives a total
acceptance of 5.7 at =1360 MeV and 3.6 =1450
MeV. The main background channel is direct He production. At high missing masses, there
is also a contribution from
He production, which will be discussed
in section 4.1. The acceptance for direct 3
production at =1360 MeV is 11.7 and 10.3 at =1450
MeV, if phase space production is assumed.
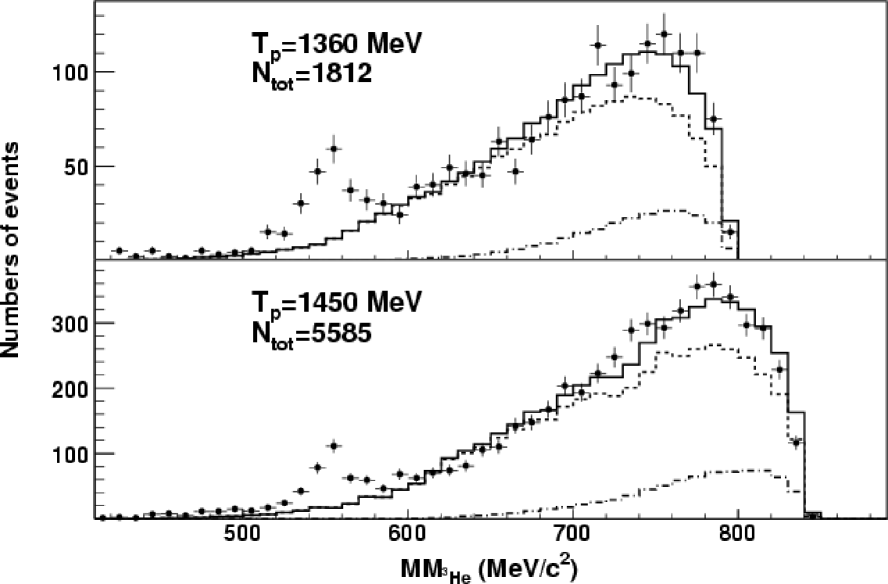
The upper panel of figure 3 shows the 3He missing mass for all events fulfilling the constraints optimised for at =1360 MeV and the bottom panel shows the same but for =1450 MeV.
3.1.3
The criteria optimised for are given in table 3. The last one, requiring the total energy deposit in the SEC to be smaller than 900 MeV, rejects time-overlapping events, i.e. chance coincidences. The selection criteria give altogether an acceptance of 18 at MeV and 12 at MeV.
| 3He giving signal in the FPC and stopping in the FRH |
| 2 photons in the SEC with 20 MeV |
| one -combination fulfilling |
| He 250 |
| 2 hits in the PSB |
| 900 MeV |
The main background comes from nonresonant production. The acceptance for the reaction when the given constraints are applied and phase space production is assumed, is 35 at MeV and 31 at MeV.
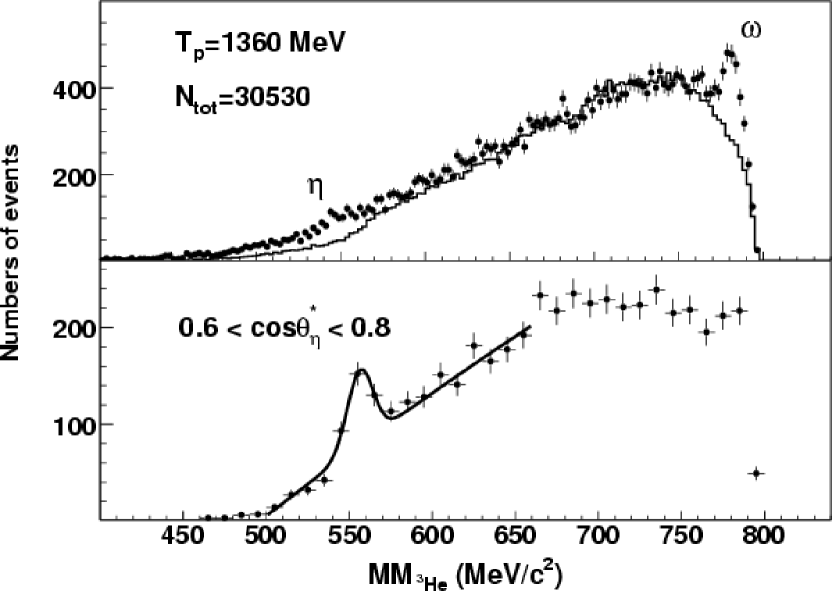
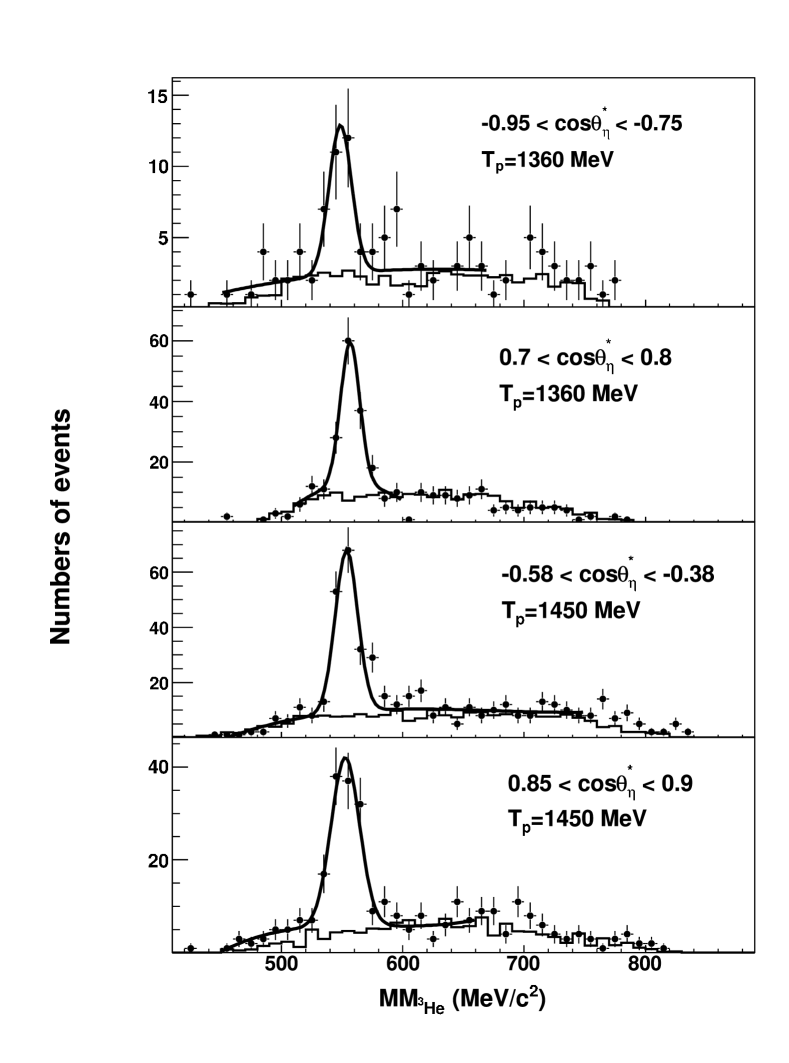
The upper panel of figure 4 shows all data at =1360 MeV that fulfill the cuts optimised for selection. It is difficult to separate the events from the background, partly due to the small signal-to-background ratio and partly due to the broad peak. However, in individual regions in , the events appear in a peak and can be separated from the background with reasonable accuracy. An example is shown in the lower panel of figure 4. The peak for the full range, shown in the upper panel of figure 4, is broader than the peak in an individual interval, shown in the lower panel of figure 4. The broadness of the peak in the full range is due to a small dependence of the peak position on . This in turn is an effect of the calibration constants, which are slightly dependent on energy. This was also observed in Ref. bilger , but there the effect was much stronger. Here it is negligible for small lab angles where the variation in is small. For large , it gives a contribution to the systematic uncertainty of 3 %.
3.2 The angular distribution
The angular distributions were obtained by dividing the data sample into intervals of where the acceptance is smooth and non-zero. The mesons are identified by the missing mass method in individual bins of . The mesons are easier to identify in the intervals than in the cumulative spectrum (compare the upper and the lower panel of figure 4). The number of candidates is extracted by fitting Gaussian peak on top of a polynomial background (it has been checked that in individual region the background has no discontinuities). This number was then corrected for acceptance. The systematic uncertainty was estimated by fitting simulated Monte Carlo data of the main background channel (in this case He) and compare the number of events obtained in this way to the number of s obtained from fitting the background to a polynomial. The same procedure was repeated for the channels. It turns out that the agreement in individual regions is good between the and the channels. This gives confidence that the cut efficiencies are well understood and that our systematic uncertainties are under control.
The normalisation was achieved by comparing data on backward going mesons from He from SPES IV Berthet and SPES III Kirchner with the corresponding data from this work using the method described in Refs. karinthesis and karin2 . The normalisation uncertainty of the measured cross sections and is 29% at 1360 MeV and 12% at 1450 MeV.
The resulting angular distributions are shown in figure 6 and figure 7. The systematic uncertainties are shown as a shaded histogram in each figure. They mainly arise from the ambiguity in the background subtraction, but there is also a small contribution from the energy dependence of the calibration constants (see section 3.1.3). The distributions at both energies are highly anisotropic with a sharp forward-backward asymmetry. This is in line with earlier experiments, e.g. Refs. bilger ; rausmann ; betigeri ; banaigs ; Kirchner , where evidence were found for several higher partial waves away from the threshold region. From comparing SPES III data with data from this work at =1450 MeV, which is done in figure 7, the conclusion is that either the two data sets are inconsistent, or there is a forward dip that is much stronger than the dip observed in Refs. bilger ; rausmann .
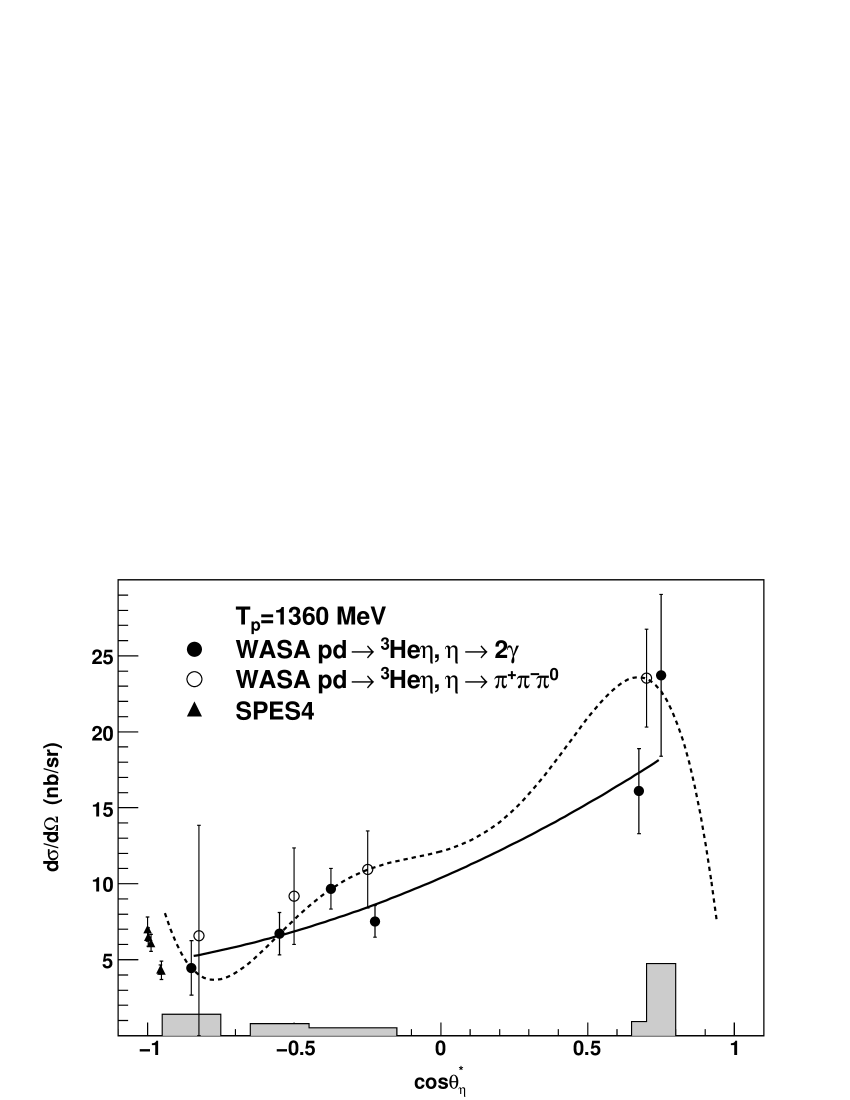
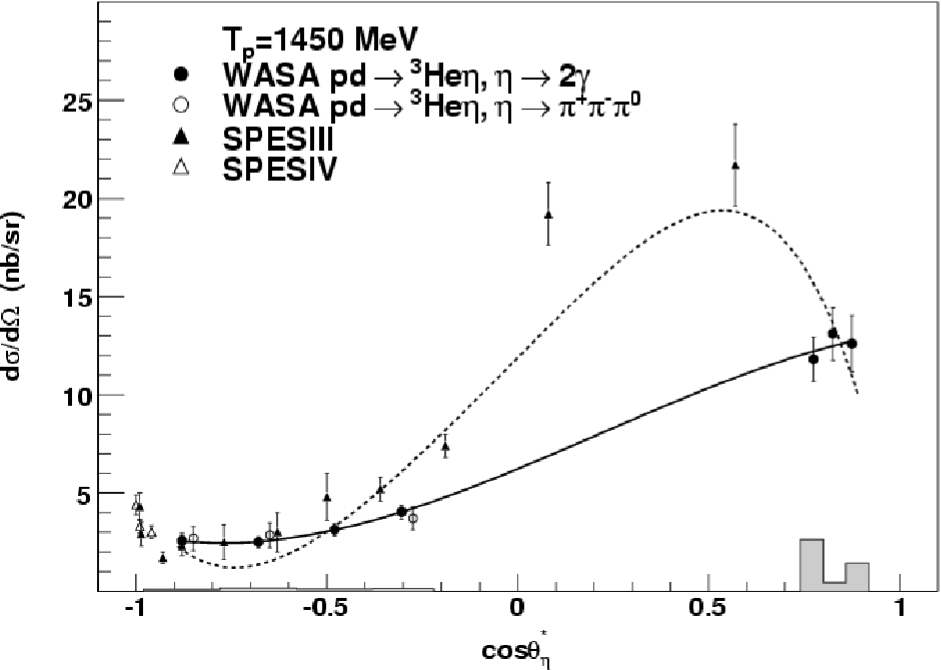
The angular distributions were fitted by a series of Legendre polynomials
| (4) |
to the data points from WASA. The
zeroth coefficient of the Legendre polynomial gives, when multiplied
with 4, the total cross section. At 1360 MeV one obtains
= nb. In addition,
there is an uncertainty from the normalisation of 29. At 1450 MeV
the total cross section is estimated to be =
nb. The normalisation uncertainty is 12%
at 1450 MeV.
4 Multipion production
In this section, we first study the He reaction, then the He reaction and finally, the two three-pion reactions are compared.
4.1 The reaction
The same selection criteria are used as for the He case, given in table
2 of section 3.1.2. For the
He reaction, they give acceptances
of 11.7 at 1360 MeV and 10.3 at 1450 MeV. There may be a large
uncertainty in the acceptance of a reaction where six photons are
measured. To estimate this uncertainty, we assume that the difference
in the extracted number of mesons from and is entirely
caused by the ambiguities in the acceptance and that the uncertainty
is the same at both energies. The uncertainty in the acceptance is
then estimated to a maximum value of 20%.
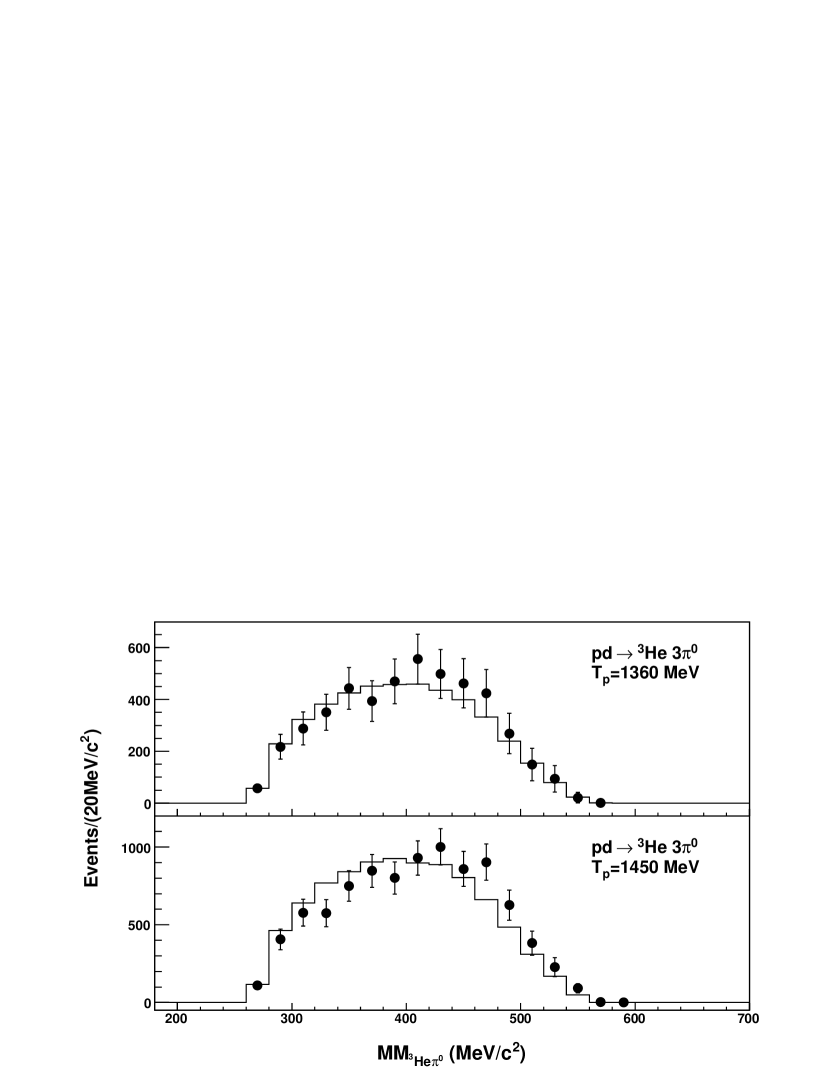
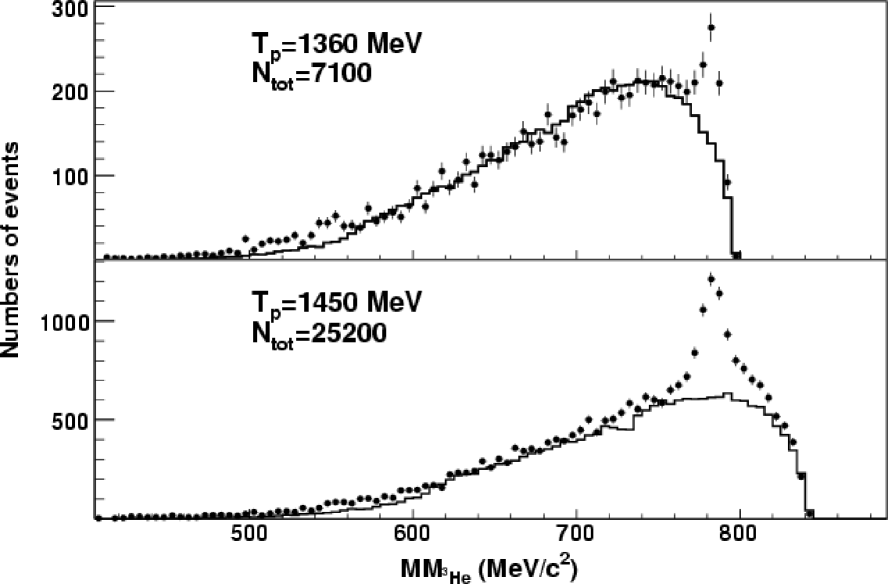
The 3He missing mass distributions at both energies for all events fulfilling the constraints are shown in figure 3 in section 3.1.2. The dotted line shows simulated data assuming phase space production. Simulated 3 data match the experimental data for low and medium missing masses (except at the peak, which is expected), but at high MM(3He), the matching between data and phase space Monte Carlo is poor.
It is reasonable to assume a contribution from
, either from direct
production or from production via in . In both reactions, eight photons are produced
and the acceptance for the selection criteria in table
2 is 28% at 1360 MeV and 24% at 1450 MeV. At the
highest energy, the maximum 3He emission angle in the lab system is
15o in the case and 18o in the
case, which means that in both cases, the WASA Forward
Detector covers almost the full 3He phase space. The acceptance is
then nearly independent of the production mechanism.
The distributions obtained from Monte Carlo simulations are shown in the dashed-dotted line histograms in the upper and lower panel of figure 3. Adding the contributions from 3 and 4 together gives the solid line histograms in figure 3. We obtain = 250 at = 1360 MeV and = 800 at = 1450 MeV.
The cross section of the reaction at = 1450 MeV has been measured to nb by studying the decay karinetapi .
From the known cross section of reaction at = 1450 MeV (see Ref. karinetapi ) and from the acceptance and the branching ratio of , the expected number of events is calculated to 700 80. This explains almost fully the = 800 and it is clear that the cross section of direct 4 production must be very small at 1450 MeV.
Subtracting the fitted and distributions from the experimental data gives = 1400 and = 4500 at = 1360 MeV and = 1450 MeV, respectively. This corresponds to cross sections of 180 nb and 115 nb. The statistical uncertainty of is given by the square root of the total number of events before the subtraction and is equal to 3% (2%) at =1360 MeV (=1450 MeV).
It is also possible that part of the deviation from the 3 phase space curve in figure 3 is due to a production mechanism that differs from phase space production. This will be discussed later in this paper. However, at least at =1450 MeV, the expected contribution from explain the data well and the remaining excess of events at high 3He missing masses gives a small contribution to the systematic uncertainty.
At =1360 MeV, it is difficult to say with certainty that the excess of events at high in the upper panel of figure 3 are not directly produced events. The cross section of the reaction is not known, and it is therefore unclear whether a significant contribution from this reaction is to be expected. However, the mixture of and events reproduces the experimental distributions also at = 1360 MeV very well and it is therefore reasonable to assume a contribution from production, either from direct production or from the subsequent decay in production. We therefore take the 3 cross section of 180 nb, calculated when assuming that the deviation from the 3 curve at large He in figure 3 come from 4 production, as the most reliable one. The excess of events is treated as a systematic uncertainty. By assuming that all events in the upper panel of figure 3 that do not come from He are directly produced 3 events, becomes 1650 which corresponds to a cross section of 212 nb. The systematic uncertainty is then taken as the difference between the cross sections calculated in two different ways, i.e. 32 nb. We assume that the uncertainty is symmetric. This is a conservative method of estimating the systemtaic uncertainty and other systematic contributions, e.g variation in the acceptance due to reaction mechanism, should be well within the error bars estimated in this way.
We can also give a rough upper limit of the He at 1360 MeV, which will be useful in the next section. Assuming that all the = 250 events come from production, the He would be 42 nb.
The total cross section of production then becomes nb at = 1360 MeV and nb at = 1450 MeV. The first error is statistical, the second is systematical and includes uncertainties from background and acceptance. The last uncertainty comes from the normalisation.
Background from quasi-free reactions with a proton misidentified as a is expected to be negligible. The probability that an event from a reaction with or in the final state instead of would survive the constraints, is smaller than 0.001%.
Invariant mass distributions of the final state particles in the He reaction give important
information about the production mechanism. Deviation from phase space
can give hints about e.g. intermediate resonances. In this
work we have studied the -system, the 3He-system and
the 3He-
system. When studying the invariant mass of two
pions it is more convenient to instead reconstruct the missing mass of
the 3He and the third pion, here denoted He. This is
because the 3He is measured in the FD with higher resolution than
the pions, which are measured in the CD.
In order to avoid an event sample with a lot of background from the He and He, events which fulfill the condition MeVHe MeV are selected. He is then reconstructed for these events. In this event sample, there will be a small contribution (a few percent) from the He reaction and the data will therefore be subtracted by the expected amount of events, obtained from simulations. The data are then corrected for acceptance. The results are shown in the upper and lower panel of figure 8. The points represent the background subtracted and acceptance corrected data and the solid histogram phase space simulated data. The experimental data follow phase space well.
The invariant mass of the 3He-system, He, has also been reconstructed. The small background from was subtracted in the same way as in the He case and the data was then corrected for acceptance. The result is shown in figure 9. Here the data disagree with phase space. There is an enhancement with respect to phase space centered around MeV, which roughly equals the sum . This may indicate a single excitation in the production process.
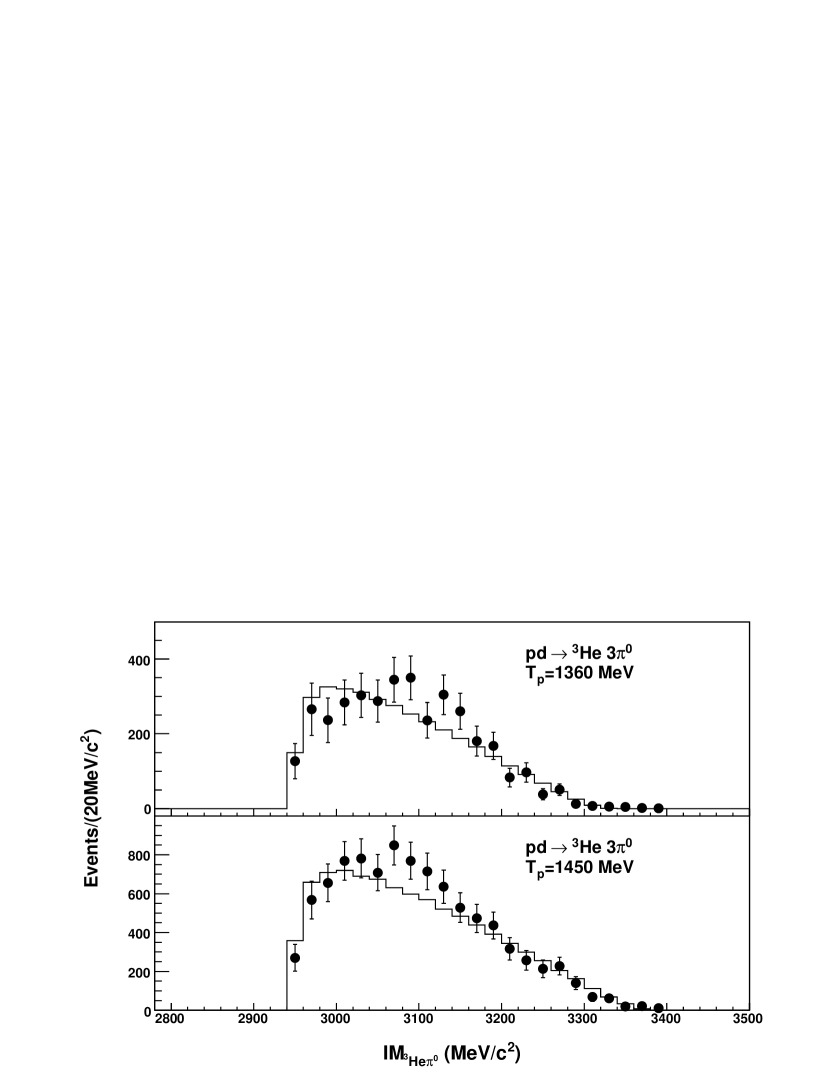
Finally, the invariant mass of the 3He-system is studied. This is done by reconstructing the missing mass of one of the mesons. In this way, the resolution is improved. The experimental data were background subtracted, using simulated He data, and acceptance corrected. The result is shown in figure 10, together with the phase space Monte Carlo simulations of He. There is a small enhancement at high around the sum, which may indicate the involvement of a Roper excitation in the production mechanism.

4.2
All selection criteria optimised for selection, given in table 3 in
section 3.1.3, are applied. In addition, we require
that both charged pions are emitted in directions covered by the CD,
i.e. that no other charged tracks than the 3He are found
in the FD. Finally, two charged tracks in the MDC are required, with
overlapping hits in the PSB. The total acceptance, calculated partly
using Monte Carlo simulations (all constraints not involving the MDC,
see section 3.1.3) and partly analysing data (all constraints involving the MDC,
see
Ref.karinthesis ) is 7.2% at 1360 MeV and 6.7% at 1450
MeV.
| 3He giving signal in the FPC and stopping in the FRH |
|---|
| 2 photons in the SEC |
| one -combination fulfilling |
| He 250 |
| 2 hits in the PSB |
| 900 MeV |
| no in FD |
| 2 MDC tracks with matching hits in the PSB |
In figure 11, the missing mass of the 3He is shown for all events satisfying the criteria given in table 4. There is a small enhancement around the mass and a clear peak at the mass, but except from that, the experimental data seem to follow the phase space distribution well. There is no sign of any He events in this sample. The acceptance for this reaction when applying the cuts in table 4 is 9% at 1360 MeV and 12% at 1450 MeV. At the higher energy, where the cross section is known (see karinetapi ), the expected number of He events is 250, which constitute only 1% of the continuum data in the lower panel of figure 11. In the previous section we found that the direct cross section at 1450 MeV must be very small, and even if the cross section of direct is likely higher than the direct cross section due to more possible isospin amplitudes, it is reasonable to assume that direct production will give a negligible contribution to our data sample. This assumption is also very well in line with the good agreement between data and simulations in figure 11. The number of events at 1360 MeV, = 6700, corresponds to a total cross section of 1400 nb. This is obtained using an acceptance which is calculated assuming phase space production, but since the WASA detector covers the major part of the 3He phase space for this reaction, the model dependence of the acceptance is small.
The largest contribution to the systematic uncertainty comes from the efficiency of the MDC. A robust method of estimating this uncertainty is to calculate the cross section with and without using the information from the MDC, treat the difference as a systematical uncertainty and assume that it is symmetric.
At 1360 MeV, the number of events obtained using selection criteria without involving the MDC is = 33000 and the acceptance is 28%. This corresponds to a cross section of 1770 nb which gives a systematical uncertainty of 370 nb.
There may be a systematical uncertainty arising from falsely identified He. According to the rough upper limit of the cross section at 1360 MeV that was given in the previous section, the maximum number of events in this sample is 56. This gives a systematic uncertainty of 12 nb and is thus very small compared to the uncertainty from the MDC efficiency.
The statistical uncertainty is obtained by the square root of the total number of events and is determined to 17 nb. Finally we get nb at = 1360 MeV.
Following the same reasoning at 1450 MeV, except that the cross section is known with good precision, the cross section becomes nb .
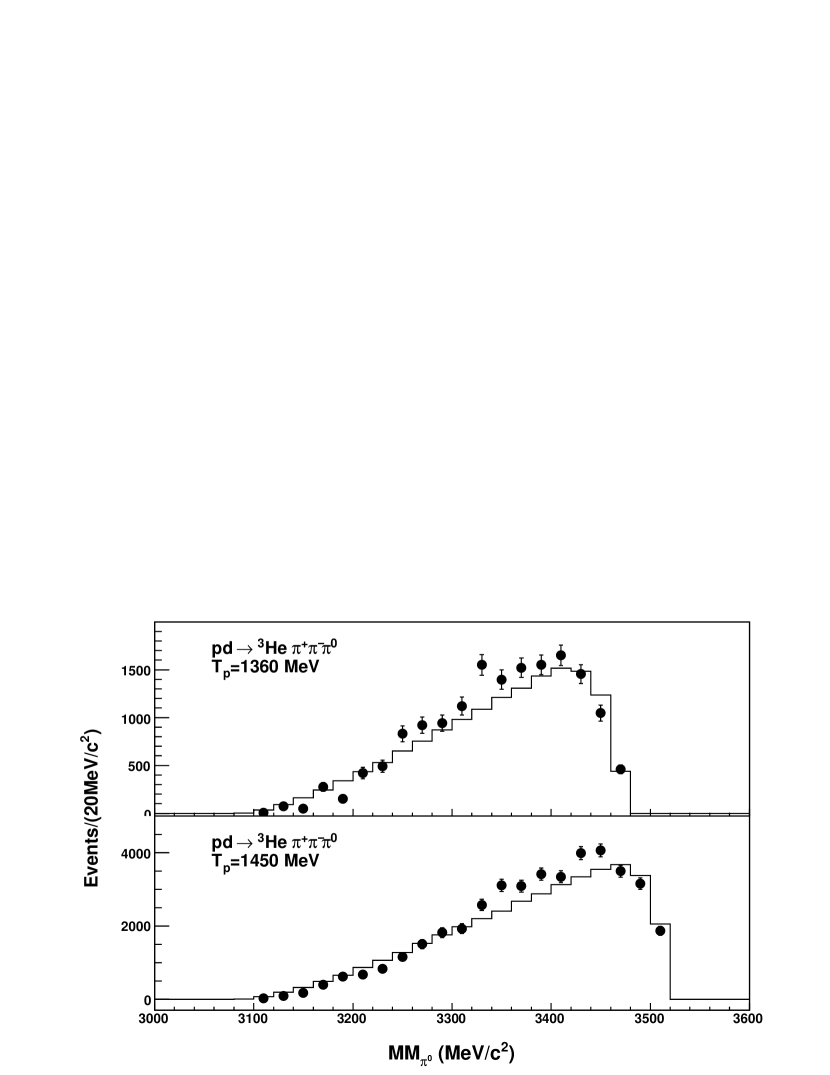
As in the case, the distributions of the final state particles have been studied. Since the is the only pion that is fully reconstructed, the invariant mass of the -system is studied by reconstructing the missing mass of the 3He-system. To have a sample as similar to the case as possible, events which satisfy MeVHe MeV are selected. The He is reconstructed and the data are corrected for acceptance. Note that no background subtraction had to be made in this case, since the contribution from He is proven to be small at both energies. The results at both energies are shown in figure 12. There is good agreement between experiment and simulated data and there is no sign of any intermediate meson, which would push the He towards higher masses. This is not surprising since despite the large width of the meson ( 150 MeV), we are far below the nominal He threshold at both beam energies considered in this work.

The invariant mass of the 3He is reconstructed in the same way as in the case, except that no background subtraction was necessary. The results are shown in figure 13. Also in the case, there is a small enhancement around the sum.

The invariant mass of the 3He system is studied by reconstructing the missing mass of the . The acceptance corrected data are shown in figure 14. Like in the He case, there is a small enhancement with respect to phase space near the sum, suggesting that the Roper resonance may be involved in the production process.
4.3 Comparison between the and the reactions
In the introduction, the ratio between the cross sections of the and the reactions,
i.e.
, was calculated to 9, using a
statistical model where all isospin amplitudes are put
equal and all cross terms are set to zero. If instead = 0, the
ratio becomes 4. In this work, the ratio has been measured
experimentally at both energies. By using the cross sections
determined in section 4.1 and 4.2, one then
obtains 7.8 at 1360 MeV and 7.9 at 1450 MeV for this ratio. However,
to give a comparison at the same excess energy , the results have
to be corrected for the difference between the masses of the
and . The lower mass of the makes the phase
space volume of the He reaction
larger than that of the at the same beam energy. After
correcting for the difference in phase space volume, the ratio becomes
at 1360 MeV and at 1450
MeV, where the first uncertainty is statistic and the second
systematic. Note that the uncertainty in the normalisation cancels in
the ratio. The values obtained are consistent with the value of 9
predicted using the statistical approach. The interpretation of this
result is then that should be of similar size as .
5 Summary and Conclusions
The production of light mesons, i.e. and , have been studied at = 1360 MeV and = 1450 MeV. The He reaction was studied by using data from the three most common decay channels; , and . The result from the different channels gave consistent results. At both energies, the angular distributions of the meson were reconstructed and they show a pronounced forward-backward asymmetry. The WASA detector does not cover the full angular range at these high energies and one could therefore not say whether the forward plateau or dip observed in bilger ; rausmann persists at high energies. The data from this work in combination with data taken at the same energy with the SPES III spectrometer Kirchner do, however, suggest that the forward dip persists at this high energy and is stronger compared to the lower energy case. If not, the 1450 MeV data from this work disagree with the SPES III data in the forward hemisphere.
The total cross sections of three pion production in
He and He
were measured at both energies. The ratio between the
and cross sections was calculated at both
energies and the results are consistent with the statistical model,
where and all cross terms are neglected. The invariant
mass distributions of the two-pion system and the 3He system
were reconstructed. The invariant mass distributions of the two-pion
system follow phase space but the corresponding distribution of the
3He system, show a small enhancement around the mass. This enhancement was observed in and
production at both energies and may indicate a
single excitation in the production mechanism.
The invariant mass distributions of the 3He system, for both and production at both eneregies, show an enhancement near the mass, suggesting that the Roper resonance may be involved in the production mechanism.
The cross sections measured in this work are summarised in table 5.
| Reaction | (MeV) | stat. | syst. | |
|---|---|---|---|---|
| () | () | () | ||
| He | 1360 | 151.6 | 9.3 | 35.2 |
| He | 1360 | 180 | 6 | |
| He | 1360 | 1400 | 17 | |
| He | 1450 | 80.8 | 3.6 | 43.1 |
| He | 1450 | 115 | 3 | |
| He | 1450 | 910 | 7 |
6 Acknowledgements
We are grateful to the personnel at the The Svedberg Laboratory for their support during the course of the experiment. This work was supported by the European Community under the “Structuring the European Research Area” Specific Programme research Infrastructures Action (Hadron Physics, contract number RII3-cT-204-506078) and by the Swedish Research Council.
References
- (1) J. Berger et al., Phys. Rev. Lett. 61, (1988) 919.
- (2) B. Mayer et al., Phys. Rev. C 53, (1996) 2068.
- (3) T. Mersmann et al., Phys. Rev. Lett. 98, (2007) 242301.
- (4) J. Smyrski et al., Phys. Lett. B 649, (2007) 258.
- (5) H.-H Adam et al., Phys. Rev. C 75, (2007) 014004.
- (6) C. Wilkin, Phys. Rev. C 47, (1993) R938.
- (7) R. Bilger et al., Phys. Rev. C 65, (2002) 044608.
- (8) T. Rausmann et al., Phys. Rev. C 80, (2009) 017001.
- (9) M. Betigeri et al., Phys. Lett. B 472, (2000) 267.
- (10) J. Banaigs et al., Phys. Lett. B 45, (1973) 394.
- (11) P. Berthet et al., Nucl. Phys. A 443, (1985) 589.
- (12) T. Kirchner, Ph. D. thesis, IPN Orsay, France, (1993).
- (13) R. M. Sternheimer and S. J. Lindenbaum, Phys. Rev. 123 (1961) 333.
- (14) G. Alexander et al., Phys. Rev. 154 (1967) 1284.
- (15) A. P. Colleraine and U. Nauenberg, Phys. Rev. 161 (1967) 1387.
- (16) S. P. Almeida et al., Phys. Rev. 174 (1968) 1638.
- (17) C. Pauly et al., Phys. Lett. B 649 (2007) 122.
- (18) E. Fermi, Prog. Theor. Phys. 5 (1950) 570.
- (19) Chr. Bargholtz et al., Nucl. Instr. Meth. A 594, (2008) 339.
- (20) C. Ekström et al., Physica Scripta T 99, (2002) 169.
- (21) Ö. Nordhage, Ph. D. thesis, Uppsala University, Sweden, (2006).
- (22) H. Calén et al., Nucl. Instr. Meth. A 379, (1996) 57.
- (23) K. Schönning, Ph.D. thesis, Uppsala University, Sweden, (2009).
- (24) K. Schönning et al., Acta Physica Slovaca 56-3, (2006) 299.
- (25) K. Schönning et al., Phys. Rev. C 79 (2009) 044002.
- (26) R. Wurzinger et al., Phys. Rev. C 51, (1995) R443.
- (27) K. Schönning et al., Phys. Lett. B 685 (2010) 33.