No indication of in phase shift analyses
Abstract
The scalar meson - indicated in particular in the low energy 3 body reactions - is a crucial element in certain schemes of the scalar meson spectroscopy including glueballs. The most definitive results can be obtained from elastic and inelastic phase shift analyses using the constraints from unitarity where the discrete ambiguities can be identified and resolved. We reconsider the phase shift analyses for . While a clear resonance signal for in the resp. Argand diagrams is seen in all channels above a large “background” from there is no clear signal of a second resonance “” in this mass range in any reaction, at the level of 10% branching ratio into .
Keywords:
pion pion scattering, scalar mesons, glueball:
11.80.Et,12.38.Gc,13.25.Jx,13.75.Lb,14.40.Be1 ROLE OF IN SCALAR MESON SPECTROSCOPY
There is a particular interest in scalar meson spectroscopy since the lightest gluonic meson is expected within QCD with these quantum numbers. The QCD predictions for the glueball mass and a possible mixing with states is still controversial but the mass falls into a range of 1000 - 1700 MeV. Therefore it is important to identify the low mass states with their spin parity, say below 2 GeV, and to classify them into flavour multiplets and glueballs according to their production and decay properties. Different scenarios have been proposed in the past for these lowest multiplets.
According to a popular scheme the states are grouped into the lightest nonet either built from or . The next higher multiplet of type would include and . For completion of the nonet two isoscalar states are needed but three are found in this mass range according to the Particle Data Group (PDG) pdg : and . This offers the possibility to introduce the scalar glueball which together with the two isoscalar states would mix into the observed three scalar s. There are various realisations of such a mixing scheme first considered in ac .
A critical input in this scheme is the very existence of the three isoscalars, so that there is one supernumerous state for a usual nonet. However, the state cannot be considered as firmly established. This state appears with different parameters in the fits and the PDG quotes mass and width in the ranges MeV and MeV. There are various modes quoted as “seen” in the listing, but not a single number is considered to be established among the Branching Ratios or ratios thereof despite many analyses over the years. Quoted results from different experiments are often in conflict. Moreover, we do not see a convincing direct signal, neither a peak above a low background nor a clear resonance effect in an energy independent (point by point) phase shift analysis. The experimental status of is very different from the one of the nearby where the analyses have converged and now there are well defined mass and width parameters with errors ¡10 MeV and five well established branching ratios. Also there are clear direct signals from resonance bands in the Dalitz plots of 3 body decays and also from phase shift analyses – what is lacking for .
There may be another problem with the above classification scheme in that the mass of the glueball of a full QCD calculation is lower than the often quoted mass around 1600 MeV which refers to QCD lattice calculations in quenched approximation. A recent full (unquenched) calculation in fact suggests a lower number, around 1000 MeV unquenched , which is below the above 3 mass states, but more work is needed for definitive conclusions. Likewise, in the QCD sum rule approach the lightest scalar glueball is found around a mass of 1000 MeV sumrules .
In view of the problems with a classification scheme without this state has been proposed some time ago mo . It has been argued that the activity in this mass region be related to the high mass part of the broad state called now . Then, the states are considered to form the lightest nonet while the broad low mass state is considered to be of a gluonic nature. The “Breit Wigner mass” of the broad state where the phase shift passes through 90∘ is found around 1000 MeV, to remember we also write ; the width is of size similar to the mass.
The existence of therefore plays a crucial role for the interpretation of the low mass scalar spectrum with or without glueball. We look for an answer from a detailed phase shift analysis of elastic and inelastic scattering.
2 PHASE SHIFT ANALYSIS OF SCATTERING
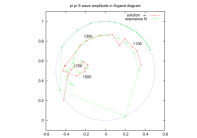
A resonance in a scattering process corresponds to a pole of the scattering amplitude as function of the complex energy or . Such a pole can be visualized as a closed circle in the complex amplitude plane for physical real ; in case of a moving background a circular structure remains although with some distortion. Examples for the movement of the isoscalar elastic scattering amplitude in the complex plane (“Argand diagram”) obtained from global fits to various data with circles from the various resonances including can be seen, for example, in Refs. bugg .
In the presence of sizable background the existence of a resonance can be demonstrated if the complex partial wave amplitude is reconstructed from data in a sequence of mass bins and gives evidence for a resonance circle. With sufficient statistics this procedure can establish a resonance even without explicitly fitting parametric amplitudes.
2.1 Data on scattering
Such data have been obtained from the analysis of reactions like by isolating the one-pion-exchange contribution. The measurement of the angular distributions and their moments allows for a decomposition of the amplitude into partial waves up to some descrete ambiguities classified by the “Barrelet-zeros”. The unknown overall phase can be fixed by assuming a Breit-Wigner form of the leading resonances and . Phase shift analyses for became available from the CERN Munich experiment grayer through different analyses: 1. CERN Munich-I cm with a global K matrix fit and subsequent bin-by-bin analysis with one favoured solution; 2. CERN Munich-II cm2 with a fully energy independent analysis resulting in 4 different solutions, two found acceptable. This analysis included all correlations between the angular moments and is carried out in larger mass bins resulting in smaller errors for the phase shifts in comparison to CM-I; 3. Similar results with 4 solutions in an analysis of CM-I data have been obtained by Estabrooks and Martin em . The two acceptable solutions by CM-II are shown in the “Argand-diagrams” of Fig. 1. Also shown is the component used in the present analysis which becomes inelastic and moves inside the circle above 1300 MeV (see also Ref. ochsmont ).
An extended experiment with polarised target by the CERN-Krakow-Munich experiment ckm has allowed decisive tests of the underlying exchange models. A phase shift analysis has found a unique solution for mass MeV but with large errors for the parameter for MeV. Remarkably, the results for the phases from all the above analyses agree for MeV. For our present study we take the phase shift results from CM-II which have the smallest errors.
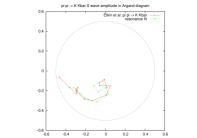
There are also results on the reaction obtained from the corresponding reaction gams ; bnl . The GAMS data gams have sufficiently small errors above 1400 MeV to be compared with data. The reconstructed amplitude as well as the component are shown in the rightmost panel of Fig. 1 where the amplitude is found largely inside the unitarity circle as it should be ochsmont .


|
The results on the amplitude obtained from charged and neutral pion reactions should agree. One can see that this is true indeed for the solution () (leftmost in Fig. 1) at least at the qualitative level: both solutions describe a circular motion of the amplitude with peak near 1300 MeV and with an additional small circle evolving towards the center near 1500 MeV. The two amplitudes are not exactly in agreement but slightly displaced which we relate to systematic uncertainties coming from the amplitude badly known in the inelastic region and from the precise form of the line shape of the leading resonances used to determine the unknown overall phase.
The second, small circle is not seen in Sol. (). It represents the state with a diameter of about 0.3 which corresponds to the elastic width and is in good agreement with the PDG result %. This agreement is remarkable as our number comes from the imaginary part of the elastic amplitude whereas the PDG value is derived from the measurement of all channel cross sections.
On the other hand, there is no sign of any additional resonance circle in the 1300 MeV range neither in the CERN Munich nor in GAMS data which would reflect the existence of in the way suggested from the global fits in bugg . Assuming we should have seen a circle of size 1/3 of the one from we can give an upper limit .
2.2 Data on scattering
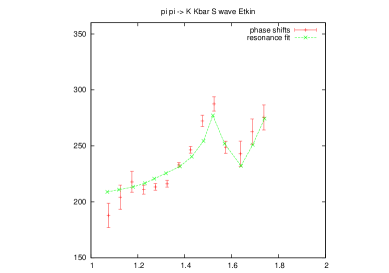
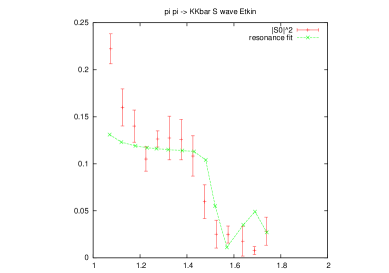
Again such inelastic processes can be obtained from the corresponding reactions. The experiments with highest statistics are: 1. Argonne experiment on argonne ; with primary energy of 6 GeV and mass range GeV. Besides the amplitudes with exchanges contributing to production there are now also exchanges and the wave can be produced with . Then the complete analysis yields 8 different phase shift solutions; they are all eliminated but one. 2. Brookhaven experiment on bnlkk ; this experiment with 3-4 times the statistics of other experiments and with a 23 GeV pion beam has the extended mass range GeV. There are even partial waves only and the analysis yields just two solutions below 1.7 GeV related by a sign ambiguity. For these reasons we compare here with the results from this experiment. Both experiments argonne ; bnlkk agree roughly on the wave magnitude but indicate a difference in phase at low mass GeV.
3 -matrix fit to isoscalar -wave
Next we fit the discussed data from CM-II and BNL with a parametrisation of the coupled channel matrix in the range GeV together with data from CM-I from the range GeV including the resonances
| (1) |
where we also take into account the tail of with parameters from PDG but free coupling strength.
A popular ansatz is based on the addition of several matrix poles, but the relation to the matrix poles is not obvious and one cannot easily switch on or off a particular resonance. Also it is not obvious why K matrix poles should be added, in the elastic case . We prefer using a model where the phases are added in the elastic region which is obtained if for two resonances the corresponding matrices are multiplied which may be generalised to one inelastic and one elastic resonance (or background) according to michael . This leads for the combined matrix to the well known expression . We generalise this to an Ansatz for inelastic resonances: the broad “background” from interfering with narrow resonances and MeV
| (2) |
We assume here simple Breit-Wigner forms for the resonances coupling to channels
| (3) |
We perform a common fit of this parametrization to the experimental data in and channels for the parameters inelasticity and phase for the amplitude of by and to and for by . We include in the fit the 3 (+1) resonances in (1) each one with parameters , and decay fractions where appropriate line shapes for the channels and are included. The channel is kept to satisfy unitarity but without experimental input.
 |
 |
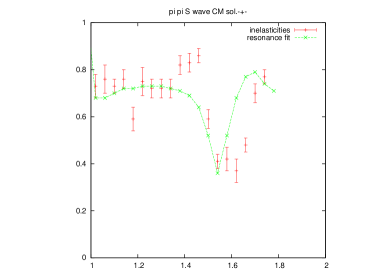 |
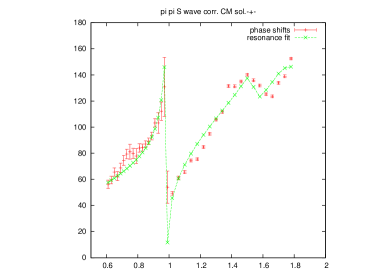
The results for elastic scattering are presented in Fig. 2. It can be observed that the main features of the data are reproduced: the slowly moving background whith phase shifts passing 90∘ near 1000 MeV, interrupted by the strong variation from and a second rapid variation near 1500 MeV. One can see from the Argand diagram that the fitted circle near 1500 MeV is a bit rotated away from the circle in the data which leads to a shift of the dip in away from the experimental value. We assume that this is a shortcoming of our rather simple parametrisation with minimal resonances and no further “background”. However, it does not appear justified to us to include an additional resonance to describe the effect which would generate an additional circle. The amplitude (both and ) behaves smooth near 1300 MeV without any sign of an additional .
Moving on to the channel in Fig. 3 we note again a good overall agreement with a rapid variation near 1500 MeV in both magnitude and phase of the amplitude and a smooth behaviour otherwise. The discrepancy in magnitude near threshold cannot be resolved without disturbing the agreement with magnitude () in the elastic channel and the fit represents a compromise. The inelastic amplitude has been fitted including an arbitrary overall phase.
 |
 |
 |
There are also data on the reaction binon for which the Argand diagram has been constructed mo . Again, there is a nice “small” circle near 1500 MeV above a slowly moving background but no indication of a second circle. These data are not yet included in the fit.
The shortcomings of the above fits in certain details suggest some improvements. First, it should be noted that the parametrisation (2) is to be considered as a phenomenological ansatz; it has correct limits into elastic or mixed elastic-inelastic channels but in its general form it is unitary but not necessarily symmetric as it should be. While our application is similar to the mixed case a formula with all constraints fulfilled would be desirable. It may be interesting to compare with a matrix ansatz as well despite its other shortcomings. Also one may test resonance formulae beyond the minimal form (3) and the role of possible additional background.
4 Summary and desirable future studies
Using data from elastic and charge exchange scattering and some information on the channel we are able to find a unique solution for the isoscalar wave. The respective Argand diagram clearly shows the small circle from consistent with known elasticity above the broad background from (its directly observable Breit-Wigner mass is 1000 MeV). A simple parametric fit reproduces the main features of the data in terms of the broad and the narrow and while there is no direct signal from which yields the limit .
The main difference to the earlier studies with positive evidence for is our technique of using an energy independent analysis of the scattering data. In this way the extraction of partial wave amplitudes and their parametric representation can be discussed separately. Note that the phase shift data as in Fig. 1,2 together with those from the other partial waves come from a very good fit to the original experimental moments with small in all bins. Therefore there is very little room for additional resonance circles. A global fit to the original data (moments, Dalitz plot) typically has a rather large and this may be due to a simplified parametrisation (as in our fit) or also to an inadequate amplitude structure, the latter case is avoided in performing a point by point phase shift analysis first.
It will therefore be desirable to perform energy independent analyses with other data of high statistics. Such developments have started for 3-body final states recently meadow , noteworthy the recent amplitude determination in by BaBaR babar . Such data may be precise enough to resolve in a model independent way small circles, i.e. resonances with small couplings, such as the suspected . Similar studies could be performed for 3 body, which needed in addition an assumption on nucleon spin couplings. While such analyses cannot determine absolute branching ratios from a particular channel as we can do in our analysis, they can help to establish the existence of such states like if a positive resonance signal is detected.
References
- (1) C. Amsler et al., Phys. Lett. B667, 1 (2008).
- (2) C. Amsler and F.E. Close, Phys. Lett. B353, 385 (1995); Phys. Rev. D53, 295 (1996).
- (3) A. Hart, C. McNeile, C. Michael, J. Pickavance, Phys. Rev. D 74, 114504 (2006).
- (4) S. Narison, Nucl. Phys. B509, 312 (1998); Nucl. Phys. A675, 54c (2000); E. Bagan and T.G. Steele, Phys. Lett. B243, 413 (1990); H. Forkel, Phys. Rev. D64, 034015 (2001).
- (5) P. Minkowski and W. Ochs, Eur. Phys. J. C9, 283 (1999).
- (6) D.V. Bugg, Eur. Phys. J. C52, 55 (2007); D.V. Bugg, A.V. Sarantsev, B.S. Zou, Nucl. Phys. B471, 59 (1996).
- (7) D. Cohen et al., Phys. Rev. D22, 2595 (1980).
- (8) G. Grayer et al., Nucl. Phys. B75, 189 (1974).
- (9) B. Hyams et al., Nucl. Phys. B64, 134 (1973); W. Ochs, University Munich, thesis 1973.
- (10) B. Hyams et al., Nucl. Phys. B100, 205 (1975); W. Männer, AIP Conf. Proc. 21, 22 (1974).
- (11) P. Estabrooks and A.D. Martin, Nucl. Phys. B95, 322 (1975).
- (12) W. Ochs, Nucl. Phys. B (Proc. Suppl.) 174, 146 (2007).
- (13) H. Becker et al., Nucl. Phys. B151, 46 (1979); R. Kamiński, R. Lesniak and K. Rybicki, Eur. Phys. J. direct C4, 4 (2002).
- (14) D. Alde et al., Eur. Phys. J. A3, 361 (1998).
- (15) J. Gunter et al., Phys. Rev. D64, 072003 (2001).
- (16) D. Cohen et al., Phys. Rev. D22, 2595 (1980).
- (17) A. Etkin et al., Phys. Rev. D25, 1786 (1982).
- (18) C. Michael, Phys. Lett. B21, 93 (1966); R.H. Dalitz, Ann. Rev. Nucl. Sci. 13, 339 (1963).
- (19) F. Binon et al., Nuov. Cim. A78, 313 (1983).
- (20) E.M. Aitala et al., Phys. Rev. 73, 032004 (2006).
- (21) B. Aubert et al., Phys. Rev. D79, 032003 (2009).