Stellar Winds and Mass Loss from Extreme Helium Stars
Abstract
Extreme helium stars are very rare low-mass supergiants in a late stage of evolution. They are probably contracting to become white dwarfs following a violent phase of evolution which caused them to become hydrogen-deficient giants, possibly R CrB stars. Using the latest generation of models for spherically expanding stellar atmospheres, we set out to measure mass-loss rates for a representative fraction of these stars. We have used high-resolution ultraviolet and optical spectra, and ultraviolet, optical and near-infrared photometry from a variety of archives. Overall atmospheric parameters have mostly been taken from previous analyses and checked for consistency. Mass-loss rates were measured by fitting the P-Cygni and asymmetric profiles of C, N and Si ultraviolet resonance lines and lie in the range . These rates follow a Castor-type () relation marking a lower limit for the mass loss from hot stars of all kinds. The mass-loss rates of the studied stars also show a strong correlation with their proximity to the Eddington limit. There is no firm evidence for variability in the stellar wind, although photospheric pulsations have been reported in many cases.
keywords:
stars: evolution, stars: mass-loss, stars: chemically peculiar1 Introduction
Amongst the more unusual groups of stars in the Galaxy is a collection of low-mass but nevertheless luminous stars from whose surfaces hydrogen is almost completely absent. Instead they are composed principally of helium and some 3% carbon (by mass). The collection includes R CrB stars, with rough spectral classes F and G, extreme helium stars, with classes A and B, and some helium subdwarf O stars (Jeffery, 2008). It had long been questioned whether these stars are hydrogen-deficient because their outer layers have been stripped by a stellar wind, as in the massive Wolf-Rayet stars, or diluted by deep mixing of the stellar envelope, as in the low-mass Wolf-Rayet central stars of planetary nebulae, or by some more exotic process (Schönberner, 1986). Increasing evidence has accrued that these stars are the result of a merger between a helium- and a carbon/oxygen white dwarf. In such stars the helium white dwarf is entirely disrupted, wrapping itself around its more massive companion, whereupon a helium shell is ignited and the star becomes a helium supergiant for a few tens of thousands of years, before contracting to become a massive C/O white dwarf (Webbink, 1984; Iben & Tutukov, 1984; Saio & Jeffery, 2002; Pandey et al., 2006; Clayton et al., 2007). While the arguments for the white dwarf merger model are compelling, sufficient questions remain that it is important to extract as much physical information concerning these stars as possible.
It has been known since the early days of the International Ultraviolet Explorer (IUE) (Kondo et al., 1989) that some of the hotter (B- and O-type) hydrogen-deficient stars showed significant P Cygni-type line profiles in strong ultraviolet resonance lines, indicating the presence of a stellar wind and hence mass loss from the stellar surface (Darius et al., 1979; Giddings, 1981; Hamann et al., 1982; Jeffery et al., 1986; Dudley & Jeffery, 1992). Estimates of mass-loss rates of between and from these early studies showed that the current stellar wind is unlikely to be responsible for stripping the entire hydrogen envelope.
However, the study of the winds in these stars is important for several other reasons. First, it is well known that a relation exists between luminosity and mass-loss rate (or, more precisely, wind momentum) (Kudritzki et al., 1999), so that the latter becomes a proxy for the former. This is extremely useful when distances are not known. Moreover, models for pre-white dwarf contraction give a direct relation between luminosity and mass (Saio & Jeffery, 1988, 2002).
The drawback is that the modelling of a stellar wind requires a difficult computation in order to satisfy conditions of radiative and statistical equilibrium, and momentum and energy conservation. Specifically, the conditions of local thermodynamic and hydrostatic equilibrium no longer hold, and it is necessary to compute a self-consistent multi-level multi-atomic model in an expanding medium. Fortunately, in the quarter century since this topic was last addressed, our ability to perform such calculations has improved by orders of magnitude, so that a re-examination of the question is timely. Additional data from IUE, the Hubble Space Telescope (HST), the Far Ultraviolet Space Explorer (FUSE), the Tübingen Echelle Spectrograph aboard the Orbiting and Retrievable Far and Extreme Ultraviolet Spectrometer (ORFEUS/TUES) and several ground-based telescopes provide an additional opportunity to improve on earlier results. In the cases of the hottest (O-type) helium stars, the LTE assumption is of little value, so that a study of this type provides an opportunity to gain new knowledge about the surfaces of these stars.
This paper addresses the following questions. Do early-type low-mass helium stars show conventional radiatively driven stellar winds and, if so, what are the associated mass-loss rates? Can such a mass-loss rate be used as a proxy for the luminosity, and hence mass, of the star in question? Are the results consistent with the predictions of stellar evolution theory?
Section 2 describes the observational data available for such a study and explains which data have been used and why. It gives more information about the particular stars examined – namely BD, BD, HD160641, BD, BD, and HD144941. Section 3 describes the theoretical framework for the wind analysis, including the self-consistent wind models, the formal solutions and the methods used to fit the observations. Section 4 presents the measurements for individual stars, and Section 5 concludes with an assessment and interpretation of the measurements.
2 Observational Data
To determine stellar wind properties it is necessary to observe the profiles of various spectral lines. Most of the lines of interest lie in the ultraviolet and far ultraviolet; therefore high-resolution spectroscopy from space is required. To support these data, the surface temperature and chemical composition of the star also need to be known. The former is best described by fitting the overall flux distribution, the latter by fine analysis of the high-resolution photospheric spectrum. For three of the stars studied here, measurements of both have already been made; these show some discrepancies from one publication to another, which can be attributed to improvements in either the observations or the model atmospheres. The following subsections describe the stars selected for study, the ultraviolet data available for wind analysis, and other supporting ground-based spectroscopy and photometry.
2.1 Sample Selection
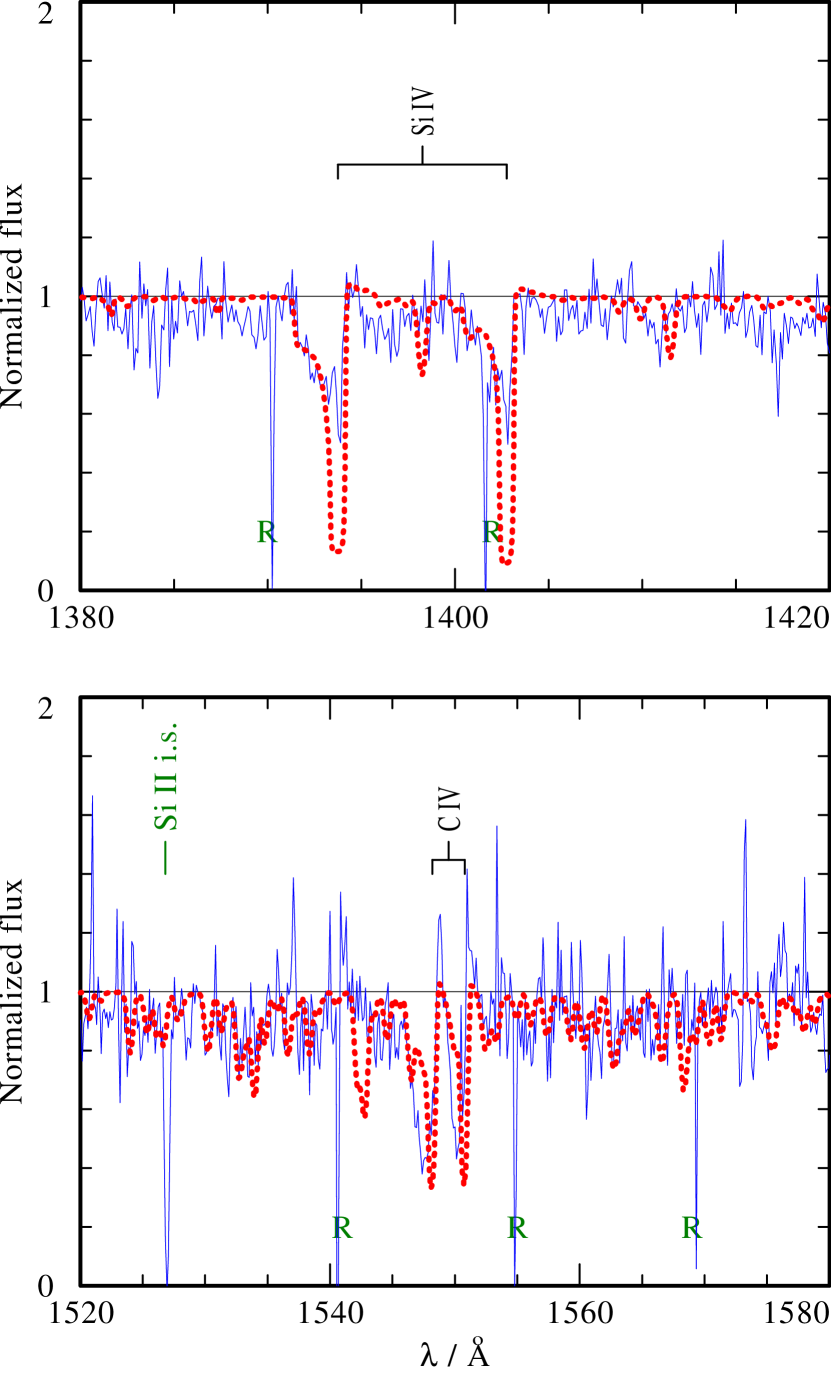
The primary criterion for selection is that targets should be bright enough for high-resolution ultraviolet spectroscopy, and so must be hot with low interstellar extinction. This limited the original study of winds in extreme helium stars (Hamann et al., 1982) to HD160641, BD, and BD. Other extreme helium stars with effective temperature111We distinguish the effective temperature obtained from analyses of photospheric spectra from the surface temperature conventionally used in stellar wind models (§ 3). include BD, LSS 3184, LS IV, LSS 5121, DY Cen, LSS 4357, LSE 78, LSS 99, LS IV, HD124448 and MV Sgr (Jeffery et al., 2001). While all have been observed with IUE, none show evidence of strong P Cygni line profiles at low resolution. The hottest stars (LS IV and LSS 5121) are heavily reddened and have not yet been observed at high resolution. Thus the secondary selection criterion is that suitable data are already available. Figure 1 shows a part of the spectrum of those stars which satisfy these criteria in the vicinity of the Civ resonance double at 1548-50Å. Strong P Cygni profiles are evident in the hottest stars (top), weakening towards lower effective temperature (bottom). For BD and HD144941, the Civ lines are asymmetric. For BD, they are slightly broadened and possibly purely photospheric. For HD168476, only the interstellar component is readily identified.
In addition to these classical extreme helium stars we included three closely-related stars. HD144941 has a hydrogen abundance around 3% by mass (Harrison & Jeffery, 1997), and is carbon weak. It has been linked to low-luminosity extreme helium stars like BD, although the nature of the connection is unclear. The UV spectrum shows evidence of a stellar wind (Jeffery et al., 1986).
It is not known whether the two helium sdO stars BD and BD represent very hot extreme helium stars, although they are known to be hydrogen-deficient (Wolff et al., 1974) and very luminous relative to other helium-rich sdO stars. No complete quantitative analysis has been formally published for either star. A non-LTE study of the winds in both stars gives mass-loss rates (Giddings, 1981) and was reported by Darius et al. (1979). A photospheric analysis of BD by Husfeld was reported by Bauer & Husfeld (1995) and shows H and C abundances similar to other extreme helium stars.
Finally, we omitted BD, HD124448 and HD168476 from our analysis on the grounds that these data either showed little evidence for a stellar wind, or were too noisy.

2.2 Ultraviolet Spectroscopy
High-resolution ultraviolet spectra of extreme helium stars have been obtained with four spacecraft, namely the International Ultraviolet Explorer (IUE), the Hubble Space Telescope (HST), The Far Ultraviolet Explorer (FUSE) and the Orbiting and Retrievable Far and Extreme Ultraviolet Spectrometer (ORFEUS II).
A summary of the data available for extreme helium stars with K is given in Table 1. In four cases, spectra were obtained in overlapping wavelength intervals by more than one instrument, and found to agree well. Where multiple exposures of a given object were obtained with the same instrument, the reduced spectra were combined to increase the overall signal-to-noise ratio, using the individual exposure times as weights.
The greatest body of ultraviolet spectroscopy for extreme helium stars continues to be SWP HIRES images obtained with IUE. Despite the larger collecting area of the Hubble Space Telescope, shorter exposure times mean that STIS images which include the key wind lines (C iii, C iv, Si iv, N v) have lower signal-to-noise than the corresponding merged IUE data. ORFEUS data for BD are of considerably higher S/N than the merged IUE spectrum, so these data have been used at wavelengths shortward of 1400Å. For BD, the IUE and ORFEUS data are of comparable quality.
| Star | Instrument (Observer) | Image Number | Date | [s] | [Å] | Res. [Å] |
|---|---|---|---|---|---|---|
| BD | IUE SWP HL | 06766 | 1979-10-05 | 3600 | 1150 – 1980 | |
| IUE SWP HL | 07248 | 1979-11-28 | 2643 | 1150 – 1980 | ||
| MacDonald 2.7m Coude | 3700 – 7000 | 0.15 | ||||
| BD | IUE SWP HL | 06768 | 1979-10-05 | 3600 | 1150 – 1980 | |
| ORFEUS TUES | 5209_3 | 1996-11-30 | 2341 | 904 – 1410 | ||
| Calar Alto 2.2m FOCES | 3980 – 6600 | 0.1 | ||||
| HD 160641 | HST STIS 0.2X0.2 E140M | O66V02010 | 2000-10-23 | 150 | 1145 – 1729 | |
| ESO 3.6m CASPEC (1) | mean | 1984-04-03, 1985-04-09 | 3900 – 5160 | 0.15 | ||
| AAT 3.9m UCLES (2) | mean | 2005-08 | 3900 – 5160 | 0.15 | ||
| BD | IUE SWP HL | 13826 | 1981-04-28 | 23880 | 1150 – 1980 | |
| IUE SWP HL | 30797 | 1987-04-17 | 24240 | 1150 – 1980 | ||
| IUE SWP HL | 30808 | 1987-04-19 | 23520 | 1150 – 1980 | ||
| IUE SWP HL | 30814 | 1987-04-20 | 20460 | 1150 – 1980 | ||
| IUE SWP HL | 30818 | 1987-04-21 | 21540 | 1150 – 1980 | ||
| ESO 3.6m CASPEC (3) | mean | 1987-04 | 3994 – 4988 | 0.15 | ||
| ESO 3.6m CASPEC (3) | mean | 1987-04 | 5778 – 6790 | 0.15 | ||
| BD | HST STIS 0.2X0.2 E140M | O66V04010 | 2001-02-11 | 144 | 1145 – 1729 | |
| ESO 3.6m CASPEC (1) | 1985-04-08 | 3790 – 4810 | 0.15 | |||
| HD 144941 | IUE SWP HL | 23961 | 1984-09-14 | 12600 | 1150 – 1980 | |
| IUE SWP HL | 23962 | 1984-09-14 | 8940 | 1150 – 1980 | ||
| AAT 3.9m UCLES (4) | 1995-04-15 | 3900 – 5160 | 0.15 |
Observer: (1) Heber; (2) Ahmad, Sahín & Jeffery; (3) Heber & Jeffery; (4) Harrison & Jeffery
2.3 Optical Spectroscopy
Blue-optical spectra have been used to ensure that the wind models are consistent with the global emergent spectrum and, in particular, with the profiles of strong lines formed in the photosphere and unaffected by the wind. These data come from a variety of sources (Table 1) and are also used with caution. Three of the targets are known or suspected to be variable; the adopted optical spectra of HD160641 and BD are direct averages of time-series spectra obtained over four and three nights respectively. Both stars are pulsating and and show substantial line-profile variability on a timescale of hours (Jeffery & Heber, 1992; Wright et al., 2006). Variability with in BD (Bartolini et al., 1982) has not been confirmed.
2.4 Ultraviolet, Optical and Infrared Spectrophotometry
Finally, to ensure conservation of total flux and to check the interstellar extinction, spectrophotometry from the ultraviolet to infrared was collated. UV spectrophotometry was the same as used by Jeffery et al. (2001), with the addition of IUE images SWP05642, LWR04892 and LWR02805 for BD. Optical photometry (Johnson and ) were taken from SIMBAD, and infrared fluxes were retrieved from 2MASS.
3 Theoretical Framework
For analyzing the stars, we compare the observations with synthetic spectra calculated with the Potsdam Wolf-Rayet (PoWR) model atmospheres code (Hamann & Gräfener, 2004, and references therein). This code solves the non-LTE radiative transfer in a spherically symmetric expanding atmosphere. Mass-loss rate and wind velocity are free parameters of the models.
Wind inhomogeneities (“clumping”) are accounted for in a first-order approximation, assuming that optically thin clumps fill a volume fraction while the interclump space is void. Thus the matter density in the clumps is higher by a factor , compared to an un-clumped model with the same parameters. = 4 is arbitrarily assumed throughout this paper. Nothing is known about the wind homogeneities in our program stars. Even for the winds from massive stars, the clumping contrast is highly debated (see Hamann et al., 2008). Fortunately, this issue has no impact on the present study, since we derive the mass-loss rates from resonance lines. Since their (mainly line-scattering) opacity scales linearly with density, inhomogeneity does not change the average opacity as long as the individual clumps are optically thin (Oskinova et al., 2007). Moreover, since the resonance lines are not strongly saturated in the observed spectra our program stars, the clumps are certainly not optically thick.
Detailed ions of H, He, C ii – C iv, N ii – N v and Si iii – Si iv are taken into account in our models. About 350 non-LTE levels and 4500 line transitions are explicitely treated. Because of the unsettled questions about how to include dielectronic recombination properly, this process is neglected.
The models account for line blanketing by iron and other iron-group elements. About energy levels and line transitions between those levels are taken into account in the approximation of the “superlevel” approach.
As already mentioned, the velocity field must be pre-specified. In the subsonic region, is defined such that a hydrostatic density stratification is approached. For the supersonic part we adopt the usual -law, basically of the form , with the terminal velocity being a free parameter. The exponent is chosen between 0.7 and 1.0 such that the wind profiles are reproduced best. For some program stars we employ a “double beta law”, which means that a second term of the same -law form is added to the velocity, but with a large . Typically, 40% of the terminal velocity is attributed to this second term. Its effect is that the velocity does not approach the terminal velocity too soon. The “double beta law” makes the blue edges of P-Cygni profiles less steep. This often fits the observation better, and has also found theoretical support from hydrodynamically consistent models (Gräfener & Hamann, 2005).
| Star | |||||||||||||
|---|---|---|---|---|---|---|---|---|---|---|---|---|---|
| Ref. | Ref. | ||||||||||||
| [kK] | [mag] | [] | [] | [] | [] | [%] | [%] | [%] | [%] | [%] | |||
| BD | |||||||||||||
| 41.0 | 0.00 | 1 | |||||||||||
| 55.0 | 0.00 | 4.0 | 4.4 | 2200 | 2 | ||||||||
| 3 | |||||||||||||
| BD | |||||||||||||
| 60.0 | 0.0 | 4.0 | 4.5 | 4 | 0 | 2.5 | 0.3 | 0.08 | 5 | ||||
| 55.0 | 0.00 | 4.0 | 4.4 | 2200 | 2 | ||||||||
| 3 | |||||||||||||
| HD160641 | |||||||||||||
| 31.6 | 0.45 | 1 | 0 | 0.3 | 0.5 | 0.06 | 6 | ||||||
| 34 | 2.8 | 7 | |||||||||||
| 4.5 | 550 | 8 | |||||||||||
| 3 | |||||||||||||
| BD | |||||||||||||
| 22.7 | 0.24 | 2.55 | 4.1† | 1,9 | 0.04 | 1.3 | 0.09 | 0.14 | 0.017 | 9 | |||
| 600 | 8 | ||||||||||||
| 3 | |||||||||||||
| BD | |||||||||||||
| 19.5 | 0.00 | 2.6 | 3.7† | 1,10 | 0 | 3 | 0.13 | 0.04 | 0.01 | 10 | |||
| 16.9 | 0.00 | 2.6 | 3.5† | 11 | 0 | 2.2 | 0.08 | 0.013 | 0.006 | 11 | |||
| 400 | 8 | ||||||||||||
| 3 | |||||||||||||
| HD144941 | |||||||||||||
| 23.2 | 0.25 | 3.9 | 2.7† | 12 | 1.4 | 0.005 | 0.003 | 0.0025 | 0.002 | 12,13 | |||
| 27.8 | 0.25 | 1 | |||||||||||
| 350 | 14 | ||||||||||||
| Notes: | : estimated from , using the relation for He-shell burning stars (Jeffery, 1988). | ||
|---|---|---|---|
| References: | 1: Jeffery et al. (2001) | 2: Darius et al. (1979); Giddings (1981) | 3. Dudley & Jeffery (1992) |
| 4: Husfeld (1987) | 5: Bauer & Husfeld (1995) | 6: Aller (1954) | |
| 7: Rauch (1996) | 8: Hamann et al. (1982) | 9: Jeffery & Heber (1992) | |
| 10: Heber (1983) | 11: Pandey et al. (2006) | 12: Harrison & Jeffery (1997) | |
| 13: Jeffery & Harrison (1997) | 14: Jeffery et al. (1986) | ||
Further input parameters to the PoWR models are the luminosity and the “stellar temperature” . The latter refers, via the Stefan-Boltzmann law, to the radius which is the inner boundary of the model atmosphere, by definition located at a Rosseland optical depth of 20. In contrast, the usual “effective temperature” refers to the radius where the Rosseland optical depth is 2/3. In thick expanding atmospheres, e.g. from Wolf-Rayet stars, this can be considerably larger than . The winds of our program stars are rather weak, and hence the difference between and can be neglected here.
The Doppler velocity reflects random motions on small scales (“microturbulence”). In stellar winds is usually found to be of the order of 10% of the terminal wind velocity. Unfortunately the PoWR code does not allow to vary with the depth in the atmosphere. Therefore we apply a smaller value in the “formal integral” when calculating the photospheric absorption spectrum in the optical, and a larger value for the UV spectrum with the wind lines. The millions of iron-group lines are always calculated with for numerical reasons, which is certainly too high for the photosphere and therefore may lead to a slight overestimate of the iron-line forest in the UV.
In addition to Doppler broadening from microturbulence, radiation damping and pressure broadening of spectral lines are taken into account in the formal integral. This is a new feature of the PoWR code not yet documented in previous publications. The broadening of H i and He ii lines uses tables from Vidal et al. (1973) and Schöning & Butler (1989c, b, a) respectively. Voigt functions are used for lines of neutral helium, with calculation of the coefficients following Griem et al. (1962). Excited lines from other elements are broadened by the quadratic Stark effect following the approximation from Cowley (1971).
Pressure broadening is missing in the code for lines that are not covered by the mentioned sources. We have no pressure broadening included yet for resonance lines, which is a noticeable deficiency in our spectral fits. This somewhat incomplete treatment of line broadening is due to the historical fact that the PoWR code was developed for stellar wind spectra where pressure broadening is negligible.
4 Spectral analyses
Since the winds from our program stars are weak, their spectra mainly form in the nearly hydrostatic photosphere. Except for the strongest lines which are affected by the stellar wind, static, plane-parallel non-LTE models therefore provide a reasonable approximation. All our program stars have been previously studied with static models in more or less detail. We adopt the parameters from these previous studies, at least as a first guess. This refers to the effective temperature , the surface gravity , the stellar luminosity , and the chemical composition (see Table 2). We check the fit of the photospheric absorption line spectra with our models, and keep the parameters from previous work whenever possible, but also encounter the need to adjust parameters in a few cases (see below).
4.1 BD+37∘1977
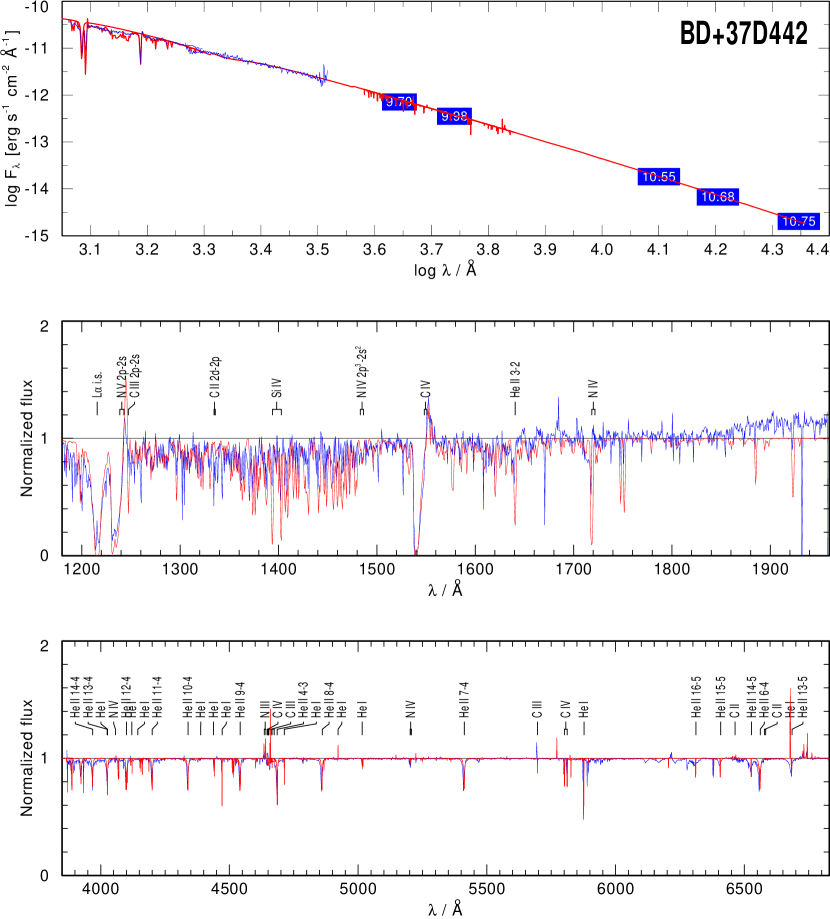
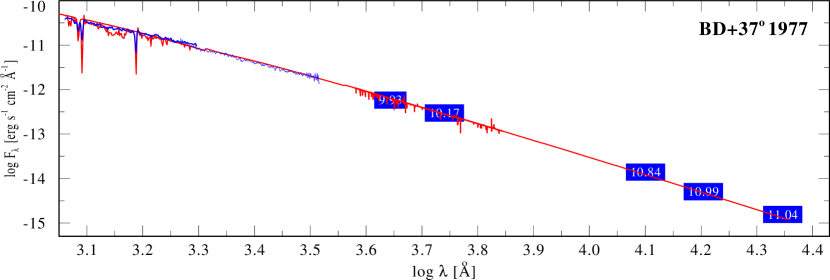
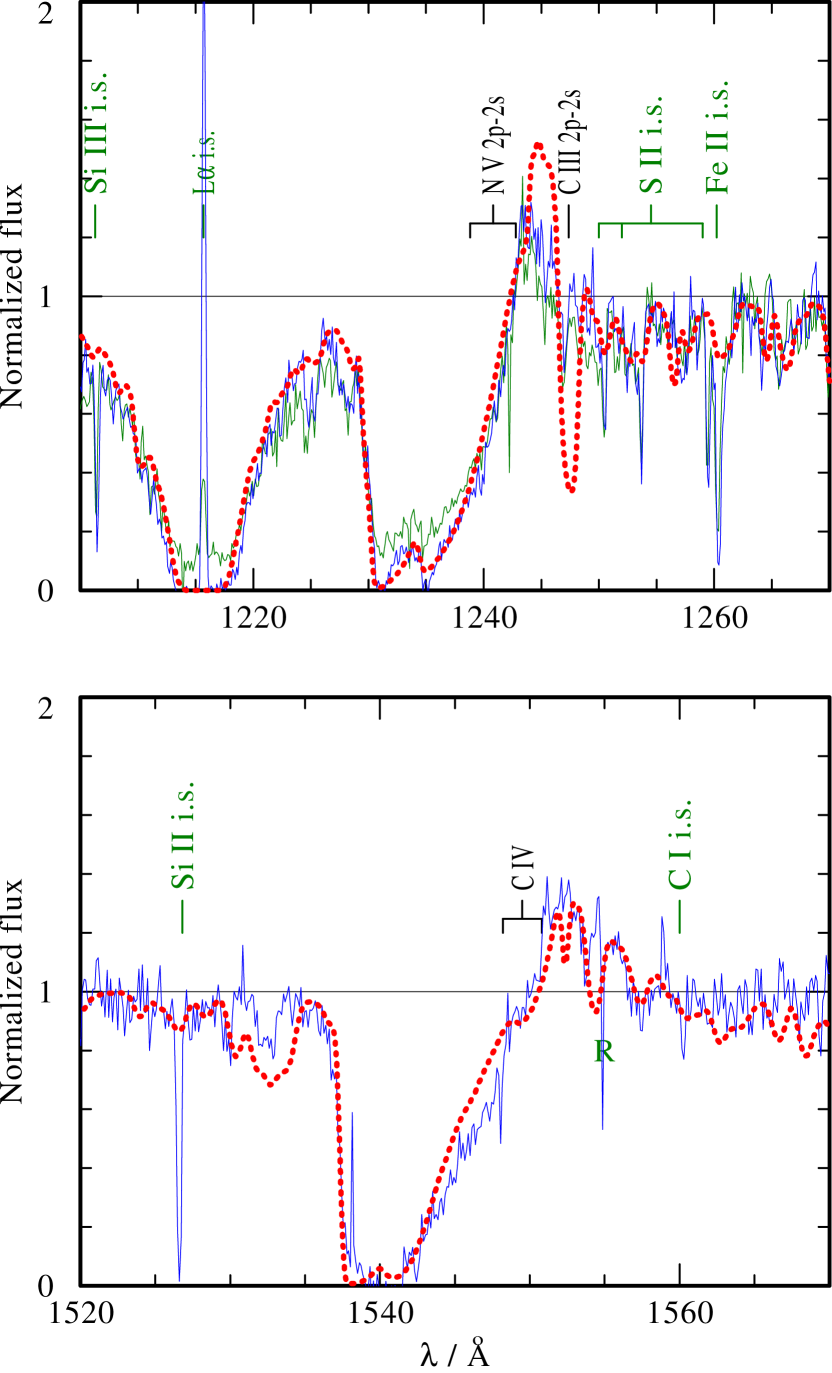
Our fit procedure with the PoWR models is decribed now by the example of the first program star, BD. The observed and computed spectral energy distribution (SED) is shown in Fig. 2. Since the model luminosity was adopted from previous work, the SED fit is achieved by adjusting the color excess and the distance modulus to the values given in Table 3.
The model SED depends of course also on the stellar parameters. Hence we have to look at the line spectrum as well, and the whole procedure is in fact iterated. The lower panel of Fig. 3 shows the optical spectrum, which is dominated by the lines from neutral and ionized helium. Getting the balance between the He i and the He ii lines right constrains the effective temperature. Previous (static) analyses give slightly discrepant values for (41 kK and 55 kK, respectively, see Table 2). We find a good fit with . The pressure-broadened line wings are reasonably well reproduced with from the previous work.
Unfortunately, BD was not analyzed yet for the chemical abundances. However, BD can be considered as a spectroscopic twin, and the composition of the latter has been studied with static models by Bauer & Husfeld (1995). Therefore we adopt the abundances from that paper. The iron mass fraction we set to half solar. With this composition, the simulated “iron forest” in the UV still appears a bit stronger than observed, as does the Si iv resonance doublet. But this problem can be attributed to the effect of microturbulence. The UV range has been calculated with a microturbulent velocity of 100 km s-1, which is adequate for the P Cygni profiles from N v and C iv that are formed in the very fast wind of this star. For the photospheric lines this value is far too high, but the code allows only for a uniform value. The optical range is calculated with a microturbulence of 30 km s-1 which may be adequate for the photosphere.
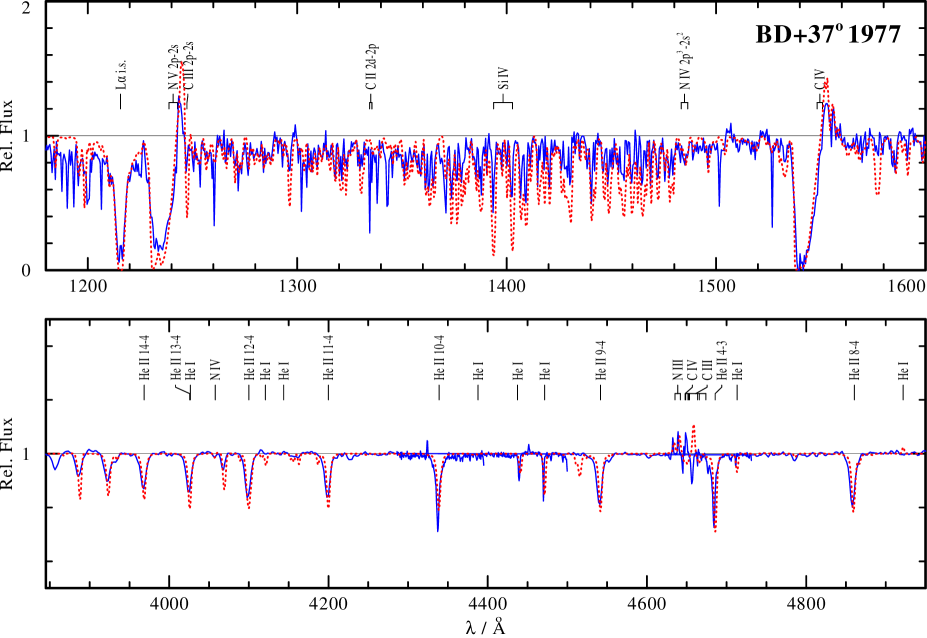
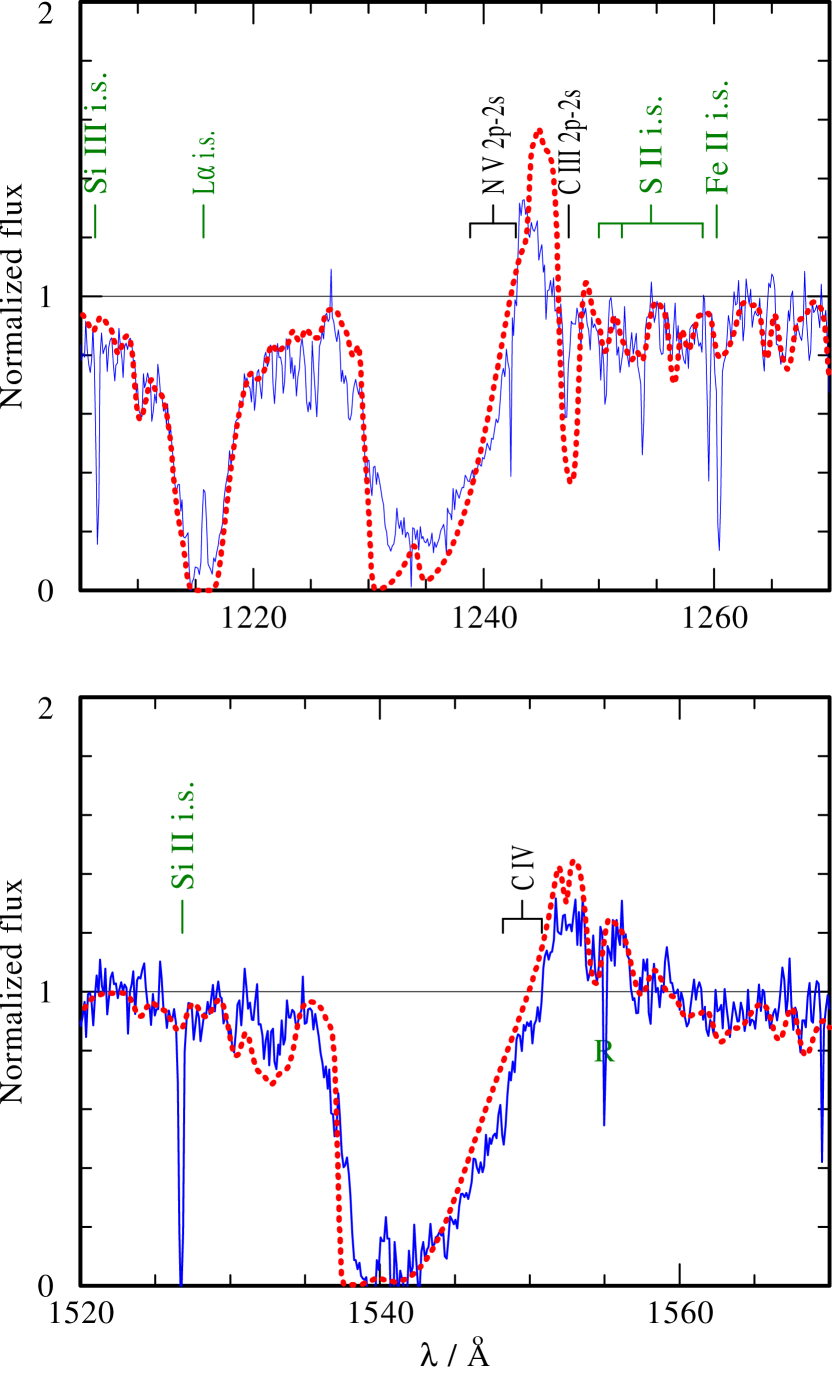
Finally we turn to the wind lines in the spectrum of BD, which are the P Cygni profiles of the N v and the C iv resonance doublets shown in the upper panel of Fig. 3, or in more detail in Fig. 4. The terminal wind velocity is adjusted to fit the width of the P Cygni profiles, while the mass-loss rate influences their overall strength. The parameters for the best fit are included in Table 3. The two wind-formed lines available are close to saturation. Hence the error margin of the mass-loss rate (usually about a factor of two) is asymmetric in this case, i.e. much higher rates cannot be safely excluded. One should also keep in mind that any error in the nitrogen and carbon abundances directly propagates into our empirical mass-loss rate.
Note that in this semi-empirical approach, the mass-loss rate and wind velocity are free parameters. Hydrodynamically consistent solutions that agree with observations have been constructed for, e.g. massive O stars (for a recent review see Puls et al., 2008), and some Wolf-Rayet subtypes (Gräfener & Hamann, 2005, 2008) under the paradigm of radiation-driven winds. Problems with such models are encountered not only for very strong mass-loss, but also for very thin winds (the “weak wind problem”, cf. Marcolino et al., 2009). A first indication if the empirically found mass-loss is plausibly driven by radiation pressure is given by the work ratio, defined as the total momentum intercepted by the wind from the radiation field over the mechanical momentum carried by the stellar wind after escaping from the star (). A computed work ratio somewhat below unity, say about , is expected because of the incompleteness of opacities in the model calculations. Note however that for being fully hydrodynamically consistent the momentum balance must be fulfilled not only globally, but at each radial point. In the case of BD, our final model has a work ratio of 0.60, which means that the parameters are very plausible for a radiation-driven wind.
| Star | ||||||||||||
|---|---|---|---|---|---|---|---|---|---|---|---|---|
| [kK] | [mag] | [] | [] | [mag] | [] | [] | [%] | [%] | [%] | [%] | [%] | |
| BD | 48.0 | 0.03 | 4.0† | 2000 | 0 | 2.5 | 0.3 | 0.08 | 0.06 | |||
| BD | 48.0 | 0.09 | 4.0† | 2000 | 0† | 2.5† | 0.3† | 0.08† | 0.06 | |||
| HD160641 | 35.5 | 0.45 | 2.7† | 500 | 0 | 1.0 | 0.3 | 0.13 | 0.11 | |||
| BD | 25.1 | 0.33 | 2.5† | 400 | 0.04† | 1.3† | 0.09† | 0.14† | 0.015† | |||
| BD | 18.5 | 0.06 | 2.6† | 400 | 0† | 3.0† | 0.08† | 0.0005 | 0.006 | |||
| HD144941 | 27.0 | 0.31 | 3.9† | 500 | 1.4† | 0.005† | 0.003† | 0.001 | 0.01† | |||
| Sun‡ | 0.21 | 0.06 | 0.066 | 0.11 |
4.2 BD+37∘442
BD is a spectroscopic twin of BD, although previous analyses assigned a slightly higher effective temperature to the former. Within the uncertainties, we can adopt the same best-fit model for both objects. BD shows more interstellar redding, but still appears brighter than BD which must be attributed to a smaller distance if the intrinsic luminosities are the same (see Table 3). As mentioned above, we can take the chemical composition from a photospheric analysis by Bauer & Husfeld (1995). The complete SED and line-fit plots are provided as online material, while only the zoomed-in wind lines are shown in the main paper (Fig. 5). The different observations for the N v profile (blue: ORFEUS, green: IUE) demonstrate the problems of background subtraction in high-resolution IUE data.
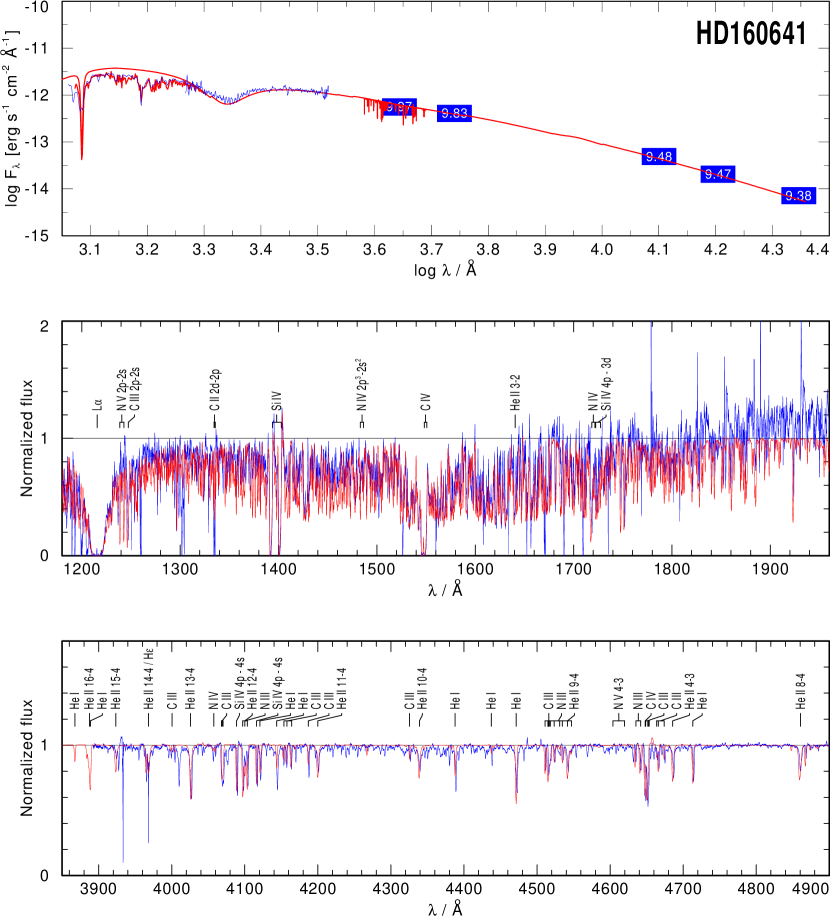
4.3 HD160641 (V2076 Oph)
The helium absorption lines in the optical spectrum are well reproduced with an effective temperature of 35.5 kK, slightly higher than found in previous work. The only abundance analysis published to date is a “quick look-see” by Aller (1954). For the present study we set the carbon abundance to 1 % (mass fraction), which leads to a reasonable reproduction of the photospheric C iii and C iv lines. Such a carbon abundance of a few times solar seems to be typical for extreme helium stars. For the nitrogen abundance the solar value also produces too weak photospheric lines, while five times solar (0.3% mass fraction) gives a reasonable fit. The Si iv line at 4089 Å forces us to adopt twice the solar silicon abundance. Solar iron perfectly reproduces the UV iron forest, and hydrogen is apparently absent. The iron forest has also significant impact on the SED, which is perfectly fitted by the model. The fit of the SED and the UV and blue-optical line spectrum are shown in the online material (Fig. 13). In the formal integral, different microturbulent velocities are again used for the UV range with the wind lines () and for the photospheric spectrum in the optical ().
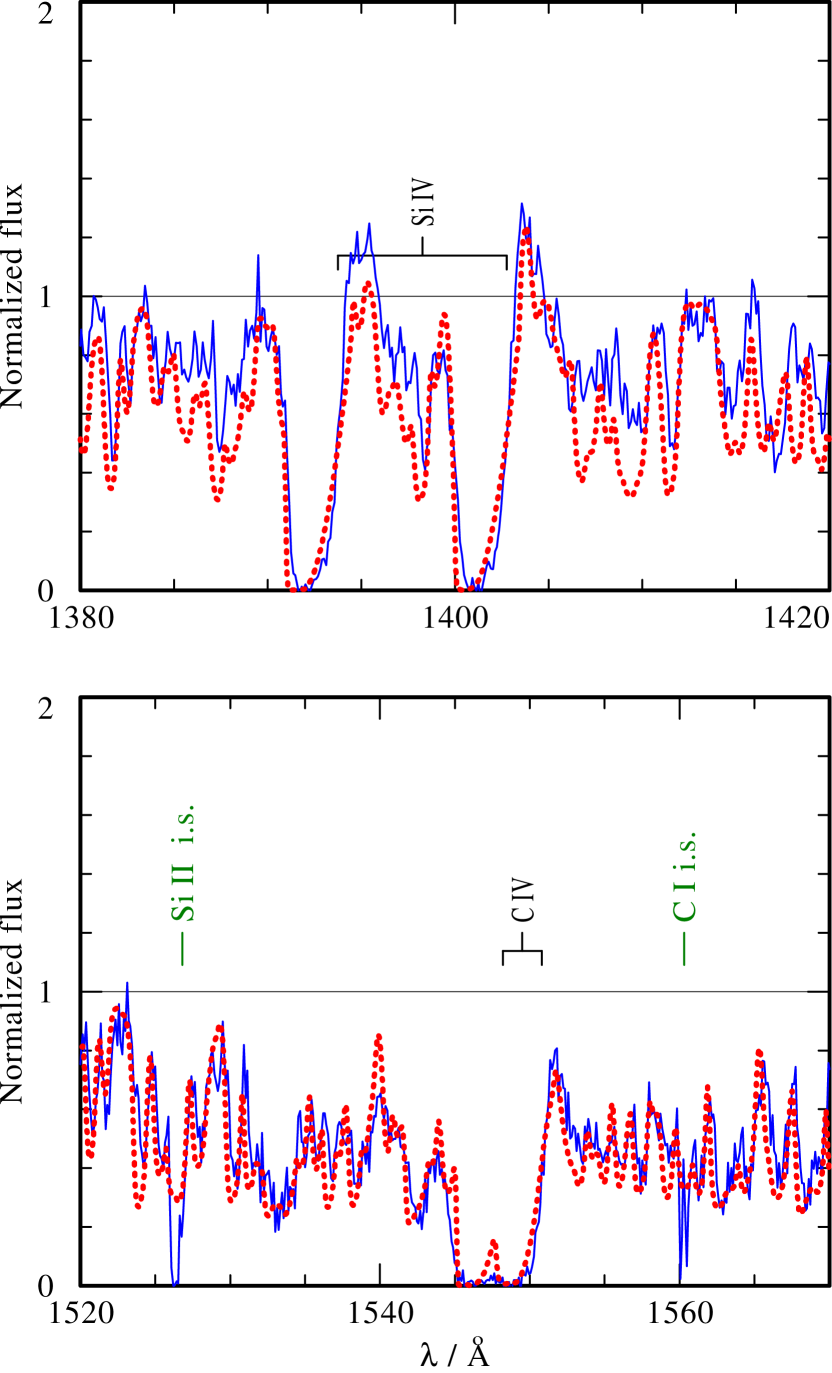
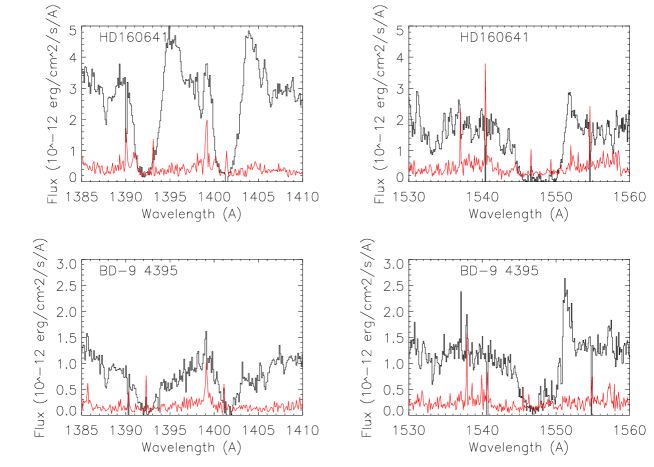
The UV spectrum of HD160641 shows wind-line profiles of the Si iv and C iv resonance doublets (see Fig. 6), both embedded in a pronounced forest of iron lines. The P-Cygni profiles are not very wide, and fitted with a moderate wind velocity of . A two--law, where 40% of the velocity is attributed to a slow acceleration with , has improved the nice fit of the profile shape.
By adjusting the mass-loss rate, the model matches both lines simultaneously. Again, the fit is not very sensitive to higher values because of saturation. Also for this star the “work ratio” is close to unity (1.15) and supports the plausibility of a radiation-driven wind.
The observation also shows the Nv resonance doublet as a P-Cygni profile, while the model only predicts photospheric absorptions. Due to the relatively low stellar temperature, the ionization stage of N v is not populated in the stellar wind. Hence the observation of that wind line is a hint that “superionization”, known from the winds of massive O stars, is also effective in the winds studied here.
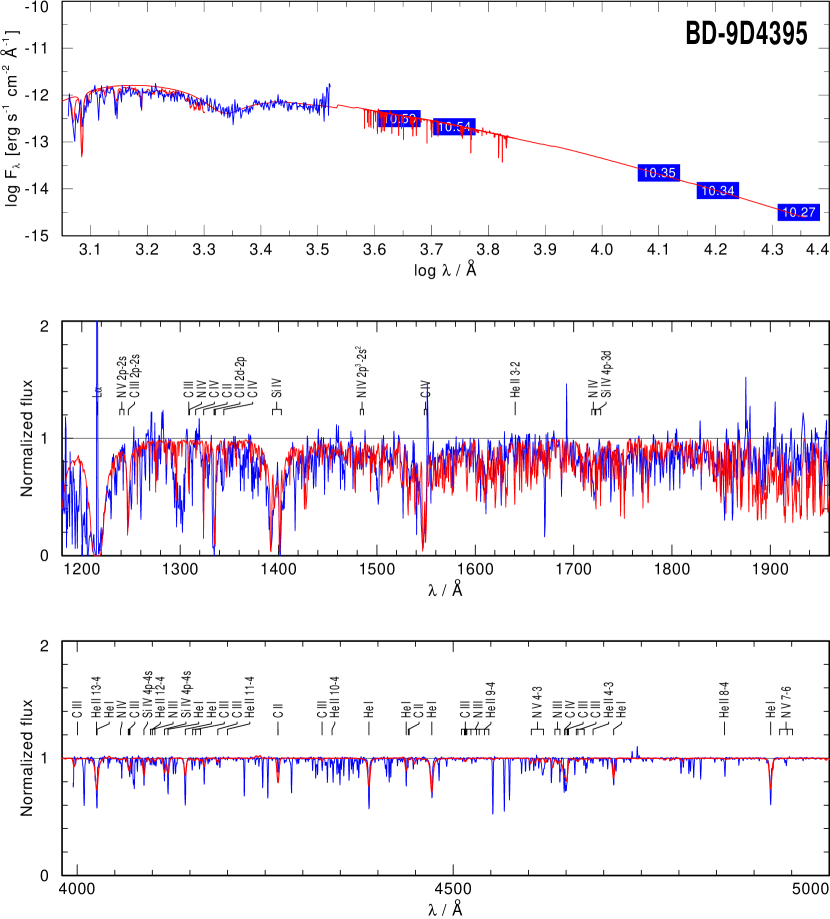
4.4 BD9∘4395 (V2209 Oph)
BD is a somewhat weird star, as it shows variations in total light, radial velocity and line spectrum. These peculiarities have been attributed to non-radial oscillations and dynamical activities in a circumstellar shell. A detailed analysis of this star has been published by Jeffery & Heber (1992).
We adopt a slightly higher effective temperature (25.1 kK) than this previous study (22.7 kK) because otherwise our model predicts too strong lines from low ions like C ii. Abundances have been determined in the previous photospheric analysis and can be adopted from there, leading to a good fit of the photospheric line spectrum (apart from the mentioned weird features) including the UV iron line forest (see Online Material, Fig. 14). The SED fits perfectly when adopting the reddening law from Cardelli et al. (1989) with (which gives a marginally better match to the IUE data than the standard ), and reveals a higher interstellar reddening than found in previous work.
The stellar wind manifests itself only marginally in the spectrum of BD. The C iv resonance doublet forms a narrow P-Cygni profile, which can be fitted with a terminal wind velocity of and suitably adjusted mass-loss rate. However, even with a “two-beta-law” for the velocity field (40% with ), which worked fine for HD160641, the round shape of the absorption feature is not reproduced, and the calculated P-Cygni emission is weaker than observed. Because of the small wind velocity, we calculated the formal solution with a Doppler broadening of in the UV and in the optical.
The Si iv resonance doublet shows blue-shifted, asymmetric absorptions which are also not perfectly reproduced by the model. We attribute the remaining mismatch to the neglect of pressure broadening for resonance lines in the PoWR code.
The final model for BD has a “work ratio” of 1.06 and is thus nearly hydrodynamically consistent.
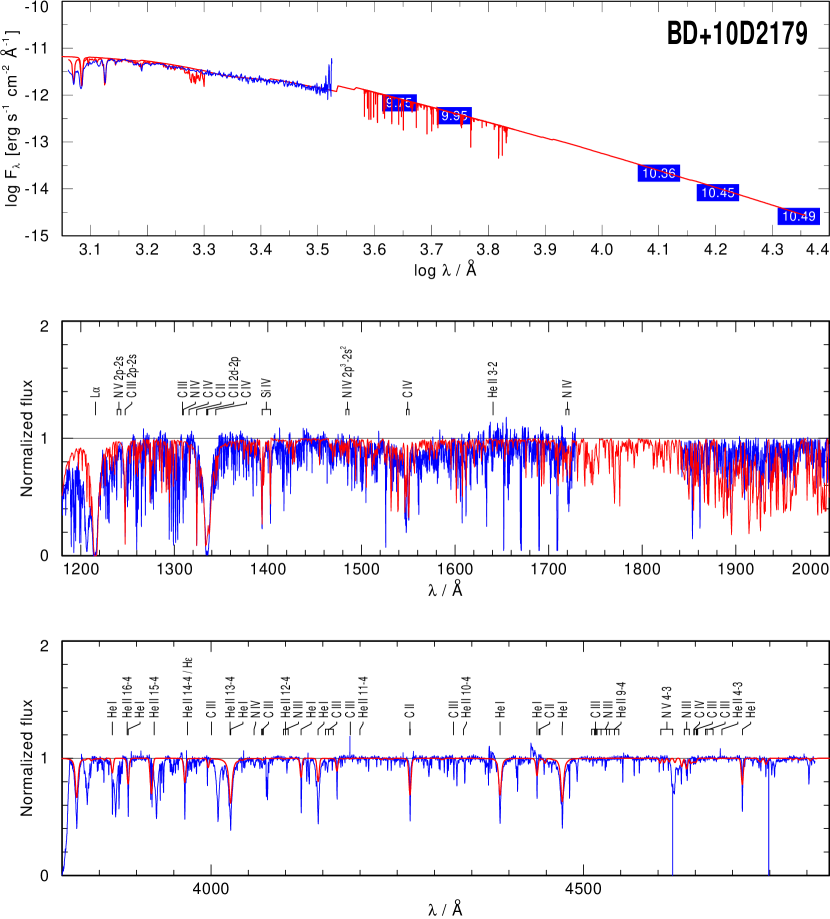
4.5 BD+10∘2179
This star is the coolest of our sample. Slightly discrepant values have been published for its effective temperature (19.5 and 16.9 kK, respectively, cf. Table 2). Therefore we inspect the flux distribution and the photospheric line spectrum. The SED fit for models with kK implies , which is unlikely and in conflict with the interstellar Ly absorption. However, kK makes C ii line at 1335 Å weaker than observed. Only with kK, the Stark-broadened Hei line wings fit nicely (keeping from previous work). As a compromise we finally adopt .
The element abundances also differ between the two previous photospheric analyses. Starting with the values from Pandey et al. (2006), we found that silicon must be even less abundant to avoid too strong photospheric absorption features of the Si iv resonance doublet. For carbon we prefer the slightly higher abundance from Heber (1983).
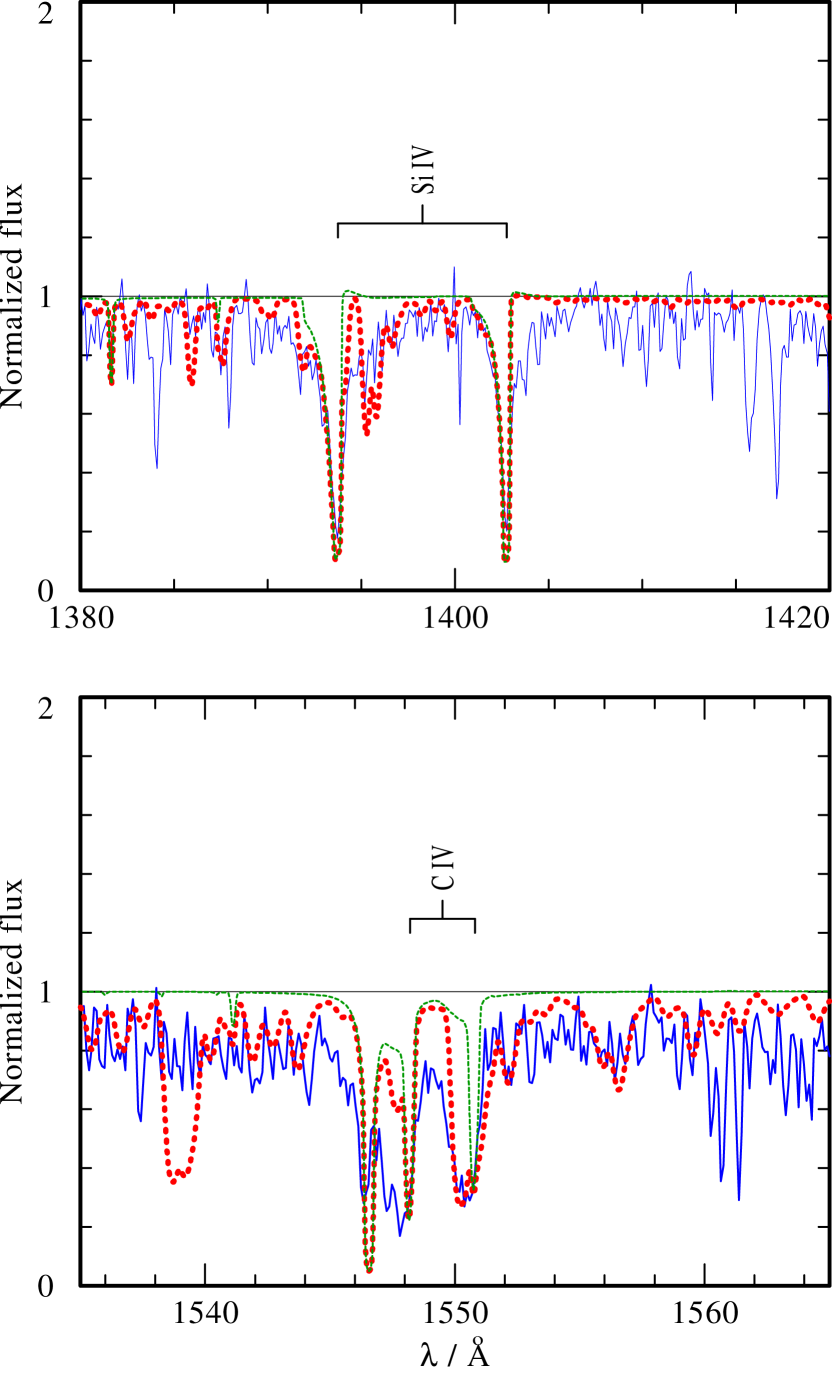
Only weak indications of a stellar wind are found in the UV spectrum of BD. The Si iv resonance doublet shows blue-shifted, asymmetric absorptions. When adopting a two-beta velocity field with and a suitable mass-loss rate, the model can roughly reproduce these profiles (Fig. 8). But since the wind profile is not fully developed, is not accurately constrained. Because of the weak wind, we calculated all non-iron lines in the formal solution with a small microturbulence of .
From the C iv resonance doublet, only the red component seems to be reproduced by the same model. However, the feature apparently fitting the red C iv component is in fact due to iron. This is demonstrated in Fig. 8 by the thin, green dashed profile which is calculated with the iron forest switched off. Thus we must state that the model does not reproduce the C iv resonance doublet as a wind line at all. We found no escape from this discrepancy. A (much) larger mass-loss rate makes not only the Si iv resonance doublet too strong, but also transforms the C ii line at 1335 Å into a wind-line profile which is not observed. Reason for the missing C iv wind line is that models for such low predict that carbon recombines to C iii and C ii. We must conclude that also in this star some “superionization” keeps the ionization higher than predicted by our stationary models. As we will discuss below (5), frictional heating in this very thin wind may provide a viable mechanism.
Our “final model” and the mass-loss rate thus relies only on the Si iv resonance doublet, and should be taken with care. The “work ratio” is 0.41, i.e. not far from what is expected for a radiation-driven wind.
4.6 HD144941
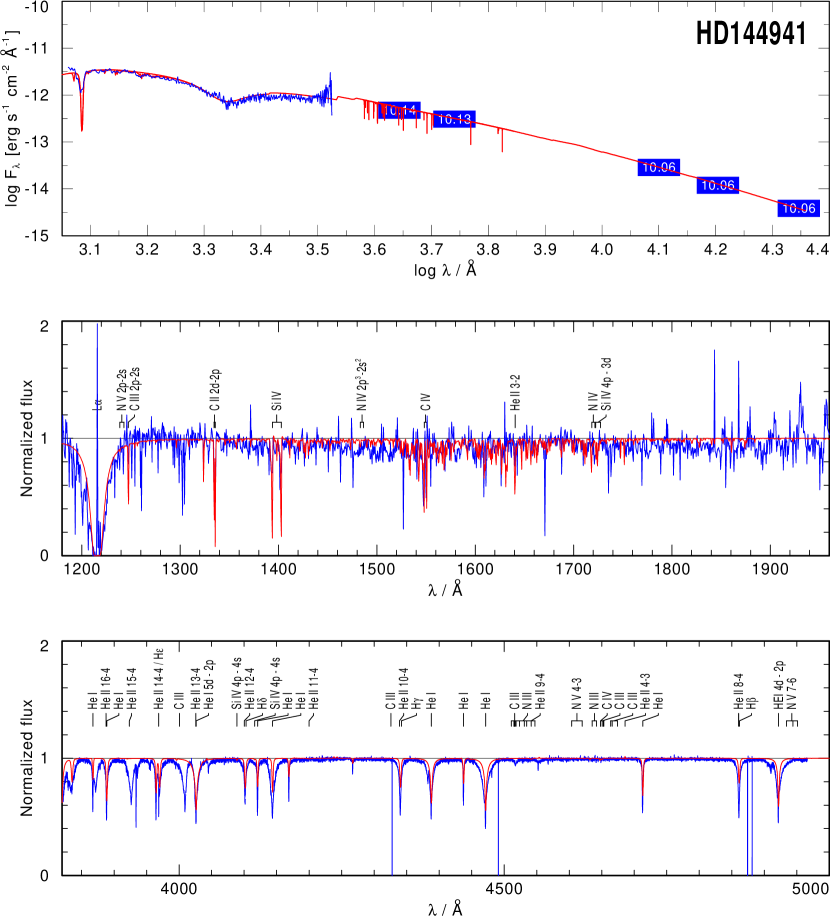
Previous photospheric analyses give quite discrepant effective temperatures for this star (see Table 2). From a detailed analysis of the optical line spectrum, Harrison & Jeffery (1997) derived . In contrast, Jeffery et al. (2001) obtained 27.8 kK from fitting the UV flux distribution. We adopt as a compromise, but take the gravity and derived luminosity from Harrison & Jeffery (1997). Some of the pressure-broadened He i lines appear too broad when compared to our model (see Fig. 16 in the Online Material).
The chemical abundances were also determined from the photospheric spectrum in previous work (Harrison & Jeffery, 1997). Comparison with our model (see Fig. 16 in the Online Material) gives the impression that the traces of hydrogen might have been under-estimated. The formal integral is calculated for the non-iron lines with a microturbulence of in the UV and in the optical.
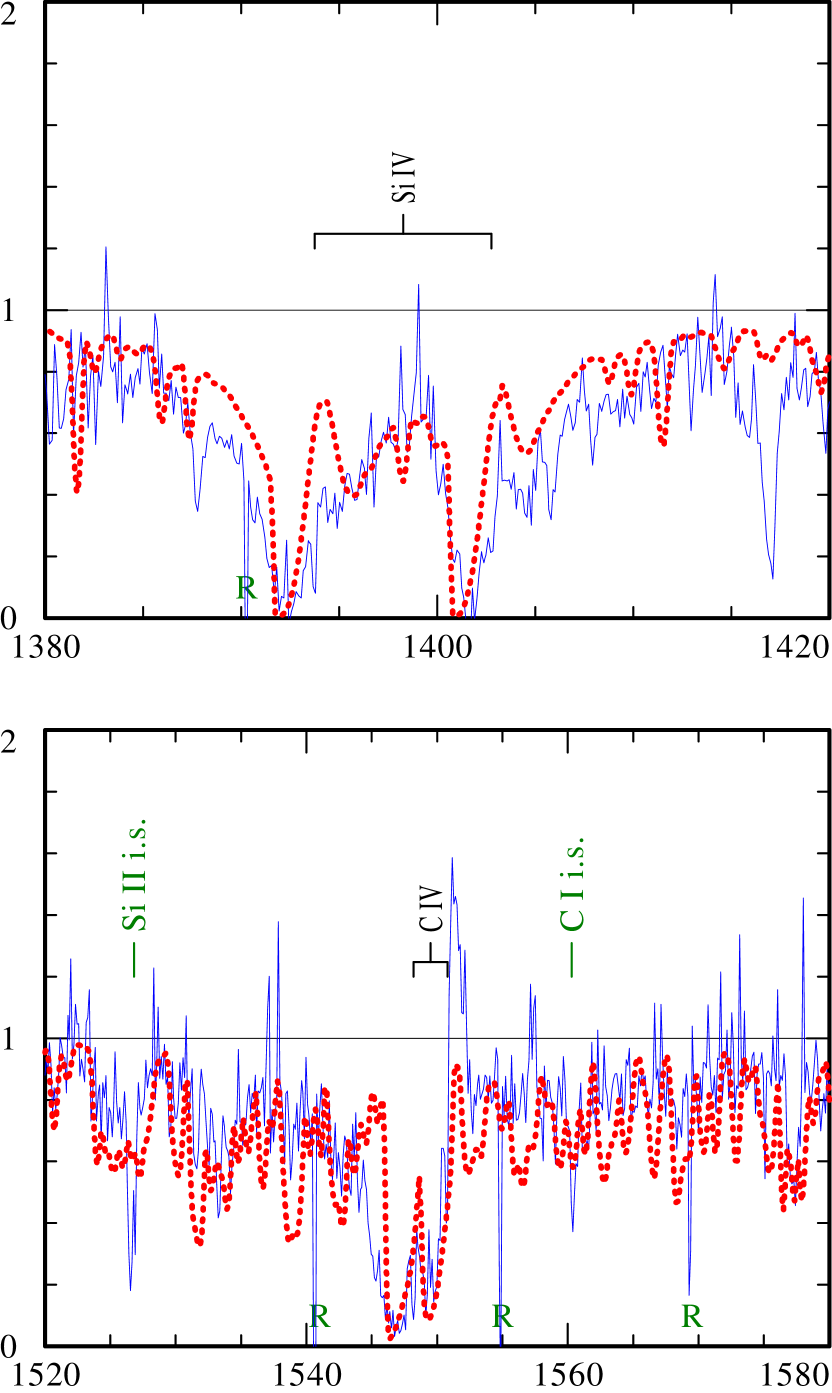
The spectral signatures of the stellar wind are seen in the UV resonance doublets of Si iv and C iv (see Fig. 9). In both cases, there are blueward extended absorption features accompanied by weak, red-shifted P-Cygni emissions. The reproduction of the wind profiles requires a terminal wind speed of about . The mass-loss rate of the final model (see Table 3) is a compromise, leaving the wind feature of the C iv doublet too weak.
For both resonance doublets, the model shows too strong photospheric absorption features at the rest wavelengths shining through the wind. In the case of Si iv this discrepancy was so strong that we felt the need to reduce the silicon abundance against the value from the literature (from 25 to 10 ppm mass fraction), but the unshifted features are still stronger than observed.
We also tested the lower effective temperature (23.2 kK) from Harrison & Jeffery (1997) for the wind-line fit. With these models, the problem with the too strong photospheric components almost disappears. However, is too low to produce the observed the C iv wind line in our radiative-equilibrium models. In this case, one would need to argue that C iv is due to some “superionization”, as in the case of N v in HD160641 and C iv in BD (see above).
These ambiguities make the derived mass-loss rate especially uncertain. The work ratio for the final model is only 0.2, possibly indicating that the mass-loss rate is over- or the luminosity under-estimated.
4.7 Wind variability
Many extreme helium stars are known to be intrinsically variable in both light and radial velocity on timescales of one to several days (Lynas-Gray et al., 1987; Jeffery & Heber, 1992). Repeat high-resolution spectra of HD160641 and BD were obtained with IUE on timescales of days and years. Jeffery & Heber (1992) found no evidence for variability of the wind lines in BD. Figure 10 shows the mean profile of two resonance lines with strong wind profiles in boths stars. It also shows the standard deviation of the individual observations around the mean. While there is a hint of increased scatter in the blue wing of some lines, it is no greater than seen in other nearby regions of spectrum. It is concluded that there is little firm evidence for any variation in the wind line profiles. In contrast, photospheric lines are known to show show strong profile variability (Jeffery & Heber, 1992; Wright et al., 2006).
5 Conclusion
The spectra of six extreme helium stars under investigation are found to indicate weak mass loss. This evidence comes from resonance lines in the UV, which show P Cygni profiles or at least asymmetric absoption features. The hotter two of our programme stars, with , exhibit wind profiles of the N iv and C iv resonance doublet, while the cooler stars () show these effects in Si iv and C iv.
By fitting these wind lines to model spectra, we have determined the mass-loss rates. The result depends inversely on the abundance of the respective element, which we have mostly taken from previous analyses of the photospheric spectra. Thus one must realize that, apart from the uncertainties of the fit, a possible error in the element abundance directly translates into a wrong mass-loss rate.
One should also be aware that the empirical mass-loss rate scales with the adopted distance to the star. The reason is that the resonance-line fits basically measure an optical depth which, in a homologuous scaling, depends on the density times the linear dimension. The density depends on , and therefore the optical depth scales as . For models with the same optical depth, we thus obtain and, since , a scaling .
Moreover, the fit relies on the ionization structure of the models calculated in radiative equilibrium. When the ion under consideration is abundant, this should be reliable. However, in some of the cooler stars carbon is mainly in the stages C ii and C iii. In such cases the traces of the observed C iv ion can be largely enhanced by additional ionization processes, such as that caused by hydrodynamic shocks in the stellar wind which emit radiation in the hard-UV and X-ray range. Such “superionization” is well known from the winds of massive hot stars. Mass-loss rates cannot be reliably derived from “superionized” lines.
Thus we warn that the mass-loss rates should be taken with care, although the error margin is impossible to quantify for the individual stars.
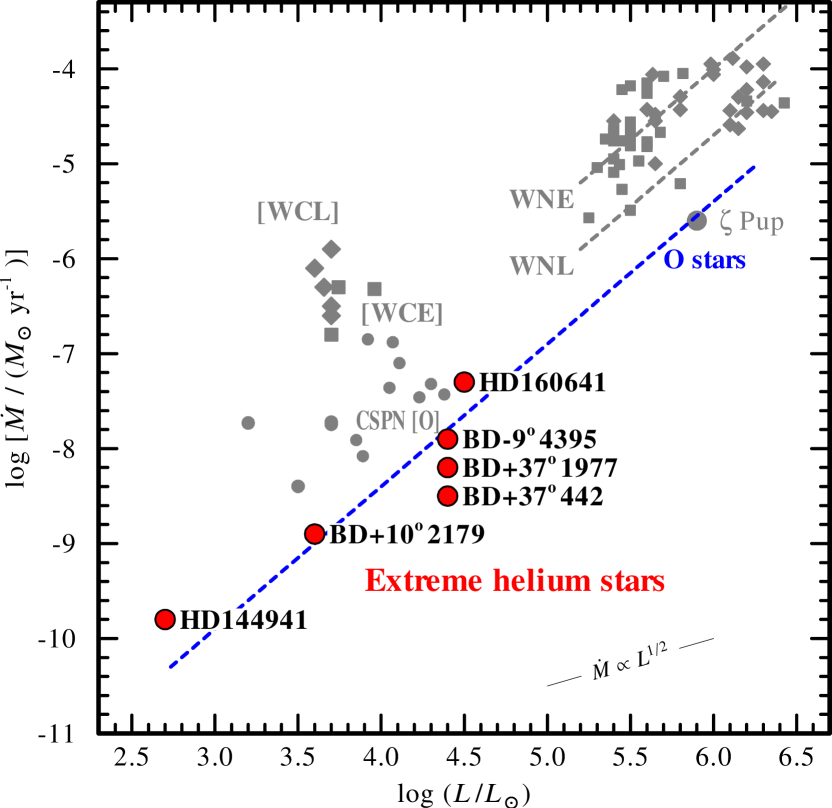
As a general result, stellar winds appear as a persistent feature of hot stars, irrespective of their wide range of luminosities, masses and chemical composition. In Fig. 11 we plot the empirical mass-loss rates over the stellar luminosity , both on a logarithmic scale. The theory of radiation-driven winds in its most elementary form (Castor et al., 1975) predicts a correlation of about , which roughly remains valid in later refinements of this prediction such as the “modified wind momentum – luminosity relationship” (see e.g. Puls et al., 2008). Fig. 11 reveals that this relation, represented by the blue dashed line normalized to the values for the massive O-type supergiant Puppis, indeed marks a kind of lower limit for the mass loss from hot stars of all kinds.
Our extreme helium stars lie close to this relation. Among the massive stars, the Wolf-Rayet types show considerably stronger mass loss. Similarly high are found for the early subtypes (WNE) and the late subtypes (WNL), but the latter ones have on the average higher luminosities.
Mass loss is also found from central stars of planetary nebulae (CSPN), which are hot stars of lower mass and less luminosity than the massive early-type stars. In their majority the CSPN are hydrogen rich (CSPN-[O]). Their mass-loss rates lie about one order of magnitude above the dashed --relation in Fig. 11. Extremely strong is the mass loss from the hydrogen deficient CSPN with Wolf-Rayet type spectra. According to detailed hydrodynamic modelling, the extremely strong mass loss from Wolf-Rayet stars is caused by their proximity to the Eddington limit, and driven by multiple line scattering (Gräfener & Hamann, 2008).
The proximity to the Eddington limit can be measured by the ratio between the inward force by gravitation and the outward force by radiation pressure, . Only accounting for the radiation pressure on free electrons by Thomson scattering, the Eddington follows from the effective temperature and the surface gravity as
| (1) |
where is in Kelvin and in cgs-units. For our stars we may set the number of free electrons per atomic mass unit to for fully ionized helium.
To evaluate , we must realize that the gravities given in Table 3 are spectroscopically determined from the pressure-broadening of lines, and thus are effective gravities . Taking this into account, we obtain the values compiled in Table 4. The correlation with the mass-loss rates is striking, especially within the group of four stars with nearly the same luminosity. The outstandingly high mass loss from HD160641 is thus a consequence of its low gravity.
| Star | |
|---|---|
| HD160641 | 0.55 |
| BD | 0.32 |
| BD | 0.17 |
| BD | 0.17 |
| BD | 0.10 |
| HD144941 | 0.03 |
This agreement with the expectations for radiation driven winds, also reflected by the plausible “work ratios” for the individual stars as mentioned in Sect. 4, may be considered an independent argument that the luminosities and distances are correct at least within an order of magnitude. Adopting a different luminosity would shift the empirical mass-loss rate parallel to the thin line with slope 1/2 indicated in the lower-right corner of Fig. 11.
It has been theoretically predicted that in very thin winds the radiation pressure will accelerate only the metal ions, while the bulk matter of helium stays inert. This ion decoupling will lead to frictional heating, or perhaps even to instabilities that completely disrupt the smooth stellar wind (Springmann & Pauldrach, 1992; Krtička & Kubát, 2001). Among our programme stars, the thinnest wind is encountered at BD. According to our final model, the number density at one stellar radius from the photosphere is about atoms per cubic centimeter. The mass-loss rate and radius of that star are almost identical to those of Sco, for which ion decoupling has been predicted. Hence we may speculate that the “superionization” invoked for C iv (Sect. 4.5) is caused by frictional heating from ion decoupling. The same may also hold for HD144941, the star with the second-thinnest wind ( at ). The consistent wind-line fits for the other programme stars provide evidence that ion decoupling does not take place in their winds.
Acknowledgments
This publication makes use of data products from the Two Micron All Sky Survey, which is a joint project of the University of Massachusetts and the Infrared Processing and Analysis Center/California Institute of Technology, funded by the National Aeronautics and Space Administration and the National Science Foundation.
Some of the data presented in this paper were obtained from the Multimission Archive at the Space Telescope Science Institute (MAST). STScI is operated by the Association of Universities for Research in Astronomy, Inc., under NASA contract NAS5-26555. Support for MAST for non-HST data is provided by the NASA Office of Space Science via grant NAG5-7584 and by other grants and contracts.
Based on INES data from the IUE satellite.
The Armagh Observatory is funded by direct grant from the Northern Ireland Dept of Culture Arts and Leisure.
References
- Aller (1954) Aller L. H., 1954, Memoires of the Societe Royale des Sciences de Liege, 1, 337
- Asplund et al. (2005) Asplund M., Grevesse N., Sauval A. J., 2005, in Barnes III T. G., Bash F. N., eds, Cosmic Abundances as Records of Stellar Evolution and Nucleosynthesis Vol. 336 of Astronomical Society of the Pacific Conference Series, The Solar Chemical Composition. p. 25
- Bartolini et al. (1982) Bartolini C., Bonifazi A., Fusi Pecci F., Oculi L., Piccioni A., Serra R., Dantona F., 1982, Ap&SS, 83, 287
- Bauer & Husfeld (1995) Bauer F., Husfeld D., 1995, A&A, 300, 481
- Cardelli et al. (1989) Cardelli J. A., Clayton G. C., Mathis J. S., 1989, ApJ, 345, 245
- Castor et al. (1975) Castor J. I., Abbott D. C., Klein R. I., 1975, ApJ, 195, 157
- Clayton et al. (2007) Clayton G. C., Geballe T. R., Herwig F., Fryer C., Asplund M., 2007, ApJ, 662, 1220
- Cowley (1971) Cowley C. R., 1971, The Observatory, 91, 139
- Darius et al. (1979) Darius J., Giddings J. R., Wilson R., 1979, in Willis A. J., ed., The first year of IUE; Proceedings of the Symposium, London, England, April 4-6, 1979. (A80-16301 04-90) London, University College Discovery of mass loss from hot subdwarfs. pp 363–370
- Dudley & Jeffery (1992) Dudley R. E., Jeffery C. S., 1992, in Heber U., Jeffery C. S., eds, The Atmospheres of Early-Type Stars Vol. 401 of Lecture Notes in Physics, Berlin Springer Verlag, Mass loss from upsilon Sgr and other helium stars. p. 298
- Giddings (1981) Giddings J. R., 1981, PhD thesis, University of London
- Gräfener & Hamann (2005) Gräfener G., Hamann W.-R., 2005, A&A, 432, 633
- Gräfener & Hamann (2008) Gräfener G., Hamann W.-R., 2008, A&A, 482, 945
- Griem et al. (1962) Griem H. R., Baranger M., Kolb A. C., Oertel G., 1962, Physical Review, 125, 177
- Hamann et al. (2008) Hamann W.-R., Feldmeier A., Oskinova L. M., eds, 2008, Clumping in hot-star winds
- Hamann & Gräfener (2004) Hamann W.-R., Gräfener G., 2004, A&A, 427, 697
- Hamann et al. (1982) Hamann W.-R., Schoenberner D., Heber U., 1982, A&A, 116, 273
- Harrison & Jeffery (1997) Harrison P. M., Jeffery C. S., 1997, A&A, 323, 177
- Heber (1983) Heber U., 1983, A&A, 118, 39
- Husfeld (1987) Husfeld D., 1987, in Philip A. G. D., Hayes D. S., Liebert J. W., eds, IAU Colloq. 95: Second Conference on Faint Blue Stars Non-LTE analyses of extremely helium-rich subluminous O stars. pp 237–246
- Iben & Tutukov (1984) Iben Jr. I., Tutukov A. V., 1984, ApJS, 54, 335
- Jeffery (1988) Jeffery C. S., 1988, MNRAS, 235, 1287
- Jeffery (2008) Jeffery C. S., 2008, in Werner A., Rauch T., eds, Hydrogen-Deficient Stars Vol. 391 of Astronomical Society of the Pacific Conference Series, Hydrogen-Deficient Stars: An Introduction. p. 3
- Jeffery & Harrison (1997) Jeffery C. S., Harrison P. M., 1997, A&A, 323, 393
- Jeffery & Heber (1992) Jeffery C. S., Heber U., 1992, A&A, 260, 133
- Jeffery et al. (1986) Jeffery C. S., Heber U., Hamann W. R., 1986, in Rolfe E. J., ed., New Insights in Astrophysics. Eight Years of UV Astronomy with IUE Vol. 263 of ESA Special Publication, Ultraviolet spectroscopy of the hydrogen-deficient star HD 144941: The energy distribution and the stellar wind. pp 369–372
- Jeffery et al. (2001) Jeffery C. S., Starling R. L. C., Hill P. W., Pollacco D., 2001, MNRAS, 321, 111
- Kondo et al. (1989) Kondo Y., Boggess A., Maran S. P., 1989, ARA&A, 27, 397
- Krtička & Kubát (2001) Krtička J., Kubát J., 2001, A&A, 369, 222
- Kudritzki et al. (1999) Kudritzki R. P., Puls J., Lennon D. J., Venn K. A., Reetz J., Najarro F., McCarthy J. K., Herrero A., 1999, A&A, 350, 970
- Lynas-Gray et al. (1987) Lynas-Gray A. E., Kilkenny D., Skillen I., Jeffery C. S., 1987, MNRAS, 227, 1073
- Marcolino et al. (2009) Marcolino W. L. F., Bouret J.-C., Martins F., Hillier D. J., Lanz T., Escolano C., 2009, A&A, 498, 837
- Oskinova et al. (2007) Oskinova L. M., Hamann W.-R., Feldmeier A., 2007, A&A, 476, 1331
- Pandey et al. (2006) Pandey G., Lambert D. L., Jeffery C. S., Rao N. K., 2006, ApJ, 638, 454
- Puls et al. (2008) Puls J., Vink J. S., Najarro F., 2008, A&A Rev., 16, 209
- Rauch (1996) Rauch T., 1996, in C. S. Jeffery & U. Heber ed., Hydrogen Deficient Stars Vol. 96 of Astronomical Society of the Pacific Conference Series, NLTE analysis of the extreme helium star HD 160641. pp 174–+
- Saio & Jeffery (1988) Saio H., Jeffery C. S., 1988, ApJ, 328, 714
- Saio & Jeffery (2002) Saio H., Jeffery C. S., 2002, MNRAS, 333, 121
- Schönberner (1986) Schönberner D., 1986, in Hunger K., Schoenberner D., Kameswara Rao N., eds, IAU Colloq. 87: Hydrogen Deficient Stars and Related Objects Vol. 128 of Astrophysics and Space Science Library, Evolutionary status and origin of extremely hydrogen-deficient stars. pp 471–480
- Schöning & Butler (1989a) Schöning T., Butler K., 1989a, A&AS, 79, 153
- Schöning & Butler (1989b) Schöning T., Butler K., 1989b, A&AS, 78, 51
- Schöning & Butler (1989c) Schöning T., Butler K., 1989c, A&A, 219, 326
- Springmann & Pauldrach (1992) Springmann U. W. E., Pauldrach A. W. A., 1992, A&A, 262, 515
- Vidal et al. (1973) Vidal C. R., Cooper J., Smith E. W., 1973, ApJS, 25, 37
- Webbink (1984) Webbink R. F., 1984, ApJ, 277, 355
- Wolff et al. (1974) Wolff S. C., Pilachowski C. A., Wolstencroft R. D., 1974, ApJ, 194, L83
- Wright et al. (2006) Wright D. J., Lynas-Gray A. E., Kilkenny D., Cottrell P. L., Shobbrook R. R., Koen C., van Wyk F. W., Kilmartin P. M., Martinez P., Gilmore A. C., 2006, MNRAS, 369, 2049
Online Material