Probing thermal expansion of graphene and modal dispersion at low-temperature using graphene NEMS resonators
Abstract
We use suspended graphene electromechanical resonators to study the variation of resonant frequency as a function of temperature. Measuring the change in frequency resulting from a change in tension, from 300 K to 30 K, allows us to extract information about the thermal expansion of monolayer graphene as a function of temperature, which is critical for strain engineering applications. We find that thermal expansion of graphene is negative for all temperatures between 300K and 30K. We also study the dispersion, the variation of resonant frequency with DC gate voltage, of the electromechanical modes and find considerable tunability of resonant frequency, desirable for applications like mass sensing and RF signal processing at room temperature. With lowering of temperature, we find that the positively dispersing electromechanical modes evolve to negatively dispersing ones. We quantitatively explain this crossover and discuss optimal electromechanical properties that are desirable for temperature compensated sensors.
pacs:
85.85.+j, 81.05.ue, 65.40.De, 65.60.+a1 Introduction
Electronic properties of graphene have been studied extensively [1, 2] since the first experiments probing quantum Hall effect [3, 4]. In addition to the electronic properties, the remarkable mechanical properties of graphene include a high in-plane Young’s modulus of 1 TPa probed using nanoindentation of suspended graphene[5], force extension measurements [6], and electromechanical resonators [7, 8, 9]. NEMS (nano electromechanical systems) devices using nanostructures like carbon nanotubes [10, 11, 12, 13, 14, 15, 16], nanowires [17] [18] and bulk micromachined structures [19, 20, 21] offer promise of new applications and allow us to probe fundamental properties at the nanoscale. NEMS [22] based devices are ideal platforms to harness the unique mechanical properties of graphene. Electromechanical measurements with graphene resonators [7, 8] suggest that with improvement of quality factor (), graphene based NEMS devices have the potential to be very sensitive detectors of mass and charge. Additionally, the sensitivity of graphene to chemical specific processes [23] offers the possibility of integrated mass and chemical detection. The large surface-to-mass ratio of graphene offers a distinct advantage over other nanostructures for such applications. In order to better understand the potential of graphene based electrically actuated and detected resonators [8] and the challenges in realizing strain-engineered graphene devices [24, 25], we experimentally measure the coefficient of thermal expansion of graphene () as a function of temperature. Our measurements indicate for 30 K 300K and larger in magnitude than theoretical prediction [26]. We also probe the dispersion, or the tunability, of mechanical modes using the DC gate voltage at low temperatures and find that the thermal expansion of graphene, built-in tension and added mass play an important role in changing the extent of tunability of the resonators [27] and the resonant frequency – parameters that are critical for various applications. Additionally, measuring temperature dependent mechanical properties [28] of suspended structures down to low temperatures will give insight into strain engineering of graphene based devices [24, 25] and also help in understanding the role of rippling in degrading carrier mobility at low temperatures. Our experiments probe these issues in detail and suggest that monitoring the resonant frequency as a function of temperature could provide important information about nanoscale stress that is useful for probing phase transition.
2 Experimental details
2.1 Device fabrication
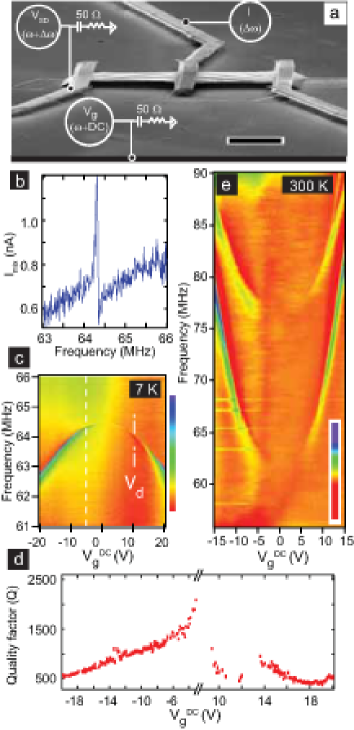
To fabricate monolayer graphene electromechanical resonators, we suspended graphene devices using the previously reported [29, 30, 31, 8] process which starts with micromechanical exfoliation of graphene from graphite crystal using an adhesive tape on a 300 m thick degenerately doped silicon wafer coated with 300 nm thick thermally grown SiO2. Following the location of monolayer graphene flakes using optical microscopy, electron beam lithography is used to pattern resist for fabricating electrodes for electrical contact. The electrodes are fabricated by evaporation of 10 nm of chromium and 60 nm of gold following patterning of resist. To release the graphene from the SiO2 substrate, a dilute buffered-HF solution is used to selectively etch an area around the graphene device by masking the rest of the substrate using polymer resist. Following an etch for 5 min 30 sec that results in a 170 nm deep trench in SiO2, the device is rinsed in DI water and isopropanol. Critical point drying, to prevent collapse of the device due to surface tension, is the final step in fabrication of suspended graphene devices. A scanning electron microscope (SEM) image of a suspended graphene device is shown in Figure 1a.
2.2 Measurement scheme
The electrical actuation and detection is done by using the suspended graphene device as heterodyne-mixer [8, 10, 32]. The scheme for electrical actuation and detection is also shown in Figure 1a superimposed on the SEM image of the device. We use electrostatic interaction between the graphene membrane and the back-gate electrode to actuate the motion in a plane perpendicular to the substrate. A radio frequency (RF) signal and a DC voltage are applied at the gate terminal using a bias-tee. Another RF signal is applied to the source electrode Figure 1a. RF signal applied at the gate modulates the gap between graphene and substrate at frequency , and alters the overall tension and carrier density in the membrane. The amplitude of the current through the graphene membrane at the difference frequency (), also called the mixing current , can be written as [8, 10, 16, 33, 34]
| (1) |
where is the conductance of the graphene device, is the charge induced by the gate voltage, is the capacitance between the gate electrode and graphene, is the amplitude of oscillation at the driving frequency along the -axis (perpendicular to the substrate). The difference frequency signal (at ) arises from the product of the modulation signals of and . At the mechanical resonance of the membrane, the first term in Equation 1 contributes significantly and the second term which does not depend on the mechanical motion of the graphene membrane provides a smooth background.
2.3 Results and discussions
Figure 1b shows the result of such a measurement at 7K for a suspended graphene device (D1) while is set at -5V. Using a Lorentzian lineshape for the resonance curve, [10, 35] we can extract the of the resonator (variation of with temperature is shown in supplementary information). Figure 1c shows the colorscale plot of as a function of and at 7 K. The resonant frequency is lowered as the magnitude of is increased - mechanical mode disperses negatively with . This is well understood in terms of mode-softening due to the capacitive contribution to the energy of resonator [36, 18]. The Dirac peak for our device is shifted () from the expected position (0 V) due to unintentional doping during the fabrication process 111A shift in the Dirac peak away from is desirable in our experiments because the actuation efficiency is feeble at and that would make the observation of physics near the Dirac point inaccessible for electromechanical measurements.. Also seen in Figure 1c is the information regarding the amplitude of the mixing current. The overall amplitude of the mixing current at resonance scales with (first term in Equation 1) and as a result the amplitude of the mixing current is very small near . However, at V, the amplitude of the mixing changes abruptly due to the Dirac peak () [3, 4]. At this point, the term appearing in Equation 1 becomes zero. Figure 1d shows the quality factor () dependance on calculated from the data shown in Figure 1c. The quality factor of the device is largest around and decreases as the gate voltage is swept away from zero. Also, at low temperatures, decreases with the increase in and follows a similar trend. As negative dispersion – caused by softening of spring constant – is accompanied by the movement of graphene towards the gate electrode, it leads to an increase in the modulated capacitance and results in larger dissipative current [36]. In the neighborhood of , is smaller than the value expected from the trend from higher side. One possible reason for this behavior might be that in the vicinity of the Dirac point, large device resistance leads to increased ohmic losses [35]. An additional mechanism that can result in dissipation is the mechanical deformation modifying the distribution of charge puddles of electrons and holes in the graphene sheet. These phenomena warrant further detailed investigation [37, 38]. Such a measurement could be used to study charge inhomogeneity. Figure 1e shows similar measurement for a device (D2) at 300K. Here, we observe two mechanical modes which disperse positively because of the increase in tension in the graphene membrane due to the electrostatic attraction from the back-gate. Most of our graphene devices exhibit an in-built tensile stress at 300K due to the fabrication process. Multiple ripples on the membrane are also seen in Figure 1a [28]. To better understand the modal dispersion quantitatively, we model the graphene membranes within the elastic continuum regime and in a limit where tension in the membrane dominates over the flexural rigidity [5, 7, 39]. As a result, the resonant frequency of the graphene membrane can be written as
| (2) |
where is the length of the membrane, is the width, is the thickness, is the mass density, is the in-built tension and is the tension at a given temperature and . The functional form of is dependent on the details of the model used to take into account the electrostatic and elastic energies. (Our model is described in detail in the supplementary information.) Resonant frequency at zero gate voltage is given by ; therefore, from an independent estimation of and is not possible. However, resonant frequency dispersion with gate voltage allows us to estimate and simultaneously. Using fits based on the continuum model (calculations described in supplementary information) we estimated the mass density and the in-built tension to be nN for the fundamental mode, where is the mass density of pristine graphene for the device data shown in Figure 1e. We attribute this extra mass and in-built tension to the resist residue that can get deposited on the graphene membrane during the fabrication process and these values of mass density are similar to ones reported by Chen et al. [8]. We note that the dispersion of the two modes shown in the Figure 1e is different and our modal calculations give and nN for the upper mode. However, the simple model of a rectangular membrane predicts higher order modes at much higher frequencies – this is a limitation of the simple assumptions we have made. The presence of other resonant modes at small intervals of frequency seen in Figure 1e (also seen in Figure 4a) indicates a deviation from this simplified picture of membrane under tension due to either edge-modes [9], or due to the rippling/curling of the membrane [28, 40]. In the later part of this report, we discuss in detail the reasons for positive or negatively dispersing modes and temperature induced change in dispersion.
3 Probing thermal expansion of graphene
We now consider how the resonant frequency () evolves as a function of the temperature. Figure 2a shows the result of an evolution of a mode as a function of temperature at V 222Data acquisition was done during a single sweep over twelve hours to allow the resonator to equilibrate and the window of acquisition window automatically adjusted to follow the resonance.. The resonant frequency increases as the device is cooled from room temperature. This increase has been seen in all the devices we have studied.
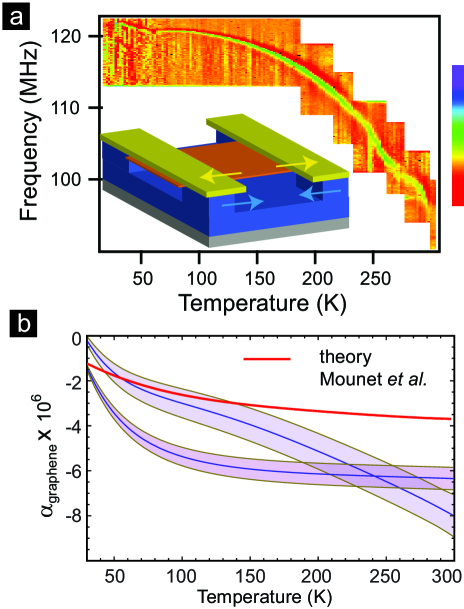
The degree of frequency shift varies from one device to another depending on the device geometry. The origin of this frequency shift with temperature is the increase in tension in graphene due to the expansion/contraction of substrate, gold electrodes and graphene. The frequency shift can be understood by taking into account the contribution of various strains as the device is cooled below 300 K. The three main contributions are – firstly, the thermal strain in unconstrained graphene 333All through this report we measure the strain relative to the strain at room temperature (300 K). due to the coefficient of thermal expansion of graphene , second, the thermal strain due to the gold electrodes and lastly the contribution of the strain induced by the substrate ; here is the coefficient of thermal expansion for gold [41]. The strain in gold electrodes plays an important role due to the geometry of the device. The under-etch that releases the graphene membrane also etches under the graphene covered by the electrodes – resulting in the graphene membrane being suspended off the gold electrodes [8] (see supplementary information for SEM image). The geometry of the resulting device is shown in the inset to Figure 2a. The elastic strain in the curved substrate can be calculated using Stoney’s equation [42]. Its contribution to the net strain in the graphene membrane is very small (see supplementary information) and therefore upon cooling, change of tension in the graphene is due to contraction of gold electrode and expansion/contraction of graphene. We assume that Young’s modulus of graphene does not vary significantly over the temperature range [43]. At the interface of gold electrodes supporting the graphene membrane, the net force must balance to zero; however, the stresses are different considering the crossectional area of gold electrodes (500nm 60nm) and graphene (500nm 0.3nm). The large difference in the cross-sectional area implies that the effective stiffness of gold electrodes is large compared to the stiffness of graphene. As a result, to a very good approximation, the total elastic strain at a given temperature in graphene that is confined by “rigid” gold electrodes is , where is the average of the width of gold electrodes holding the suspended flake. The change in tension in the membrane can be written as a function of temperature as , where is Young’s modulus of graphene. Measuring the tension as a function of temperature offers a way to track the thermal strain in graphene membrane. Figure 2a shows the evolution of resonant frequency as a function of temperature from a device (D2) at V where the increase in frequency is largely due to the contraction of the gold electrodes. However, this rate of increase of resonant frequency is significantly reduced due to the negative for all T K from the case of frequency change including only gold’s contraction. Using such a measurement of frequency shift while assuming uniform expansion of all the materials and using Equation 2, it is possible to calculate the expansion coefficient from the frequency at V as
| (3) |
Figure 2b shows the result of calculating for two devices using this analysis and comparison with the theoretical calculation for by N. Mounet et al. [26] . We find that is negative and its magnitude decreases with temperature for T K. At room temperature, , which is similar to the previously reported values measured by others [8, 28]. At 30 K, . The deviation of from the theoretically predicted values can possibly be due to the presence of the impurities on graphene membrane. The knowledge of is essential for the fabrication of the devices intended for strain engineering applications [24, 25]. Strain engineering of graphene devices at low-temperatures using this picture can improve device performance, for example by enabling temperature compensation [44]. A simple design rule for width of electrodes to achieve temperature compensation in the vicinity of a temperature is to ensure that the (using equation 3). Additionally, these measurements indicate that using NEMS resonators for measuring internal stress of nanowires of metal and phase change materials as a function of temperature, using phase locked loop (PLL) technique [21], can provide useful information about stresses and strains in individual nanostructures.
Here, it is important to point out that, residue on the graphene sheet can also affect the calculations of the coefficient of thermal expansion. This can possibly be one reason for its deviation from the theoretically predicted values. In our calculation, we have assumed that presence of residue does not affect the expansion of graphene, which may not be the complete description of the experimental system. However, these values of still remain valuable for device engineering as the complete elimination of the resist residue from the device is difficult.
4 Modal dispersion of graphene NEM resonator
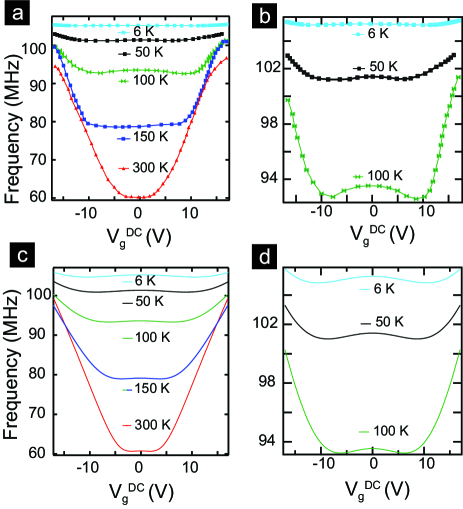
We next consider the dispersion of the resonant modes with temperature. Figure 3a shows the dispersion of resonant mode for a device(D3) at various temperatures down to 6K. Upon cooling, the resonant frequency increases and its tunability using gate voltage is reduced, an undesirable feature. Further, at low temperatures, resonance frequency first decreases with and then it increases (Similar evolution of modal dispersion with has been observed by Chen et al. [8].). We now try to understand the evolution of the modal dispersion as a function of temperature.
The two limiting cases of modal dispersion – pure positively and negatively dispersing modes can be respectively understood by considering the limits where the tension (or in the case of flexural modes mechanical rigidity) dominates with increasing and the case when capacitive pulling leading to the softening of the spring constant dominates [36, 18, 35]. A simple model [18] to understand the intermediate regime where these two interactions compete is to model the resonator with an intrinsic spring constant with and as constants of the system (when , this is consistent with the positive dispersion of modes with an increased ). A second contribution due to the electrostatic interaction (capacitive coupling), softens the intrinsic spring constant so that the effective spring constant
| (4) |
with being the capacitive coupling of the membrane with gate electrode. As is varied the varies and the modal dispersion changes from a negatively dispersing mode to a positively dispersing mode at large – the value of at which the crossover happens is a measure of the relative contribution of capacitive and elastic energies. This phenomenological model describes the generalized modal dispersion and can be connected to the properties of the resonator (described in supplementary information). and depend on temperature through the coefficient of thermal expansion, and also on the elastic constant of graphene; as a result they change with temperature, leading to the evolution of modal dispersion as a function of temperature. Additionally the capacitive contribution to energy is expected to change as a function of temperature. The observed modal dispersion behavior at all temperature can be qualitatively understood from the contraction of the suspended gold electrodes with temperature, which leads to increased tension in the membrane. This increase in in-built tension is accompanied by the reduction in tunability with (model described in the the supplementary information). Results of our calculation (Figure 3c) clearly show that we can successfully model the temperature evolution of dispersion, using only a single fit parameter in our model. It is critical to understand the origin of observed dispersion of resonant frequency as a function of temperature due to the desirable property of resonator – its tunability. Additionally, if the loss mechanisms are frequency independent such tunability can increase the of the system [35].
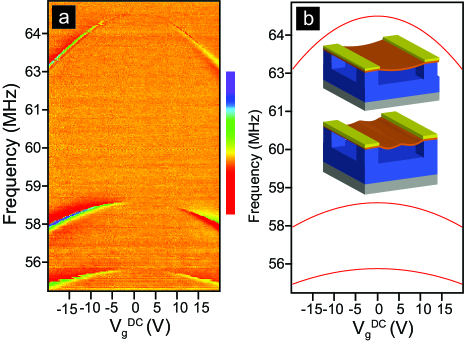
In order to use graphene electromechanical resonators for applications like mass and charge sensing it is important to understand the microscopic origin of the modes and to test the suitability of continuum models [7, 8, 39] beyond basic properties such as dispersion. Scanned probe measurements to image modes [9] indicate that the origin of these modes is complex – for instance some of the modes are associated with the edges of the graphene membrane. The reason this is critical is that the notion of effective mass of mechanical modes [22, 45] is associated with the spatial distribution of the mode 444The effective mass of a mode is dependent on the mode in flexural oscillations. For the case of string under tension the is independent of the mode [45].. We try to understand the nature of modes in graphene resonators by studying devices with multiple resonances in the measurement frequency window. Figure 4a shows two higher order modes along with fundamental mode for a graphene resonator at 7 K. The dispersions of these three modes are different. Though it is difficult to determine the exact nature of these modes using our technique, a semi-quantitative explanation is provided here. At lower temperatures, negative dispersion can be understood in terms of spring constant softening as discussed earlier. Following Equation 4, the effective spring constant can be used to calculate the modal dispersion with gate voltage (),
| (5) |
Using Equation 5, we can describe the higher modes also by using and modal mass () as the fitting parameters. For a sheet under tension with uniform loading, the effective modal mass () for different modes does not change, unlike the case of flexural modes, and is equal to [45]. However, our fitting gives different effective masses for different modes, which is expected as these are not the higher order harmonics of the fundamental mode (in the model described above, the higher order modes will be integral multiples of the fundamental mode). This suggests that the simple picture of rectangular membrane under tension within the continuum description does not work well to describe the system. This could be due to four main reasons: a) non-uniform loading of the membrane (due to resist residue) [8] can modify the for different modes, b) due to the presence of edge dependent modes [9], c) due to the curvature of membrane [40] or rippling of graphene [28] (as seen in Figure 1a) the effective stiffness of the modes could be a very complex quantity with a tensor nature and could be significantly different from the ideal value of 1 TPa as observed for the case of rippled carbon nanotubes [46, 47, 48] and d) the capacitance to gate () for the graphene membrane is likely to be mode dependent. Further experiments with pristine unrippled graphene resonators are needed to clarify our understanding of the microscopic origin of modes. The presence of multiple closely spaced modes can be potentially useful for mass spectrometry as the position of the added mass can be extracted accurately [49].
5 Conclusions
To conclude, our measurements of , for graphene resonators, as a function of DC gate voltage indicate that larger dissipation in the resonator can occur around the Dirac point. Using these NEMS devices measurement of coefficient of thermal expansion of graphene at low temperatures is possible. Our measurements indicate that is negative for all temperatures between 300 K and 30 K and larger in magnitude than the numbers predicted by theoretical calculations [26]; this could be critical in designing strain engineered devices using graphene [24, 25]. Additionally, the modal dispersion of graphene resonators is affected by the thermal expansion of graphene reducing the tunability. The continuum description of the mechanics of rectangular graphene membrane is inadequate for explaining the resonances due to the presence of non-uniform impurities and rippling of the membrane.
References
References
- [1] A. H. Castro Neto, F. Guinea, N. M. R. Peres, K. S. Novoselov, and A. K. Geim. The electronic properties of graphene. Reviews of Modern Physics, 81(1):109–154, 2009.
- [2] A. K. Geim. Graphene: Status and prospects. Science, 324(5934):1530–1534, 2009.
- [3] Yuanbo Zhang, Yan-Wen Tan, Horst L. Stormer, and Philip Kim. Experimental observation of the quantum hall effect and berry’s phase in graphene. Nature, 438(7065):201–204, 2005.
- [4] K. S. Novoselov, A. K. Geim, S. V. Morozov, D. Jiang, M. I. Katsnelson, I. V. Grigorieva, S. V. Dubonos, and A. A. Firsov. Two-dimensional gas of massless dirac fermions in graphene. Nature, 438(7065):197–200, 2005.
- [5] Changgu Lee, Xiaoding Wei, Jeffrey W. Kysar, and James Hone. Measurement of the elastic properties and intrinsic strength of monolayer graphene. Science, 321(5887):385–388, 2008.
- [6] Cristina Gomez-Navarro, Marko Burghard, and Klaus Kern. Elastic properties of chemically derived single graphene sheets. Nano Letters, 8(7):2045–2049, 2008.
- [7] J. Scott Bunch, Arend M. van der Zande, Scott S. Verbridge, Ian W. Frank, David M. Tanenbaum, Jeevak M. Parpia, Harold G. Craighead, and Paul L. McEuen. Electromechanical resonators from graphene sheets. Science, 315(5811):490–493, 2007.
- [8] Changyao Chen, Sami Rosenblatt, Kirill I. Bolotin, William Kalb, Philip Kim, Ioannis Kymissis, Horst L. Stormer, Tony F. Heinz, and James Hone. Performance of monolayer graphene nanomechanical resonators with electrical readout. Nat Nano, advance online publication, 2009.
- [9] D. Garcia-Sanchez, A. M. van der Zande, A. San Paulo, B. Lassagne, P. L. McEuen, and A. Bachtold. Imaging mechanical vibrations in suspended graphene sheets. Nano Letters, 8(5):1399–1403, 2008.
- [10] Vera Sazonova, Yuval Yaish, Hande Ustunel, David Roundy, Tomas A. Arias, and Paul L. McEuen. A tunable carbon nanotube electromechanical oscillator. Nature, 431(7006):284–287, 2004.
- [11] Andreas K. Huttel, Gary A. Steele, Benoit Witkamp, Menno Poot, Leo P. Kouwenhoven, and Herre S. J. van der Zant. Carbon nanotubes as ultrahigh quality factor mechanical resonators. Nano Letters, 9(7):2547–2552, 2009.
- [12] G. A. Steele, A. K. Huttel, B. Witkamp, M. Poot, H. B. Meerwaldt, L. P. Kouwenhoven, and H. S. J. van der Zant. Strong coupling between single-electron tunneling and nanomechanical motion. Science, 325(5944):1103–1107, 2009.
- [13] Benjamin Lassagne, Yury Tarakanov, Jari Kinaret, Daniel Garcia-Sanchez, and Adrian Bachtold. Coupling mechanics to charge transport in carbon nanotube mechanical resonators. Science, 325(5944):1107–1110, 2009.
- [14] K. Jensen, Kwanpyo Kim, and A. Zettl. An atomic-resolution nanomechanical mass sensor. Nat Nano, 3(9):533–537, 2008.
- [15] B. Lassagne, D. Garcia-Sanchez, A. Aguasca, and A. Bachtold. Ultrasensitive mass sensing with a nanotube electromechanical resonator. Nano Letters, 8(11):3735–3738, 2008.
- [16] Hsin-Ying Chiu, Peter Hung, Henk W. Ch Postma, and Marc Bockrath. Atomic-scale mass sensing using carbon nanotube resonators. Nano Letters, 8(12):4342–4346, 2008.
- [17] X. L. Feng, Rongrui He, Peidong Yang, and M. L. Roukes. Very high frequency silicon nanowire electromechanical resonators. Nano Letters, 7(7):1953–1959, 2007.
- [18] Hari S. Solanki, Shamashis Sengupta, Sajal Dhara, Vibhor Singh, Rohan Dhall, Sunil Patil, Jeevak Parpia, Arnab Bhattacharya, and Mandar M. Deshmukh. Tuning mechanical modes and infuence of charge screening in nanowire resonators. submitted, 2009.
- [19] Dustin W. Carr, S. Evoy, L. Sekaric, H. G. Craighead, and J. M. Parpia. Measurement of mechanical resonance and losses in nanometer scale silicon wires. Applied Physics Letters, 75(7):920–922, 1999.
- [20] Quirin P. Unterreithmeier, Eva M. Weig, and Jorg P. Kotthaus. Universal transduction scheme for nanomechanical systems based on dielectric forces. Nature, 458(7241):1001–1004, 2009.
- [21] A. K. Naik, M. S. Hanay, W. K. Hiebert, X. L. Feng, and M. L. Roukes. Towards single-molecule nanomechanical mass spectrometry. Nat Nano, 4(7):445–450, 2009.
- [22] K. L. Ekinci and M. L. Roukes. Nanoelectromechanical systems. Review of Scientific Instruments, 76(6):061101–061112, 2005.
- [23] F. Schedin, A. K. Geim, S. V. Morozov, E. W. Hill, P. Blake, M. I. Katsnelson, and K. S. Novoselov. Detection of individual gas molecules adsorbed on graphene. Nat Mater, 6(9):652–655, 2007.
- [24] Vitor M. Pereira and A. H. Castro Neto. Strain engineering of graphene’s electronic structure. Physical Review Letters, 103(4):046801–046804, 2009.
- [25] F. Guinea, M. I. Katsnelson, and A. K. Geim. Energy gaps and a zero-field quantum hall effect in graphene by strain engineering. Nat Phys, advance online publication, 2009.
- [26] Nicolas Mounet and Nicola Marzari. First-principles determination of the structural, vibrational and thermodynamic properties of diamond, graphite, and derivatives. Physical Review B, 71(20):205214, 2005.
- [27] C. T. C. Nguyen, Wong Ark-Chew, and Ding Hao. Tunable, switchable, high-q vhf microelectromechanical bandpass filters. In Solid-State Circuits Conference, 1999. Digest of Technical Papers. ISSCC. 1999 IEEE International, pages 78–79, 1999.
- [28] Wenzhong Bao, Feng Miao, Zhen Chen, Hang Zhang, Wanyoung Jang, Chris Dames, and Chun Ning Lau. Controlled ripple texturing of suspended graphene and ultrathin graphite membranes. Nat Nano, advance online publication, 2009.
- [29] Xu Du, Ivan Skachko, Anthony Barker, and Eva Y. Andrei. Approaching ballistic transport in suspended graphene. Nat Nano, 3(8):491–495, 2008.
- [30] K. I. Bolotin, K. J. Sikes, Z. Jiang, M. Klima, G. Fudenberg, J. Hone, P. Kim, and H. L. Stormer. Ultrahigh electron mobility in suspended graphene. Solid State Communications, 146(9-10):351–355, 2008.
- [31] K. I. Bolotin, K. J. Sikes, J. Hone, H. L. Stormer, and P. Kim. Temperature-dependent transport in suspended graphene. Physical Review Letters, 101(9):096802–096804, 2008.
- [32] B. Lassagne, D. Garcia-Sanchez, A. Aguasca, and A. Bachtold. Ultrasensitive mass sensing with a nanotube electromechanical resonator. Nano Letters, 8(11):3735–3738, 2008.
- [33] R. Knobel, C. S. Yung, and A. N. Cleland. Single-electron transistor as a radio-frequency mixer. Applied Physics Letters, 81(3):532–534, 2002.
- [34] Rongrui He, X. L. Feng, M. L. Roukes, and Peidong Yang. Self-transducing silicon nanowire electromechanical systems at room temperature. Nano Letters, 8(6):1756–1761, 2008.
- [35] Vera Sazonova. A tunable carbon nanotube resonator. PhD thesis, Cornell University, 2006.
- [36] I. Kozinsky, H. W. Ch Postma, I. Bargatin, and M. L. Roukes. Tuning nonlinearity, dynamic range, and frequency of nanomechanical resonators. Applied Physics Letters, 88(25):253101–253103, 2006.
- [37] J. Martin, N. Akerman, G. Ulbricht, T. Lohmann, J. H. Smet, K. von Klitzing, and A. Yacoby. Observation of electron-hole puddles in graphene using a scanning single-electron transistor. Nat Phys, 4(2):144–148, 2008.
- [38] Yuanbo Zhang, Victor W. Brar, Caglar Girit, Alex Zettl, and Michael F. Crommie. Origin of spatial charge inhomogeneity in graphene. Nat Phys, 5(10):722–726, 2009.
- [39] Juan Atalaya, Andreas Isacsson, and Jari M. Kinaret. Continuum elastic modeling of graphene resonators. Nano Letters, 8(12):4196–4200, 2008.
- [40] Shriram Shivaraman, Robert A. Barton, Xun Yu, Jonathan Alden, Lihong Herman, M. V. S. Chandrashekhar, Jiwoong Park, Paul L. McEuen, Jeevak M. Parpia, Harold G. Craighead, and Michael G. Spencer. Free-standing epitaxial graphene. Nano Letters, 9(9):3100–3105, 2009.
- [41] F. C. Nix and D. MacNair. The thermal expansion of pure metals: Copper, gold, aluminum, nickel, and iron. Physical Review, 60(8):597, 1941.
- [42] L. B. Freund and S. Suresh, editors. Thin Film Materials. Cambridge University Press, 2003.
- [43] Jin-Wu Jiang, Jian-Sheng Wang, and Baowen Li. Young’s modulus of graphene: A molecular dynamics study. Physical Review B (Condensed Matter and Materials Physics), 80(11):113405–113404, 2009.
- [44] G. K. Ho, K. Sundaresan, S. Pourkamali, and F. Ayazi. Low-motional-impedance highly-tunable i2 resonators for temperature-compensated reference oscillators. In Micro Electro Mechanical Systems, 2005. MEMS 2005. 18th IEEE International Conference on, pages 116–120, 2005.
- [45] D.M. Karabacak. Resonant Operation of Nanoelectromechanical Systems in Fluidic Environments. PhD thesis, Boston University, 2007.
- [46] Philippe Poncharal, Z. L. Wang, Daniel Ugarte, and Walt A. de Heer. Electrostatic deflections and electromechanical resonances of carbon nanotubes. Science, 283(5407):1513–1516, 1999.
- [47] M. Arroyo and T. Belytschko. Nonlinear mechanical response and rippling of thick multiwalled carbon nanotubes. Physical Review Letters, 91(21):215505, 2003.
- [48] Jefferson Z. Liu, Quanshui Zheng, and Qing Jiang. Effect of a rippling mode on resonances of carbon nanotubes. Physical Review Letters, 86(21):4843, 2001.
- [49] S. Dohn, W. Svendsen, A. Boisen, and O. Hansen. Mass and position determination of attached particles on cantilever based mass sensors. Review of Scientific Instruments, 78(10):103303–103303, 2007.