Structural and magnetic transition in CeFeAsO: separated or connected
Abstract
Using an adapted Sn-flux growth technique we obtained comparatively large CeFeAsO single crystals of better quality than previously reported polycrystals or single crystals, as evidenced by much sharper anomalies at the structural and magnetic phase transitions as well as a much higher residual resistivity ratio of 12. In the magnetically ordered phase we observe a very pronounced metallic behavior of the in-plane resistivity, which excludes a Mott insulator regime at low temperature. The separation between structural and magnetic ordering temperatures decreases with increasing sample quality, from 18 K in the initial reports to 6 K in the present single crystals, demonstrating that this separation is not an intrinsic property of the RFeAsO systems. Our results indicate that the coupling between magnetic ordering and structural distortion is very similar in AFe2As2 and RFeAsO type of compounds, much more similar than previously thought. The implications of our experimental results give arguments both in favor and against the nematic phase model.
pacs:
65.40.Ba, 74.62.Bf, 72.15.Eb, 65.40.DeI Introduction
The discovery of superconductivity with K in fluorine doped LaFeAsO Kamihara et al. (2008) caused enormous interest in this class of materials and led to the discovery of superconductivity in several other layered iron-pnictide compounds.Ishida et al. (2009) A common feature of most of these systems is a structural and a magnetic transition at temperatures K in the undoped materials.de la Cruz et al. (2008) Doping or application of pressure lead to the suppression of the structural and the magnetic transitions and to the appearance of superconductivity. While the whole research field started with the RFeAsO (1111) compounds (R: rare earth) Takahashi et al. (2008); Ren et al. (2008a); Chen et al. (2008), later on the focus shifted towards the AFe2As2 (122) systems (A = Ba Rotter et al. (2008); Sefat et al. (2008); Ni et al. (2008), Sr Krellner et al. (2008); Gen-Fu et al. (2008); Sasmal et al. (2008); Yan et al. (2008), Ca Ronning et al. (2008); Ni et al. (2008a), Eu Jeevan et al. (2008); Ren et al. (2008b)), despite their lower .Ishida et al. (2009). The reason was a simple but essential material-related problem; sample preparation and especially single crystal growth is easier for the 122 than for the 1111. Thus, comparatively large, high-quality 122 single crystals have been available for at least one year, allowing for many investigations which could not be carried out on the 1111 systems, because size and/or quality of 1111 single crystal is still limited. As a result, the physical properties of the 122 compounds are presently much better known than those of the 1111. However, for some aspects the 1111 systems seem to be the more interesting ones. They still present the highest among the Fe-based superconductors, being only surpassed by the cuprates. This is likely to be related to a weaker bonding and exchange along the -axis resulting in a stronger two-dimensional character.Qi and Xu (2009) The 1111 compounds also present some distinct differences to the 122, which are quite relevant for a fundamental understanding of these systems. While a well-defined metallic state is established for the undoped 122 compounds, resistivity results on undoped LaFeAsO polycrystals Kamihara et al. (2008) and single crystals Yan et al. (2009a); Chen et al. (2009) systematically show an increase towards low temperatures, suggesting the proximity to a metal-insulator transition. The closeness to such a transition and the related question on the strength of correlation effects in these systems are key problems in the field.Si et al. (2009) A second, intriguing difference concerns the relation between the magnetic and the structural transition in the undoped systems. All present experimental results on the 1111 indicate that the structural transition from the tetragonal to the orthorhombic structure occurs first upon cooling, while the long-range antiferromagnetic order sets in at a slightly lower temperature, 10 - 20 K below.de la Cruz et al. (2008); Zhao et al. (2008); Luo et al. (2009) In contrast, for the 122 compounds it was clear from the first experiments that both transitions occur simultaneously Jesche et al. (2008), and it is meanwhile well established that the common transition is a first-order type one. This experimentally observed difference between 1111 and 122 is in clear disagreement with theoretical results from LDA-based ab initio calculations, which imply an intimate connection between the two transitions in both type of compounds.Krellner et al. (2008) Since the relation between structural and magnetic transition is also a central issue towards a deeper understanding of these systems, it is crucial to find out the origin for this difference. Over the past few years we have developed a high temperature Sn-flux technique for the growth of RTPO (T: transition metal) single crystals.Krellner and Geibel (2008) We recently adapted this method to CeFeAsO, and obtained larger single crystals than those obtained from high pressure techniques Zhigadlo et al. (2008), and of much better quality than those recently reported from NaAs flux growth.Yan et al. (2009b, a)
Here we present a study of the 3-related physics using resistivity, , specific heat, , and thermal expansion measurements, , with emphasis placed on the structural and the magnetic transition. The -related physics at lower temperatures was already presented and discussed in a recent publication.Jesche et al. (2009) Our results show a well-defined metallical behavior in the basal plane within the magnetic ordered state, resulting in a residual resistivity ratio (RRR) of unprecedented . The structural and the magnetic transitions are much sharper in our single crystals than in previously reported poly- or single crystals, and the separation between and decreases with increasing sample quality, down to 6 K compared to the initially reported 20 K. We discuss the implication for the relation between magnetic and structural degrees of freedom.
II Experimental
The samples were synthesized using a two-step Sn-flux technique. In a first step, As and Sn were heated up to 600∘C for 5 h in an alumina crucible which was sealed inside an evacuated silica ampule. In a second step, Ce, Fe, SnO2, and Sn were added and the alumina crucible was sealed inside a Ta-container under argon atmosphere. The constituents were mixed in a molar ratio of Ce:Fe:As:O:Sn = 2:1:2:2:5. The mixture was then heated up to 1500∘C, slowly cooled down to 900∘C within one week followed by fast cooling down to room temperature (RT). To remove the excess Sn, the samples were centrifugated at 500∘C and then put into diluted hydrochloric acid for min. This resulted in plate-like single crystals with a side length of typical 200 m, but in some cases going up to more than one millimeter. In parts, the crystals formed large clusters with a common -axis and a mass of up to 40 mg. X-ray powder diffraction patterns of ground single crystals were recorded on a Stoe diffractometer in transmission mode using Cu-Kα radiation. The lattice parameters were found to be Å and Å and correspond well with the literature data.Quebe et al. (2000); Chen et al. (2008); Zhao et al. (2008); McGuire et al. (2009) Energy dispersive X-ray (EDX) analysis revealed a stoichiometric Ce:Fe:As content and confirmed the existence of oxygen. In addition, carrier gas-hot extraction (LECO, TCH 600) was used to determine the oxygen content . The result of at.% indicates a stoichiometric oxygen occupancy. In contrast to the case of Sn-flux-grown 122 single crystals, no Sn peak could be observed in the microprobe spectra of the CeFeAsO single crystals, indicating that the problem of Sn incorporation into the single crystals is much less severe for the 1111 than for the 122.Sun et al. The sharpness of the different transitions as well as the high residual resistivity ratio (see below) confirm that Sn (or other crucible elements) incorporation is not a significant issue in these single crystals. Specific heat and electrical resistivity measurements were carried out in the temperature range of 1.8 to 300 K by using a commercial physical property measurement system (PPMS) of Quantum Design. The specific heat was determined by means of a heat-pulse relaxation technique and electrical resistivity was measured in a standard four probe geometry. The thermal expansion coefficient, , was measured using a high-resolution capacitive dilatometer built after Pott and Schefzyk (1983), which enables relative length changes to be resolved.
III Results
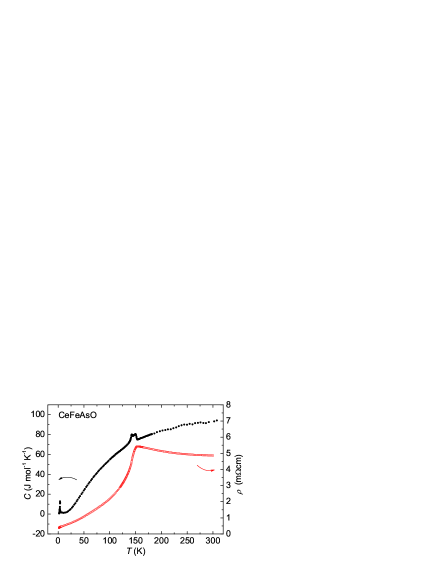
For a first overview, we show in Fig. 1 the resistivity and the specific heat of a CeFeAsO cluster in the whole investigated temperature range, 1.8 - 300 K. Below 300 K the resistivity first increases slightly with decreasing temperature. A pronounced drop at 150 K and a further kink at a slightly lower temperature mark the structural transition and the antiferromagnetic (AFM) ordering of Fe, respectively. In our single crystals, continues to decrease monotonously with down to the lowest temperature, resulting in a large RRR . The specific heat above 20 K is dominated by the phonon contribution, which, at higher temperatures, approaches asymptotically the expected Dulong Petit value J/(mol K). On top of this smooth contribution, we observe in the -range 140 - 150 K a rather sharp double structured peak connected with the structural transition and the Fe - AFM ordering. The peak in at low temperature is associated with the AFM ordering of Ce at K.Jesche et al. (2009)
Compared to previously published data, the most prominent features of these results are the sharpness of the transitions and the pronounced metallic behavior resulting in the large RRR. This is illustrated in Fig. 2, where we compare the resistivity (normalized to the RT value) measured on a small single crystal (electrical current ), on a larger cluster of (co-aligned) single crystals, and the resistivity of the polycrystal published by McGuire .McGuire et al. (2009) The residual resistivities, , and the values at 300 K increase slightly from the single crystal ( cm and mcm) to the cluster ( cm and mcm), but is much larger for the polycrystal ( mcm and mcm). All samples show an increase in the resistivity when they are cooled down from RT to K, which was also reported for several FeAsO (see e.g. McGuire et al. (2009)). This increase is almost the same for the single crystal and for the polycrystal despite quite different resistivities at low temperatures. This suggests this increase to be an intrinsic property, pointing either to an increase of the scattering rate or the opening of a gap.
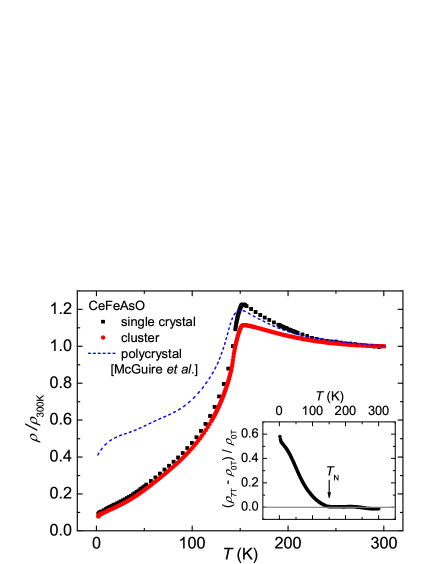
Furthermore, its presence in our single crystal implies that the pronounced metallic behavior, observed for K, is not an artifact due to a short-circuit by Sn-flux inclusions. Although the increase between RT and 150 K is more pronounced in the single crystal than in the cluster, both curves merge below down to the lowest temperatures. The inset (Fig. 2) shows the transversal magneto-resistance, , of a single crystalline sample with magnetic field parallel to the -axis and electrical current in the basal plane. At low temperatures, we observe a large positive magnetoresistance of about 60%, nearly a factor of 3 larger than in the best reported polycrystals McGuire et al. (2009), a further indication for the higher quality of our single crystals. With increasing temperature, decreases almost linearly with and nearly vanishes at . Both the large positive values observed at the lowest temperatures, where spin disorder scattering is frozen out, and the continuous decrease with increasing (and increasing ), indicate that is dominated by conventional magnetoresistance effects.
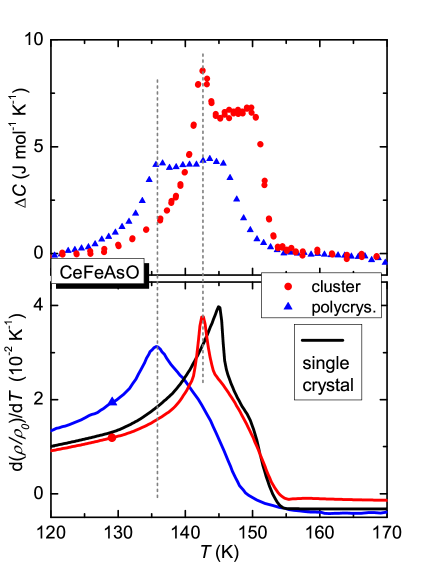
The data shown in Fig. 2 already suggest the transitions to be much sharper in our single crystals than in polycrystalline samples. We therefore focus now on the structural transition and the AFM ordering of Fe and compare in Fig. 3 the specific heat as well as the derivative of the resistivity of a small single crystal (only dd), the cluster, and the best data presently available for polycrystalline material (McGuire McGuire et al. (2009)) in the temperature range 120 to 170 K. For the specific heat we show only the part related to the transitions. For this purpose, a polynomial was fitted to the phononic background well above and well below the transition region and then subtracted from the experimental data in the transition region. The low mass ( mg) of the single crystal prevented a precise determination of the part related to the transitions, which amount to less than 0.3 % of the total because of the large phonon background of the sample itself and of the sample holder. Thus, for the small single crystal we rely on the d/d data and their relationship to the data as established for the cluster and the polycrystal. The specific heat of the cluster shows a mean-field-type transition at K, followed by a sharp peak at a slightly lower temperature K. The analysis of the heating and cooling parts of relaxation curves did not reveal evidences for a thermal arrest and therefore gave no hint for a first order transition, in contrast to the results for the 122 compounds. The assignment of the former one to the structural transition and the latter one to the magnetic transition has been well established by many investigations on polycrystals. In the polycrystal, the onset of the structural transition seems to be at the same temperature as that for the single crystal, but the transition is much broader, resulting in a lower midpoint , and the size of the anomaly ( value at the plateau) is much smaller. The peak at is barely visible, the clear signature for the magnetic phase transition being now the pronounced drop in just below , which is at a significantly lower than in the cluster. The enthalpy connected with both transitions can be calculated by integrating over . We get a larger value for the cluster, Jmol-1, than for the polycrystal, Jmol-1. Nevertheless, the result for the cluster is only half the value Jmol-1 reported for the combined, first-order magnetic and structural transition in SrFe2As2 Krellner et al. (2008).
In metallic magnetic systems, the specific heat and the resistivity are related Fisher and Langer (1968); Krellner et al. (2007); Campoy et al. (2006). Thus, in the vicinity of magnetic transitions, the derivative of the resistivity often mimics . Therefore, we plot in the lower panel of Fig. 3 the derivative of the electrical resistivity (normalized to RT) for the polycrystal, the cluster, and the single crystal. The analogy with the data in the upper part is evident. All samples show an asymmetric anomaly with a shoulder at higher temperatures followed by a peak at lower temperatures. For the cluster, the positions of the peak in dd and match perfectly, while for the polycrystal, the peak in dd is located at the onset of the drop in . Thus, the peak in dd being more pronounced than the peak in is an excellent mark for . In contrast, the anomaly at higher temperatures related to the structural transition is sharper in than in dd, suggesting that (midpoint) is related with the inflection in the latter quantity. Notably, the single crystal not only shows a sharper anomaly, but also a smaller separation between and . Comparing the three samples (see also Table 1 below), stays at 151 K for the single crystal and the cluster, and shifts to K in the polycrystal, while shifts more strongly from K in the single crystal to 142.5 K in the cluster and 136 K in the polycrystal. Thus, the difference decreases from about 18 K in the first study on LaFeAsO de la Cruz et al. (2008) and CeFeAsO Zhao et al. (2008), to 11 K in the polycrystal McGuire et al. (2009), 8.5 K in the cluster, and to 6 K in the single crystal.
In the main panel of Fig. 4, we show the thermal expansion coefficient, , of single crystalline CeFeAsO measured below 200 K along a non-specified axis within the -plane, . Upon cooling, a pronounced peak-like anomaly centered at K is observed, which is obviously connected with the structural transition. The anomaly sits on top of a positive background thermal expansion, cf. dotted line in Fig. 4, which smoothly varies with temperature. Upon further cooling, decreases monotonously down to K, where a huge -like phase transition anomaly associated with the antiferromagnetic ordering of the Ce-4 moments is visible.Jesche et al. (2009)
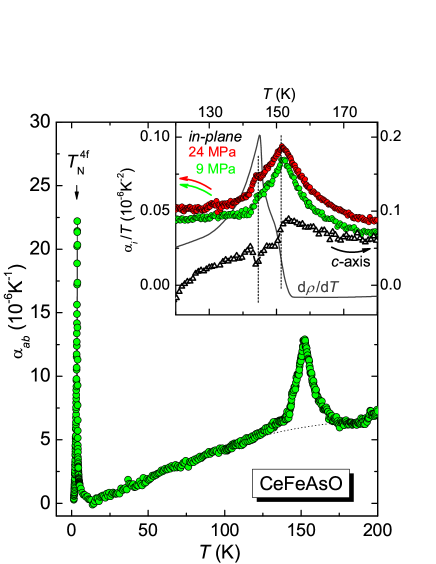
Here, we need to make a remark on the in-plane anisotropy: While in the tetragonal phase above the thermal expansion is isotropic within the basal plane, a strong difference should appear for between the two orthorhombic in-plane directions. At the structural transition itself, one expects huge uniaxial expansion coefficients (on the scale of Fig. 4) of opposite sign along the and directions because the orthorhombic distortion increases to % within a small temperature intervalKimber et al. (2008). However, the structural transition ought to result in the formation of twins, and therefore our experiment only probes some mean value, depending on the actual domain structure, of the thermal expansion in the basal plane, which is much smaller. In fact, results of lattice parameters for the related compound PrFeAsO (Fig. 2b in Ref. Kimber et al. (2008)) suggest that the uniaxial pressure dependence of for pressure applied along the - and -axes are of opposite sign, i.e. according to the Ehrenfest theorem for second-order transitions, and . Hence, the peculiar form of might be the result of two counteracting effects along and , which partly compensate each other in a multi-domain structure. Attempts to induce a preferential domain orientation by increasing the uniaxial pressure, exerted by the dilatometer cell on the crystal, from about 9 MPa to 24 MPa (see inset Fig. 4), failed as they led to practically identical results. In the inset of Fig. 4 we focus on the region around the structural and the magnetic transitions and show the details of the in-plane thermal expansion coefficient (left scale), and also the data taken along the -axis, (right scale) on an enlarged temperature scale in a representation / vs. . Two main observations can be made:
(1) The data are strongly anisotropic both with regard to the anomaly, being peak-like for and jump-like with an additional structure at slightly lower temperatures for , as well as for the background contribution. While is positive in the whole temperature range investigated and, except for the anomaly, decreases smoothly towards low temperatures, cf. main panel of Fig. 4, is about twice as large as above , but then decreases rapidly with decreasing and even changes sign and becomes negative below K. This indicates the presence of an anomalous background contribution in this temperature range which causes the -axis to expand upon cooling. A similar anisotropy, as well as the presence of a negative thermal expansion along the -axis below 50 K has been reported for PrFeAsO.Kimber et al. (2008) Furthermore, a similar behavior, with a large (compared to ) above , changing to a very small or negative below , has also been reported for undoped BaFe2As2 Bud’ko et al. (2009a), while Co- or Cr-doped BaFe2As2 show a positive at low temperatures (in the non-superconducting state).Bud’ko et al. (2009a, b) Thus, a negative or very small positive thermal expansion perpendicular to the FeAs-layers at low temperatures, below the structural transition, changing rapidly to a large value above these transitions seems to be a common feature of the undoped 1111 and 122 FeAs systems, the negative value being related to a well-established antiferromagnetic state.
(2) The comparison with specific heat and resistivity data allows a more precise analysis of the data close to the transitions. The vertical dashed lines at K and K in the inset of Fig. 4 indicate the transition temperatures of the structural transition and of the AFM ordering of Fe moments, respectively. The former one manifests itself as a sharp peak in and a jump-like discontinuity in with = lim K-1. According to the Ehrenfest relation, this negative discontinuity corresponds to a negative uniaxial-pressure dependence d/d 0. In addition, for both directions the anomalies are similar to those observed in Co-doped BaFe2As2.Bud’ko et al. (2009a) Interestingly, there is a large tail in the thermal expansion data above , more pronounced in than in , pointing to fluctuations of an order parameter for . They are likely not visible in the data because the ratio between the transition anomaly and the background contribution is much smaller for the specific heat than it is for the thermal expansion. Thus, thermal expansion is, in this respect, more sensitive than the specific heat. The presence of fluctuations above has already been suggested in thermal expansion measurements performed on polycrystals by Wang Wang et al. (2009) and Klingeler .Klingeler et al. (2009) They proposed these fluctuations to be also responsible for the increase in between RT and . However, in the additional contribution indeed almost diverges towards , while the additional contribution in increases only very smoothly towards , questioning critical fluctuations as the possible origin for the latter.
The signatures at the magnetic transition are very different. In the basal plane we observe at K a tiny peak followed by a drop in . The anomaly along the -axis is much smaller, and the scatter of the data do not allow for a strong statement about its form and size. However, the data suggests the presence of a small positive discontinuity .
IV Discussion
| Sample | (K) | (K) | (K) |
|---|---|---|---|
| initial report Zhao et al. (2008) | 158 | ||
| improved polycrystal McGuire et al. (2009) | 147 | 136 | 11 |
| cluster | 151 | 142.5 | 8.5 |
| single crystal | 151 | 145 | 6 |
The first important result of the investigation on our single crystals is that the splitting of K between structural transition and magnetic order, reported previously for undoped RFeAsO system, is not an intrinsic property, but can be tuned to much lower values. Table 1 shows a summary of measured values of , , and . The fact that our single crystals present larger and much sharper anomalies at these transitions, as well as a much higher residual resistivity ratio RRR, , indicate that they are of better quality, i.e. with less defects than the previously reported single crystals or polycrystalline materials. Thus, the reduction of the splitting is seemingly related to an increase of the sample quality, i.e. a decrease of the amount of defects. Interestingly, it was recently shown that while in pure BaFe2As2 the structural and the magnetic transition are intimately connected (), doping by partial substitution of Co on the Fe site results in a splitting of the two transitions, with increasing with Co content to K at 5% Co substitution.Ni et al. (2008b); Chu et al. (2009); Lester et al. (2009); Pratt et al. (2009) Our results demonstrate an analogous phenomenon in the RFeAsO compounds, though here the large splitting initially reported was likely due to (unintentionally) imperfect samples. Thus, while splitted or common structural/magnetic transitions were thought to be specific properties of 1111 and 122 compounds, respectively, the results on Co doped BaFe2As2 and on our single crystals indicate that also in this aspect both type of compounds are very similar. The question is now, which mechanism leads to this splitting. One proposition, which emerged from a localized moment approach, is that the splitting is a consequence of a strong two-dimensional character, i.e. of a very weak interlayer magnetic exchange.Fang et al. (2008); Xu et al. (2008); Qi and Xu (2009) It is based on older theoretical studies of the frustrated square lattice. Long before the discovery of the superconductivity in the Fe-pnictides, P. Chandra proposed for this model the occurrence of an Ising phase transition preceding the transition to the magnetically ordered state.Chandra et al. (1990) This Ising order-parameter is related to the relative orientation of two weakly coupled sublattices with (fluctuating) Nel magnetization and , corresponding to the two Fe atoms occupying one unit cell: , where stands jointly for space and time variation.Fernandes et al. (2009) This scalar product does not change sign upon magnetic field inversion and hence corresponds to a nematic phase. Its transition temperature depends on the intra-plane exchange, but not on the inter-plane exchange. In contrast, for an isotropic Heisenberg magnetic moment (which is a good approximation for the present case), the transition temperature for true magnetic long-range order decreases with inter-plane exchange, down to for a pure two-dimensional case. Therefore, increasing the two-dimensional character will first shift below and then increase the separation. There is indeed evidence that the two-dimensional character is more pronounced in the 1111 than in the 122 compounds.Qi and Xu (2009) Furthermore, the effective coupling between adjacent FeAs planes in the 1111 seems to be frustrated, i.e. on the verge between ferromagnetic and antiferromagnetic, since the Fe-moments in LaFeAsO and NdFeAsO order antiferromagnetically along the direction, while they are ferromagnetically aligned in CeFeAsO and PrFeAsO.Zhao et al. (2008) In the 122 family one always observes antiferromagnetic ordering along . Thus, the model with the nematic phase was in nice agreement with the initial picture of a significant splitting for the 1111 but no splitting for the 122. However, the results on the Co-doped BaFe2As2 single crystals and on our CeFeAsO single crystals raise some question marks, since they put the 1111 and the 122 system closer to each other, much closer than expected from the difference in the inter-plane exchange.Qi and Xu (2009) The observation of an increase of the splitting upon increasing Co substitution or increasing defect concentration indicates that predominantly defects are at the origin of this splitting, and not a strong difference in the inter-layer exchange. In this context, one should also note that the closeness of in undoped BaFe2As2 ( K) and RFeAsO compounds K) is (within a simple model) in clear disagreement with a significant difference in between these two types of compounds. On the one hand, in order to keep the nematic-phase model, one would now have to argue that disorder decreases the coherence along the -directions and thus the effective coupling between adjacent planes. On the other hand, in our comparison between different samples we see that the onset of the structural transition stays remarkably stable at 155 K, while shifts significantly, which is exactly the behavior expected for the nematic phase model. Thus, our experimental results give arguments both in favor and against the nematic phase model.
The sharper anomalies observed in our single crystals allow also for a more precise discussion of their nature: At we observe a clear mean-field type anomaly in , a clear step in , and a progressive change of slope in , which indicate this transition to be second-order. At we observe a sharp peak in d/d and in , but only small anomalies in . The two former features indicate either a sharp, -type second-order or a broaden first-order type transition. For the nematic phase model, both transitions were suggested to be second-order.Qi and Xu (2009) Furthermore, we note that the anomalies we observed in our CeFeAsO single crystals in , in (including the anisotropy), and in dd (there the sign has to be inverted) at and at are very similar to those reported in Co-doped BaFe2As2 Chu et al. (2009); Bud’ko et al. (2009a), stressing again the similarity between the RFeAsO and the AFe2As2 type of compounds.
V Conclusions
In summary, we adapted a high-temperature Sn-flux technique to the growth of RFeAsO compounds and obtained comparatively large CeFeAsO single crystals. Investigation of their properties revealed much sharper anomalies at the structural and magnetic phase transitions as well as a much lower residual resistivity and higher residual resistivity ratio than reported previously for polycrystalline samples or single crystals. This demonstrates the comparatively high quality of our single crystals. They present a pronounced and continuous decrease of the resistivity below the structural and magnetic transitions, leading to a RRR of . This proves a well-defined metallic character for transport within the FeAs plane in the antiferromagnetically ordered state, and excludes a Mott metal-insulator transition. The mean-field type anomalies observed at K in and indicate the structural transition to be of second-order type. In contrast, sharp peaks in and dd at K are compatible with either a sharp -type transition or a broaden first-order type transition. These anomalies are very similar to those observed in Co-doped BaFe2As2, where the Co-doping leads to a splitting of the structural and antiferromagnetic transitions. A comparison of different samples, including previously published data, reveals a decrease of the splitting between structural and AFM transition from K in the early reports on CeFeAsO, to 11 K in the best reported polycrystals, 8.5 K in a cluster of co-aligned crystals, and 6 K in a single crystal. Thus, this splitting is not an intrinsic property of CeFeAsO (or other RFeAsO) but can be tuned by the sample preparation conditions. Our results demonstrate that a better sample quality results in a smaller splitting, indicating that the splitting is at least partially induced by defects. This is supported by the appearance of a splitting upon Co-doping BaFe2As2. Whether this splitting shall disappear in a perfect RFeAsO sample, as for pure AFe2As2 compounds, remains an open question. Our results, in connection with the published results on Co-doped BaFe2As2, indicate that the coupling between magnetic and structural transitions is very similar in both type of compounds, much more similar than previously thought. This questions the idea of an Ising nematic order parameter proposed to explain the splitting and the differences between 1111 and 122 compounds. However, the fact that the decrease of the splitting results from a shift of to lower with decreasing sample quality, while does not change, is in agreement with this nematic phase concept.
VI Acknowledgment
R. Weise is acknowledged for technical support. The authors thank P. Scheppan, U. Burkhardt, and G. Auffermann for chemical analysis of the samples. This work was performed within the framework of the SPP 1458 priority program of the Deutsche Forschungsgemeinschaft.
References
- Kamihara et al. (2008) Y. Kamihara, T. Watanabe, M. Hirano, and H. Hosono, J. Am. Chem. Soc. 130, 3296 (2008).
- Ishida et al. (2009) K. Ishida, Y. Nakai, and H. Hosono, J. Phys. Soc. Jpn. 78, 062001 (2009).
- de la Cruz et al. (2008) C. de la Cruz, Q. Huang, J. W. Lynn, J. Li, W. R. II, J. L. Zarestky, H. A. Mook, G. F. Chen, J. L. Luo, N. L. Wang, et al., Nature 453, 899 (2008).
- Takahashi et al. (2008) H. Takahashi, K. Igawa, K. Arii, Y. Kamihara, M. Hirano, and H. Hosono, Nature 453, 376 (2008).
- Ren et al. (2008a) Z.-A. Ren, J. Yang, W. Lu, W. Yi, X.-L. Shen, Z.-C. Li, G.-C. Che, X.-L. Dong, L.-L. Sun, F. Zhou, and Z.-X. Zhao, Europhys. Lett. 82, 57002 (2008a).
- Chen et al. (2008) G. F. Chen, Z. Li, D. Wu, G. Li, W. Z. Hu, J. Dong, P. Zheng, J. L. Luo, and N. L. Wang, Phys. Rev. Lett. 100, 247002 (2008).
- Rotter et al. (2008) M. Rotter, M. Tegel, and D. Johrendt, Phys. Rev. Lett. 101, 107006 (2008).
- Sefat et al. (2008) A. S. Sefat, R. Jin, M. A. McGuire, B. C. Sales, D. J. Singh, and D. Mandrus, Phys. Rev. Lett. 101, 117004 (2008).
- Ni et al. (2008) N. Ni, S. L. Bud’ko, A. Kreyssig, S. Nandi, G. E. Rustan, A. I. Goldman, S. Gupta, J. D. Corbett, A. Kracher, and P. C. Canfield, Phys. Rev. B 78, 014507 (2008).
- Krellner et al. (2008) C. Krellner, N. Caroca-Canales, A. Jesche, H. Rosner, A. Ormeci, and C. Geibel, Phys. Rev. B 78, 100504(R) (2008).
- Gen-Fu et al. (2008) C. Gen-Fu, L. Zheng, L. Gang, H. Wan-Zheng, D. Jing, Z. Jun, Z. Xiao-Dong, Z. Ping, W. Nan-Lin, and L. Jian-Lin, Chin. Phys. Lett. 25, 3403 (2008).
- Sasmal et al. (2008) K. Sasmal, B. Lv, B. Lorenz, A. M. Guloy, F. Chen, Y.-Y. Xue, and C.-W. Chu, Phys. Rev. Lett. 101, 107007 (2008).
- Yan et al. (2008) J. Q. Yan, A. Kreyssig, S. Nandi, N. Ni, S. L. Bud’ko, A. Kracher, R. J. McQueeney, R. W. McCallum, T. A. Lograsso, A. I. Goldman, and P. C. Canfield, Phys. Rev. B 78, 024516 (2008).
- Ronning et al. (2008) F. Ronning, T. Klimczuk, E. D. Bauer, H. Volz, and J. D. Thompson, J. Phys. Condens. Matter 20, 322201 (2008).
- Ni et al. (2008a) N. Ni, S. Nandi, A. Kreyssig, A. I. Goldman, E. D. Mun, S. L. Bud’ko, and P. C. Canfield, Phys. Rev. B 78, 014523 (2008a).
- Jeevan et al. (2008) H. S. Jeevan, Z. Hossain, D. Kasinathan, H. Rosner, C. Geibel, and P. Gegenwart, Phys. Rev. B 78, 052502 (2008).
- Ren et al. (2008b) Z. Ren, Z. Zhu, S. Jiang, X. Xu, Q. Tao, C. Wang, C. Feng, G. Cao, and Z. Xu, Phys. Rev. B 78, 052501 (2008b).
- Qi and Xu (2009) Y. Qi and C. Xu, Phys. Rev. B 80, 094402 (2009).
- Yan et al. (2009a) J. Q. Yan, S. Nandi, J. L. Zarestky, W. Tian, A. Kreyssig, B. Jensen, A. Kracher, K. W. Dennis, R. J. McQueeney, A. I. Goldman, R. W. McCallum, and T. A. Lograsso (2009a), arXiv.:0909.3510.
- Chen et al. (2009) Z. G. Chen, R. H. Yuan, T. Dong, and N. L. Wang, Phys. Rev. B 81, 100502(R) (2010).
- Si et al. (2009) Q. Si, E. Abrahams, J. Dai, and J.-X. Zhu, New Journal of Physics 11, 045001 (2009).
- Zhao et al. (2008) J. Zhao, Q. Huang, C. de la Cruz, S. Li, J. W. Lynn, Y. Chen, M. A. Green, G. F. Chen, G. Li, Z. Li, et al., Nat. Mater. 7, 953 (2008).
- Luo et al. (2009) Y. Luo, Q. Tao, Y. Li, X. Lin, L. Li, G. Cao, Z.-a. Xu, Y. Xue, H. Kaneko, A. V. Savinkov, et al., Phys. Rev. B 80, 224511 (2009).
- Jesche et al. (2008) A. Jesche, N. Caroca-Canales, H. Rosner, H. Borrmann, A. Ormeci, D. Kasinathan, H. H. Klauss, H. Luetkens, R. Khasanov, A. Amato, et al., Phys. Rev. B 78, 180504(R) (2008).
- Krellner and Geibel (2008) C. Krellner and C. Geibel, Journal of Crystal Growth 310, 1875 (2008).
- Zhigadlo et al. (2008) N. D. Zhigadlo, S. Katrych, Z. Bukowski, S. Weyeneth, R. Puzniak, and J. Karpinski, Journal of Physics: Condensed Matter 20, 342202 (2008).
- Yan et al. (2009b) J.-Q. Yan, S. Nandi, J. L. Zarestky, W. Tian, A. Kreyssig, B. Jensen, A. Kracher, K. W. Dennis, R. J. McQueeney, A. I. Goldman, R. W. McCallum, and T. A. Lograsso, Appl. Phys. Lett. 95, 222504 (2009b).
- Jesche et al. (2009) A. Jesche, C. Krellner, M. de Souza, M. Lang, and C. Geibel, New J. Phys. 11, 103050 (2009).
- Quebe et al. (2000) P. Quebe, L. J. Terbüchte, and W. Jeitschko, J. Alloys Compd. 302, 70 (2000).
- McGuire et al. (2009) M. A. McGuire, R. P. Hermann, A. S. Sefat, B. C. Sales, R. Jin, D. Mandrus, F. Grandjean, and G. J. Long, New J. Phys. 11, 025011 (2009).
- (31) G. L. Sun, D. L. Sun, M. Konuma, P. Popovich, A. Boris, J. B. Peng, K. Y. Choi, P. Lemmens, and C. T. Lin, arXiv.:0901.2728.
- Pott and Schefzyk (1983) R. Pott and R. Schefzyk, J. Phys. E 16, 444 (1983).
- Fisher and Langer (1968) M. E. Fisher and J. S. Langer, Phys. Rev. Lett. 20, 665 (1968).
- Krellner et al. (2007) C. Krellner, N. S. Kini, E. M. Brüning, K. Koch, H. Rosner, M. Nicklas, M. Baenitz, and C. Geibel, Phys. Rev. B 76, 104418 (2007).
- Campoy et al. (2006) J. C. P. Campoy, E. J. R. Plaza, A. A. Coelho, and S. Gama, Phys. Rev. B 74, 134410 (2006).
- Kimber et al. (2008) S. A. J. Kimber, D. N. Argyriou, F. Yokaichiya, K. Habicht, S. Gerischer, T. Hansen, T. Chatterji, R. Klingeler, C. Hess, G. Behr, A. Kondrat, and B. Büchner, Phys. Rev. B 78, 140503(R) (2008).
- Bud’ko et al. (2009a) S. L. Bud’ko, N. Ni, S. Nandi, G. M. Schmiedeshoff, and P. C. Canfield, Phys. Rev. B 79, 054525 (2009a).
- Bud’ko et al. (2009b) S. L. Bud’ko, S. Nandi, N. Ni, A. Thaler, A. Kreyssig, A. Kracher, J.-Q. Yan, A. I. Goldman, and P. C. Canfield, Phys. Rev. B 80, 014522 (2009b).
- Wang et al. (2009) L. Wang, U. Köhler, N. Leps, A. Kondrat, M. Nale, A. Gasparini, A. de Visser, G. Behr, C. Hess, R. Klingeler, and B. Büchner, Phys. Rev. B 80, 094512 (2009).
- Klingeler et al. (2009) R. Klingeler, L. Wang, U. Köhler, G. Behr, C. Hess, and B. Büchner, Journal of Physics: Conference Series 200, 012088 (2010).
- Ni et al. (2008b) N. Ni, M. E. Tillman, J.-Q. Yan, A. Kracher, S. T. Hannahs, S. L. Bud’ko, and P. C. Canfield, Phys. Rev. B 78, 214515 (2008b).
- Chu et al. (2009) J.-H. Chu, J. G. Analytis, C. Kucharczyk, and I. R. Fisher, Phys. Rev. B 79, 014506 (2009).
- Lester et al. (2009) C. Lester, J.-H. Chu, J. G. Analytis, S. C. Capelli, A. S. Erickson, C. L. Condron, M. F. Toney, I. R. Fisher, and S. M. Hayden, Phys. Rev. B 79, 144523 (2009).
- Pratt et al. (2009) D. K. Pratt, W. Tian, A. Kreyssig, J. L. Zarestky, S. Nandi, N. Ni, S. L. Bud’ko, P. C. Canfield, A. I. Goldman, and R. J. McQueeney, Phys. Rev. Lett. 103, 087001 (2009).
- Fang et al. (2008) C. Fang, H. Yao, W.-F. Tsai, J. Hu, and S. A. Kivelson, Phys. Rev. B 77, 224509 (2008).
- Xu et al. (2008) C. Xu, M. Müller, and S. Sachdev, Phys. Rev. B 78, 020501(R) (2008).
- Chandra et al. (1990) P. Chandra, P. Coleman, and A. I. Larkin, Phys. Rev. Lett. 64, 88 (1990).
- Fernandes et al. (2009) R. M. Fernandes, L. H. VanBebber, S. Bhattacharya, P. Chandra, V. Keppens, D. Mandrus, M. A. McGuire, B. C. Sales, A. S. Sefat, and J. Schmalian (2009), arXiv.org:0911.3084.