3D Integral Field Observations of Ten Galactic Winds I. Extended phase (10 Myr) of mass/energy injection before the wind blows
Abstract
In recent years, we have come to recognize the widespread importance of large-scale winds in the lifecycle of galaxies. The onset and evolution of a galactic wind is a highly complex process which must be understood if we are to understand how energy and metals are recycled throughout the galaxy and beyond. Here we present 3D spectroscopic observations of a sample of 10 nearby galaxies with the AAOmega-SPIRAL integral field spectrograph on the 3.9m AAT, the largest survey of its kind to date. The double-beam spectrograph provides spatial maps in a range of spectral diagnostics: [O iii]5007, H, Mg b, Na d, [O i]6300, H, [N ii]6583, [S ii]6717, 6731. We demonstrate that these flows can often separate into highly ordered structures through the use of ionisation diagnostics and kinematics. All of the objects in our survey show extensive wind-driven filamentation along the minor axis, in addition to large-scale disk rotation. Our sample can be divided into either starburst galaxies or active galactic nuclei (AGN), although some objects appear to be a combination of these. The total ionizing photon budget available to both classes of galaxies is sufficient to ionise all of the wind-blown filamentation out to large radius. We find however that while AGN photoionisation always dominates in the wind filaments, this is not the case in starburst galaxies where shock ionisation dominates. This clearly indicates that after the onset of star formation, there is a substantial delay ( 10 Myr) before a starburst wind develops. We show why this behavior is expected by deriving “ionisation” and dynamical timescales for both AGNs and starbursts. We establish a sequence of events that lead to the onset of a galactic wind. The clear signature provided by the ionisation timescale is arguably the strongest evidence yet that the starburst phenomenon is an impulsive event. A well-defined ionisation timescale is not expected in galaxies with a protracted history of circumnuclear star formation. Our 3D data provide important templates for comparisons with high redshift galaxies.
Subject headings:
Galaxies: individual (NGC 253, NGC 1365, NGC 1482, NGC 1808, NGC 3628, NGC 5128, Circinus, NGC 6240, NGC 6810, IC 5063)1. Introduction
Recent observations reveal that outflows are important in the lifecycle of galaxies. First, Tremonti et al. (2004) find evidence for chemical enrichment trends throughout star-forming galaxies over three orders of magnitude in stellar mass. Surprisingly, the enrichment trends are observed to continue all the way down to (Kirby et al., 2008) where is the bolometric luminosity of the galaxy. Indeed, there is evidence that galaxies that exceed the mass of the Milky Way manage to retain a large fraction of their metals, in contrast to lower mass galaxies where metal loss appears to be anticorrelated with baryonic mass. Recent theoretical work has shown that a low-metal content in dwarf galaxies is attributable to efficient metal-enriched outflows (Dalcanton, 2007). Secondly, there is now strong evidence for large-scale outflows in the Galaxy across the electromagnetic spectrum (Bland-Hawthorn & Cohen, 2003; Fox et al., 2005; Keeney et al., 2006). Finally, the intergalactic medium (IGM) at all redshifts shows signs of significant metal enrichment consistent with the action of winds (Cen & Ostriker, 1999; Madau et al., 2001; Ryan-Weber et al., 2006; Davé et al., 2008). A high proportion of Lyman break galaxies at show kinematic signatures of winds (Erb et al., 2006) as do many nearby dwarf starbursts (Schwartz & Martin, 2004) and ultraluminous infrared galaxies (Martin, 2006; Schwartz, Martin, Chandar et al., 2006).
N-body simulations of galaxy formation within cold dark matter (CDM) cosmology fail to produce realistic galactic disks (Navarro & White, 1994; Steinmetz & Müller, 1995). Over-cooling in CDM+hydrodynamic simulations, due primarily to a lack of resolution, results in too much gas arriving in the centre of the galaxies. But a useful aspect of these incomplete models has been to highlight the possible role of feedback in shaping galaxies. Vigorous feedback in the early phase of galaxy formation is a partial solution to the angular momentum problem by preventing baryons from losing too much of their specific angular momentum through the interaction with dark matter (Fall, 2002). Indeed, some authors have claimed more realistic disks retaining much more of their angular momentum when one includes the action of AGN-driven jets (Robertson et al., 2006) or starburst driven winds (Efstathiou, 2000).
Our new survey is preempted by a vast literature across a broad spectrum that can be traced back over two decades comprehensive reviews are given by Heckman et al. (1989) and Veilleux et al. (2005). Much of the early optical work on galactic outflows was limited to narrowband images and long-slit spectroscopy (e.g. McCarthy et al. (1987); Heckman, Armus & Miley (1990); Phillips (1993); Lehnert & Heckman (1996)) although Fabry-Perot observations have been carried out in a few emission lines (e.g. Bland & Tully (1988); Cecil (1990)). The quality of UV, x-ray, infrared and radio continuum observations has greatly improved in recent years (e.g. Hoopes et al. 2005; Strickland et al. 2004; Grimes, Heckman, Aloisi et al. (2009)). Even without the kinematic separation of compound emission structures that is possible via spectroscopy, there are clear associations between these bands and the optical maps (e.g. Veilleux et al. 1994; Cecil et al. 2002). Historically, most winds had been confirmed kinematically from evidence of line-splitting along the galaxy minor axis, but at least one wind has been discovered through its ionisation signature (Veilleux & Rupke, 2002). In recent times measurement of blueshifted absorption lines have proved powerful in this regard.
In this new study, we perform wide field integral field spectroscopy of a sample of nearby galactic winds. The advantages offered by a wide wavelength base line and moderate spectral resolutions allow the determination of physical parameters for wind outflow mechanics based on ionisation and kinematic signatures e.g. rotating disk, high-latitude warm ionizing medium, wind filaments, entrained gas. One well-studied object in particular convinced us of the potential for wide-field mapping with an integral field spectrograph. The projected distribution of optical line emission in M82 is exceedingly complex but with the aid of Fabry-Perot observations, Shopbell & Bland-Hawthorn (1998) were able to kinematically separate the front side from the back side of the wind flow, and from the diffuse halo of broadened line emission (see also the recent IFS studies of Westmoquette, Smith, Gallagher et al. (2009); Westmoquette, Gallagher, Smith et al. (2009)). When this is done, both the ionisation and kinematics exhibit well ordered behavior. The lesson is clear: with complete observations, it is possible to separate distinct dynamical components. Only then does it become possible to determine physical parameters for the outflow mechanism.
In this first paper, we present the new observations and describe the reduction procedures specific to integral field spectroscopy (§ 2). We present emission-line flux and line ratio maps for a wide range of diagnostics (e.g. ionisation and density). For each galaxy, we use the ionisation diagnostic diagrams (IDDs) to delineate the different sources of ionisation as a function of location and ionisation source (see § 3) and classify the sample targets according to their individual IDDs (§ 3.1 - starbursts & § 3.2 - AGN). These diagnostic diagrams reveal well-ordered behavior across each galaxy. In § 4 we consider the source of ionisation from a theoretical perspective and use these considerations to construct an evolutionary sequence for galactic winds in section § 5. Our conclusions are presented § 6.
Through this work, we assume a flat concordance cosmology such that Ho=71 km s-1 Mpc-1, =0.27 and =0.73.
2. Observations and data reduction
2.1. Observing set up and procedure
The AAOmega integral-field spectrograph at the AAT 3.9m is ideally suited to our study (see Appendix). The SPIRAL integral field unit (IFU) is a 3216 element rectangular microlens array coupled via an optical fibre feed to the dual beam AAOmega spectrograph (Saunders et al., 2004; Sharp et al., 2006). Mounted at the Cassegrain auxilliary focus, the 0.7″ IFU pixel scale is well matched to the typical seeing at the AAT, and gives excellent sensitivity to extended low surface brightness features. The single pointing field-of-view is 22.4″11.2″. High accuracy, guide-probe offset guiding allows simple and reliable mosaicing of large areas. The default position angle of the IFU places the long axis in an east-west direction. Observations of a number of targets were undertaken at alternate PAs to accommodate the demands of other observing programs undertaken alongside the observations reported here.
Observations were undertaken over a number of observing runs as detailed in Table 1. The dual beam AAOmega spectrograph provides excellent coverage of the spectral features of interest, while maintaining a high spectral resolution. We observe with the 1500V and 1000R Volume Phase Holographic (VPH) gratings in the blue and red arms respectively. We use a 5700Å dichroic beam splitter and center the wavelength coverage and VPH blazes at 5000Å and 6800Å, resulting in 2.4 pixel mid-range resolution elements of R6300 and R5600 (velocity resolutions of 35 and 50 km s-1 FWHM). On accounting for the sample redshift range, this targets the emission lines H/[O iii] in the blue and [O i]/H/[N ii]/[S ii] in the red. Unfortunately the important [O ii] doublet at 3727Å falls outside of the observable spectral range with the chosen settings. We consider this to be a crucial line for future studies of this kind.
Quartz-Halogen flatfield exposures and CuArFeAr arc lamp exposures are taken at intervals throughout the observation to allow fibre tracing on the CCDs (both arms of AAOmega use E2V 2k4k CCDs), flat fielding and wavelength calibration. Stationed in the west Coudé room, AAOmega is kept thermally and gravitationally stable throughout each night’s observations in order to minimize the overhead on system calibrations. The strong night sky oxygen line at 5577Å falls outside the observed range and so cannot be used to calibrate relative fibre transmission as is the common practice in low resolution multi-object spectroscopy. Therefore twilight flatfield frames are observed in order to account for relative fibre-to-fibre transmission variations.
An assortment of spectrophotometric standard stars111Spectrophotometric standard stars were chosen from the ESO spectrophotometric standard list available at http://www.eso.org/sci/observing/tools/standards/spectra/ were observed throughout each observing block, in order to prepare a flux calibration solution. The scatter in the calibration function derived from the standards during the observations indicates a 10% uncertainty in the absolute flux calibration level. The relative calibration with wavelength, a quantity more relevant to line ratio determinations, is consistent at the 2-3% level, as determined from the comparison of calibration observations over the course of the survey.
Each target was observed as part of a multi-pointing mosaic. An overlap of 1 or 2 IFU elements (0.7″ or 1.4″) was allowed to enable relative intensity scaling and accurate mosaicing of the final data sets. Individual science exposures were typically 1200 sec. Mosaic sizes vary between galaxies, but are typically of the order of six to twelve IFU positions, yielding mosaics of the order 20″ to 60″ on a side.
Since our targets completely fill each IFU pointing, it is not possible to generate a sky subtraction solution from fibres within each IFU pointing. To achieve accurate sky subtraction, a small number of dedicated offset sky frames was taken each night. Data was processed in real time at the telescope using the 2dfdr software package. This allowed monitoring of the observing conditions such that the mosaic pattern could be repeated or adapted if required. The final data analysis was carried out using a custom suite of idl routines.
There are four isolated “dead elements” within the SPIRAL IFU. During the reduction process, these are replaced with the average spectrum of the four adjacent IFU elements prior to mosaicing the data. Individual frames were then aligned and mosaiced using telescope offset information and a suite of custom written software tools. Frames are scaled, based on an iterative comparison of overlap regions in the mosaic, in order to account for minor variations in transparency, seeing and exposure time.
| Observing Dates | Objects Observed |
|---|---|
| May 2007 | NGC 3628, NGC 6810, NGC 5128(CenA) |
| October 2007 | NGC 1365, NGC 1482, NGC 1808 |
| July 2008 | Circinus, NGC 253, IC 6063 |
| August 2008 | NGC 6810, NGC 1705, NGC 6240 |
2.2. The sample
We targetted a sample of ten galaxies with known galactic winds (Veilleux et al. 2003; Heckman et al. 1990; Lehnert & Heckman 1996). The details of the sources are presented in Table 2. Given that the aim of our study is to compare the properties of AGN vs. starburst winds, we did not include a “control” sample of non-wind galaxies. Integral field observations are extremely time consuming and indeed IFU surveys of galaxies have rarely been attempted before. Notable examples are the SAURON survey of early type galaxies (e.g. de Zeeuw et al. 2002) and the SINS survey at higher redshift (Genzel et al., 2008).
We limit our survey to southern hemisphere sources with bolometric luminosities in the range to ensure the impact of photoionisation by the central source (whether starburst or AGN) is detectable out to large galactocentric distances. (The physical motivation for this statement is given in §4.1.) With a view to going after a lower luminosity sample, we attempted a preliminary study of the dwarf galaxy NGC 1705 (Annibali, Greggio, Tosi et al., 2003; Meurer, Freeman, Dopita & Cacciari, 1992; Hunter, Hawley & Gallagher, 1993). Our initial observations (not presented here) served to emphasize that low mass galaxies typically have lower metallicities which render many of the ionisation diagnostics intrinsically weak. A survey sample of a substantial number of low-luminosity wind sources (10) will require a suitable IFU spectrograph on an 8m class telescope.
For each of the ten wind galaxies, the SPIRAL IFU was used in a simple tiling pattern to cover most of the filamentary emission above a surface brightness of erg cm-2 s-1 arcsec-2 (cgs). The SPIRAL mosaic patterns (or footprints) are overlayed on HST/WFPC2 imaging data in Fig. 1. WFPC2 images have been used for all sources with the exception of NGC 1482 for which UKST data from the Digitized Sky Survey has been used. The HST/WFPC2 data were obtained from the Multimission Archive at the Space Telescope Science Institute (MAST). Fig. 1 emphasizes the need for much wider field IFUs for the study of nearby galaxies. While these are under development in Europe and Australia, we stress the simultaneous requirements of spectral coverage and resolution (see Appendix) which are often sacrificed in order to achieve a larger spatial format. In this respect, we consider the AAOmega-SPIRAL spectrograph to be ideal for the proposed science, even with the limited field of view.
| Object | RA/Dec (J2000) | Redshift | Hubble type1 | Spec class2 | i | MB | LBol3 | R/Mpc | kpc/arcsec |
|---|---|---|---|---|---|---|---|---|---|
| NGC 253 | 00 47.6 25 18 | 0.00081 | Sc(X) | Hii | 86 | 20.02 | 2.8 | 2 | 0.017 |
| NGC 1365 | 03 33.7 36 08 | 0.00546 | Sb(B) | Hii, Sy2 | 63 | 21.26 | 9.3 | 16.9 | 0.100 |
| NGC 1482 | 03 54.7 20 30 | 0.00639 | Sa(P) | Hii | 58 | 18.89 | 1.1 | 19.6 | 0.121 |
| NGC 1808 | 05 07.7 37 31 | 0.00332 | SO/a(X) | Hii, Sy2? | 50 | 19.52 | 2.2 | 10.8 | 0.059 |
| NGC 3628 | 11 20.3 13 37 | 0.00281 | Sb(P) | Hii, LINER | 87 | 19.96 | 2.8 | 7.7 | 0.041 |
| NGC 5128 | 13 25.3 43 01 | 0.00183 | SO, Lenticular | Sy2 | 43 | 20.97 | 8.5 | 4.9 | 0.053 |
| Circinus | 14 13.2 65 20 | 0.00145 | Sb(A) | Sy2 | 65 | 21.23 | 9.0 | 4.2 | 0.014 |
| NGC 6240 | 16 53.0 02 24 | 0.02445 | I0 | LINER, Sy2 | — | 21.30 | 8.2 | — | 0.5 |
| NGC 6810 | 19 43.6 58 40 | 0.00678 | Sa(A) | Hii, Sy2? | 82 | 20.61 | 5.5 | 25.3 | 0.135 |
| IC 5063 | 20 52.0 57 04 | 0.01135 | Sa | Sy2 | — | 20.34 | 4.2 | — | 0.22 |
Note 1: Vizier database at http://vizier.u-strasbg.fr/
Note 2: NED database at http://nedwww.ipac.caltech.edu/; a question mark indicates that
the Seyfert classification has been questioned in later studies.
Note 3: Bolometric luminosities, LBol, in units of 1010 L⊙,
are computed from the modeling of Buzzoni (2005), with uncertainties
of typically 10% for different assumed ages of the stellar population over the full range 1-14 Gyr.
| Object | [O iii] & [N ii] | [O iii] & [S ii] | [O iii] & [O i] |
|---|---|---|---|
| Starbursts | |||
| NGC 253 | 10:90 | 10:90 | 10:90 |
| NGC 1482 | 10:90 | 10:90 | 10:90 |
| NGC 1808 | 20:80 | 0:0 | 0:0 |
| NGC 3628 | 0:01 | — | — |
| NGC 6810 | 0:01 | 0:0 | — |
| AGNs | |||
| NGC 1365 | 90:10 | 90:10 | 100:0 |
| NGC 5128 | 50:50 | 0:100 | 60:40 |
| Circinus | 100:0 | 60:40 | 100:0 |
| NGC 6240 | — | — | — |
| IC 5063 | 100:0 | 90:10 | 100:0 |
The primary ionisation source in the galactic wind-driven filaments is
determined from the IDDs in Figs. 4,7,10,12,15,18,21,24 & 28. For each of the IDDs, we show the percentage of points
(AGN:Shock) outside of the maximal star formation boundary
(Kewley et al., 2001) consistent with the fiducial models derived from
NGC 1365 and NGC 1482. Reliable fractions are hard to derive
so the numbers shown are indicative. A ratio of 0:0 indicates that all emission is
contained within the star formation boundary. Blank entries indicate
that the IDD could not be constructed in the given line ratio.
Note
1: Figs. 12 and 14 clearly
delineate enhanced [N ii]/H co-spatial with line profile splitting
in the outflowing gas, consistent with
the shock signatures seen in NGC 1482 (see §3.1).
| Object | LBol | Extent | Deprojected | (H) @ 1 kpc | (H) @ 1 kpc |
|---|---|---|---|---|---|
| (1010 L⊙) | (arcsec) | (kpc) | (ergs s-1 cm-2 arcsec-2) | (ergs s-1 arcsec-2) | |
| NGC 253 | 2.8 | 30.5 | 0.5 | 3.8e-16 4.6e-16 | 5.4e+35 6.5e+35 |
| NGC 1365 | 9.3 | 16.4 | 1.8 | 2.6e-16 1.2e-16 | 1.4e+37 6.5e+36 |
| NGC 1482 | 1.1 | 15.5 | 2.2 | 8.9e-16 4.4e-16 | 6.6e+37 3.3e+37 |
| NGC 1808 | 2.2 | 22.5 | 1.7 | 1.6e-16 5.1e-17 | 3.7e+36 1.2e+36 |
| NGC 3628 | 2.8 | 28.0 | 0.4 | 5.2e-17 2.2e-17 | 1.7e+36 6.9e+35 |
| NGC 5128 | 8.5 | 36.0 | 2.8 | 4.7e-16 2.2e-16 | 6.8e+36 3.2e+36 |
| Circinus | 9.0 | 24.6 | 0.4 | 1.9e-16 8.5e-17 | 1.5e+36 6.6e+35 |
| NGC 6810 | 5.5 | 12.0 | 16.4 | 5.5e-16 2.4e-16 | 4.7e+37 2.1e+37 |
| IC 5063 | 4.2 | 6.0 | 1.4 | 1.3e-15 5.3e-16 | 3.1e+38 1.3e+38 |
The spatial extent of emission-line gas is estimated from measurements of the H and [N ii] emission along the minor axis of each galaxy. The point at which line fitting becomes unreliable is determined for each mosaic. For the default observing mode, this corresponds to a line surface brightness of cgs. The physical extent within the mosaics is corrected for the galactic inclination given in Table 2. In the final two columns, we give the mean H surface brightness and the mean H luminosity at 1 kpc (with uncertainties), or at the physical limit of the gas if this is less than 1 kpc. These values are not corrected for internal dust extinction.
2.3. Emission line maps
Emission line maps are constructed via profile fitting to each individual spectrum from the data cubes. Lines are approximated with single Gaussian profiles in the work that follows, and each line is fitted independently, rather than simultaneously, which is possible at the SPIRAL resolution in most instances. This simplification overlooks effects such as line splitting observed in emission from the front and back surfaces of an outflow cone and asymmetric profiles (blue/red shoulders to emission lines) from marginally resolved kinematic components. Ultimately a full deconvolution of each data cube, informed by kinematic models for each source, will be required (e.g. Westmoquette, Smith, Gallagher et al. (2009)).
Currently no account is being taken for the underlying stellar absorption although H absorption is evident close to the disk in some cases. The limited wavelength coverage, which excludes Balmer lines higher than H, hampers a proper treatment of the underlying stellar continuum. The dominant effect of neglecting stellar absorption will be to underestimate the flux in the H emission line, suggesting that [O iii]/H ratios may be moderately overestimated in regions with a significant contribution from stellar continuum. In our present study, Balmer absorption has negligible impact since we are concerned with filaments that extend beyond the projected stellar disk.
2.4. Ionisation diagnostic diagrams
For each object, we construct “ionisation diagnostic diagrams” (IDDs) as prescribed by Baldwin, Phillips & Terlevich (1981) and Veilleux & Osterbrock (1987) for different families of optical emission lines. An example, constructed from the observations of NGC 1482 (Figs. 2 & 3), is presented in Fig. 4. We have included the extreme starburst model of Kewley et al. (2001) as a common fiducial indicator. The IDDs for the galaxy sample are presented in Figs. 4, 7, 10, 15, 18, 21, 24 & 28.
We have added two further reference lines to each diagnostic plot, which are derived from two objects in our sample. The two diagonal lines across the IDDs indicate the different tracks traced by the bulk of the data points in NGC 1365 and NGC 1482. These two galaxies are the clearest examples within our sample of AGN photoionisation (Veron, Lindblad, Zuiderwijk et al., 1980) and shock ionisation (Veilleux & Rupke, 2002) respectively. As such, these tracks constitute our own internal calibration of two very different sources of gaseous ionisation and allow for a very precise differential analysis for our galaxy sample. This clear distinction arising from the IDDs for each galaxy allows us to cleanly separate most of the galaxies into one or other category in terms of the dominant source of ionisation in the outer filaments.
We emphasize that shock diagnostics can overlap a region of the IDDs occupied by so-called LINER objects, some of which may be excited by dilute photoionizing sources rather than by shocks. The origin of LINER ionization is still somewhat controversial. For all of our objects, the strength of the [NII], [SII] and [OIII] lines, and sometimes [OI] lines, argues against “LINER” ionization so we do not consider it here.
3. The galaxy sample
We provide an overview of each galaxy based on an extensive literature review with particular emphasis on recent work. Our initial classification below in terms of starburst or AGN is taken from Table 2. We start with the canonical objects NGC 1482 and NGC 1365 in each category respectively.
3.1. Starbursts
NGC 1482
Hameed & Devereux (1999) first reported “filaments and chimneys of ionised gas” in NGC 1482. More recently, tunable filter observations of NGC 1482 led Veilleux & Rupke (2002) to consider it the prime example of a “shock excited, limb-brightened conic wind structure”. No compelling evidence for an AGN has yet been reported in the literature at any wavelength and thus NGC 1482 is classified as a typical Hii galaxy (Kewley et al., 2001).
Our SPIRAL IFU observations of NGC 1482 are presented in Figs. 24. The conic outflow structure seen in the emission-line gas (Veilleux & Rupke, 2002) and diffuse x-ray emission (Strickland et al., 2004a) is evident in the SPIRAL integrated line flux maps (Fig. 2). The enhanced line emission in the forward facing component of the limb brightened bi-cone is clearly visible above the disk (particularly towards the bottom of the [N ii] and [O iii]maps of Fig. 2) with the counter cone visible, subject to dust attenuation, below the inclined disk in most emission lines. Line profiles from the near and far side of the extended filaments show clear evidence of line splitting at the level of 130 km s-1.
Strong line emission is seen throughout the galactic disk with the base of the outflow cone coincident with the outer boundary of strong star formation (as measured by the gradient in the H emission along the disk), indicative of a wind launched above (and below) the plane of the disk from an extended starburst region. A sharp gradient in the electron density, as measured by the [S ii]:[S ii] ratio (Fig. 3) is also coincident with the boundaries of the base of the outflow region, suggestive of a clearing of the inner disk by the action of the starburst wind.
Under an alternate intensity scaling, the H integrated flux map does show a compact nuclear region at the limit of the spatial resolution of the SPIRAL data. The nucleus appears to be resolved at mid-IR wavelengths (Siebenmorgen et al., 2008) and with no spectroscopic evidence of an AGN the emission is likely that of a compact star forming region.
The line ratio diagnostics for NGC 1482 are shown in Fig. 4. The limited sensitivity to [O iii] emission, particularly in the counter flow region to the north of the disk (presumably hampered by significant dust attenuation) restricts the region that can be analysed in this manner. As for all of our sample, most of the data points are bunched to the right of the IDD, consistent with metal enriched gas in the nuclear regions of massive galaxies. The body of the disk emission is consistent with high metallicity star formation (Z1.0, Kewley et al. (2001)).
The emission from the bi-cone of NGC 1482 is compatible with shock-induced ionisation (Veilleux & Rupke, 2002). The line ratios harden with increasing height above the disk place. This could indicate the gas becomes increasingly shocked at greater distance above the disk (not unexpected since the wind speed will increase with reduced ISM gas density (Rand, 1998)), or may simply be a product of dilution of the outflow emission line components blended with the underlying disk emission in the simple single Gaussian line apporoximation currently implemented. The line ratio maps indicate harder line ratios on the western side of the southern lobe, coincident with the x-ray emitting gas presented by Strickland et al. (2004b).
NGC 253
Due to its proximity, NGC 253 is one of the best studied examples of the class of luminous infrared galaxies known to be undergoing an intense burst of star formation (Rieke, Lebofsky, Thompson et al., 1980). Demoulin & Burbidge (1970) interpreted the disturbed kinematics of the emission line gas as a conic outflow which was later shown (McCarthy, van Breugel & Heckman, 1987) to be qualitatively consistent within the Chevalier & Clegg (1985) starburst wind model. Evidence for entrainment of molecular gas within the outflow has been reported (Sakamoto et al., 2006). The outflow is clearly visible in the UV although the observed flux is most likely light from the central starburst scattered by dust entrained in the outflow (Hoopes et al., 2005). X-ray observations do not reveal evidence for an AGN, being consistent with a starburst driven galactic wind (Persic et al., 1998; Strickland et al., 2000).
The large spatial extent of NGC 253 meant that only the southern side of the galactic plane could be surveyed with the SPIRAL IFU in the allocated observing time (4 hours per object). The observations are presented in Figs. 57. NGC 253 closely follows the emission pattern of NGC 1482. Two prominent fingers of emission, interpreted as the limb brightened edges of a line-emitting cone, are clearly identified in the SPIRAL data (Figs. 5), with the structure most clearly highlighted by the contours of [N ii] emission. Like M82, the [O iii] emission is more centrally condensed than the low ionisation emission (cf. Shopbell & Bland-Hawthorn 1998). Much like in NGC 1482, the prominence of the [N ii] emission is suggestive of shock excitation at the boundary of the flow.
Line splitting, indicative of a hollow conic outflow structure, is seen in spectra taken from the central region of the outflow above the plane of the disk. The velocity separation is roughly 100 km s-1 close to the disk but rises to 230 km s-1 at the edge of the IFU mosaic suggesting an acceleration of the outflow with increasing height above the disk plane (under the assumption of a constant cone opening angle). The limb brightened cone edges show only a single velocity component. The wind filaments converge to a considerably more compact region ( pc) in the nuclear disk compared to what is seen in NGC 1482.
Consistent with Strickland et al. (2000), the western limb is brighter in the Balmer lines. In contrast, we find that the eastern limb is consistently brighter in all forbidden lines relative to H (Fig. 6). A similar asymmetry is seen in NGC 1482. We observe an apparent hardening of the line ratios with height above the disk, but this may be due to dilution from the inner disk.
The IDDs constructed from the SPIRAL data (Fig. 7) reveal the dominance of shock ionisation in the optical filaments. In particular, weak [O i] emission is observed across the cone being especially prominent in the eastern limb. At large distances, the weaker [O i] emission is compromised by the proximity of strong telluric [O i] emission due to the low redshift of NGC 253.
Consistent with this picture, Strickland et al. (2000) conclude that the outflow emission seen at x-ray energies is derived from a low filling factor gas that is excited by interaction between the wind and the ISM on the surface of the outflow cone, rather than from the wind itself. In conclusion, NGC 253 exhibits a starburst driven, shock excited wind nebula, observed in this instance only on the near side of the disk due to the spatial coverage of the data. The wind originates from a centrally confined starburst, rather than from a significant portion of the disk region.
NGC 1808
The “peculiar” nuclear spectrum of this object led Veron-Cetty & Veron (1985) to classify NGC 1808 as a weak Seyfert 2 galaxy. Subsequent observations (Forbes, Boisson & Ward, 1992) showed that the properties of the nuclear emission are more plausibly explained by a nuclear starburst, a view supported by mid-IR diagnostics (Laurent et al., 2000). Phillips (1993) confirm the nuclear outflow suspected from earlier work, arguing against the Seyfert 2 identification in favour of a starburst-driven outflow source.
Junkes et al. (1995) find that the nuclear x-ray emission from the unresolved core is largely due to the SNRs and hot bubbles of the central starburst. Near-IR spectroscopy of the nucleus (Krabbe, Sternberg & Genzel, 1994) favours a relatively young starburst (age 50 Myr with a star formation rate of 1 M⊙ yr-1); see §4.1). But at higher energies, there is evidence for a heavily obscured AGN component (q.v. Jiménez-Bailón et al. (2005)). Thus, we retain the Seyfert 2 classification in Table 2 for this galaxy, although the designation remains uncertain.
Figs. 810 present the new SPIRAL observations. NGC 1808 was observed under less than ideal conditions, with variable seeing and intermittent cloud cover. But we were able to extract useful IDDs for the inner extent of the wind. Our observations reproduce the asymmetric line profiles of Phillips (1993), with blue and red shoulders corresponding to the near side outflow and counter flow, as previously reported. Due to the weakness of [O iii] and [O i], the IDDs do not provide an unambiguous answer for the nature of the ionizing source in the extended filaments. But we stress that the base of the wind is enhanced in [N ii]/H, similar to what is observed in NGC 1482, and the line profiles are somewhat broadened. These observations are consistent with large-scale shocks in the outflowing gas.
NGC 3628
Fabbiano, Heckman & Keel (1990) presented the first strong evidence from x-ray and H observations for a collimated outflow suspected from earlier kinematic work (Schmelz, Baan & Haschick, 1987a, b). Subsequently, a corresponding molecular disk-halo outflow was reported by Irwin & Sofue (1996). IR (Rice et al., 1988) and radio (Condon et al., 1982) measurements place this object on the well known far-IR vs. radio correlation indicating that the central energetics are dominated by star formation. At x-ray energies, no evidence is found for an active nucleus at the current detection limits (Flohic et al., 2006).
Observations of NGC 3628 were undertaken in less than ideal observing conditions. We were able to extract useful spectral diagnostic information from the red data, but only limited information from the blue data. Emission line maps were extracted for H, [N ii] and [S ii] and are presented in Figs. 11 & 12. The strongest line emission originates in a series of compact regions to the south-east of the SPIRAL mosaic, which we interpret as Hii regions. The [N ii]/H ratio image (Fig. 12) reveals the filamentary emission above the plane of the disk reported by Fabbiano, Heckman & Keel (1990).
The line ratios in this region show enhanced [N ii]/H similar to what is observed in most of our starburst wind sources. Strong [O iii]/H is ruled out by the blue data even with its compromised sensitivity. The base of the wind is enhanced in [N ii]/H, reminiscent of what is observed in NGC 1482, and the line profiles are somewhat broader than line emission from neighbouring HII regions. Once again, these observations are consistent with large-scale shocks in the outflowing gas.
NGC 6810
The historic classification of this object as a Seyfert 2 galaxy is based primarily on the width of emission lines in low spatial resolution spectra of the nuclear region. Coccato et al. (2004) noted “a higher than expected minor axis velocity dispersion and unusual kinematics” in long slit spectroscopy. Strickland (2007) concluded that NGC 6810 is in fact a “full disk” superwind galaxy and that the previous classification is based largely on misidentification of counterparts in a low resolution radio survey and the merged line profiles of an outflowing wind. This is compatible with the earlier observation (Forbes & Norris, 1998) that the radio, FIR and [Fe ii] properties of the inner disk are consistent with star formation. Our new SPIRAL observations (Figs. 1315) are consistent with this interpretation. There is no evidence for AGN activity in the optical spectra, with narrow lines consistent with solar-metallicity star formation across the stellar disk. Star formation across the disk of the galaxy dominates the IDDs.
The [O iii]/H line ratio map (Fig. 14) shows striking evidence for an “ionisation cone” on the near side of the disk. These structures are not unique to AGN sources (e.g. Pogge 1987; Tadhunter & Tsvetanov 1989) having been observed in starburst galaxies (e.g. Shopbell & Bland-Hawthorn 1998). Leaked radiation from a starburst or an AGN, or even shocks excited by a conic outflow, can produce ionisation cones along the minor axis. In support of this statement, the [O iii]/H ratio in this region is characteristically low (cf. Shull & McKee (1979)). In the line ratio map, we have used H in place of H because the stronger H signal reveals the cone more clearly.
Unfortunately, the weakness of [O iii] emission above the galactic disk makes it difficult to unambiguously classify the excitation mechanism for the outflow gas from the IDD (Fig. 15). But we stress that the base of the wind is enhanced in [N ii]/H similar to what is observed in NGC 1482. The high [N ii]/H gas delineates the boundary of a chimney structure emanating from the central starburst region. The base of the chimney extends 1.5 kpc across the inner galaxy. An inspection of emission-line profiles in regions of enhanced [N ii]/H reveals multi-component line profiles indicative of high velocity material in a blueshifted outflow on the eastern side of the disk, with the corresponding counter flow redshifted (and dust attenuated) on the opposite side. In summary, our observations provide further evidence that the off-nuclear emission in NGC 6810 is due to a large-scale galactic wind. Like NGC 1482, the dominant source of ionisation is most likely due to shock excitation of filaments entrained in the wind.
3.2. AGN
NGC 1365
Optical spectroscopy of this well known Seyfert (Veron, Lindblad, Zuiderwijk et al., 1980; Edmunds & Pagel, 1982) reveals a broad component to the H line and line ratios indicative of AGN activity. Further evidence for the AGN comes from x-ray variability of the highly obscured nucleus (Ward et al., 1978). But based on an analysis of the radio and x-ray structure of the central regions, Stevens, Forbes & Norris (1999) suggest that the energetics are dominated by star formation, and that “the evidence of a jet emanating from the nucleus is at best marginal” (cf. Sandqvist, Jöersäeter & Lindblad (1995)). The radio/far-IR ratio is also indicative of a dominant circumnuclear starburst (Forbes & Norris, 1998).
The extended ionised gas in NGC 1365 has been extensively studied with long-slit spectroscopy. On the basis of these observations, Hjelm & Lindblad (1996) propose a physical structure (wide angle, hollow conic outflow) to explain the unusual velocity structures previously reported (Phillips et al., 1983; Jöersäeter et al., 1984) in the context of an outflow (first suggested by Burbidge & Burbidge (1960)), while Storchi-Bergmann & Bonatto (1991) present clear evidence of an [O iii] “ionisation cone” to the south east of the nucleus, above the plane of the disk.
The new SPIRAL observations for NGC 1365 are presented in Figs. 1618. The reconstructed continuum image reproduces the central disk structure seen in the HST imaging from Fig. 1. The H integrated flux map suggests strong star formation in the nuclear zone, with a number of probable compact Hii regions or star clusters.
Strong [O iii] emission is seen to extend eastwards from the nuclear region above the plane of the disk, while a counterpart emission region seen below the disk is at lower intensity, presumably due to dust attenuation on crossing the plane of the nuclear disk. [N ii] emission exhibits the classic limb-brightened arms of a conic structure to the west but such a feature is less obvious on the near side of the disk, possibly due to confusion with disk emission. Phillips et al. (1983) report the “remarkable kinematics of the ionised gas in the nucleus of NGC 1365” and line splitting to be most prominent in the south-eastern region, particularly in the [O iii] line, observations supported by the SPIRAL data. Line splitting is evident but not complete at the resolution of the SPIRAL observations, suggesting a narrow opening angle or low velocities for the outflow.
The emission-line ratio maps shown in Fig. 17 are revealing. The counter fan of [O iii] emission is evident to the west in the [O iii]/H ratio, while the enhanced [N ii]/H ratio usually observed in outflowing emission line gas is seen to fill the region bounded by the limb brightened [N ii] structure of the western region of Fig. 16. The expected counter-flow region is visible to the east as high [N ii]/H gas once far enough above the disk to avoid contamination by the strong star formation in the region. The [S ii] electron density diagnostic shows no clear structure at the limit of our signal-to-noise limit. The ionisation cone from the central AGN is most evident on the nearside of the disk in the [O iii]/[O i] ratio (Fig. 17).
The classic IDDs are presented in Fig. 18: the dominant signature is that of a high metallicity starburst consistent with dominant circumnuclear star formation. However, significant emission, particularly in the outflow regions, lies above the extreme star formation boundary of Kewley et al. (2001). The zone occupied by this gas, in all three of the classic diagnostic diagrams, is indicative of the hard ionising spectrum expected from AGN photoionisation, and is for the most part inconsistent with photoionisation by starlight or shock ionisation models. Broad Heii 4686 and Hei 5876 emission are observed in the nuclear spectrum, consistent with photoionisation by a hard ionizing source.
Circinus
Located at low galactic latitude and with high foreground extinction (AV=1.5), this large nearby Seyfert galaxy was first identified by Freeman et al. (1977). Maser measurements firmly establish the central black hole mass at M⊙ (Greenhill et al., 2003a). With the inferred accretion rate (0.1 ) at odds with much higher accretion rates in other Seyferts with maser-determined black hole masses (e.g. NGC 1068; Begelman & Bland-Hawthorn 1997), Circinus lends support to the notion that supermassive black holes are indeed quite common in galaxies, but for the most part have long duty cycles and/or low accretion rates.
The Seyfert 2 nature of Circinus is supported by the mid-IR coronal line emission (Lutz et al., 2002), e.g. [Si ix] at 3.94m (Oliva et al., 1994). Recent integral field spectroscopy, assisted by adaptive optics (Mueller-Sánchez, Davies, Eisenhauer et al., 2006), indicates a substantial (12% ) young (100 Myr) toroidal starburst within 10 pc of the central AGN and provides further evidence for a “wide angle outflow” as reported by Greenhill et al. (2003b). Extended filamentation associated with the outflow was first mapped by Veilleux & Bland-Hawthorn (1997), and later in more detail by Veilleux et al. (2003). X-ray spectral analysis further supports the view of Circinus as a highly obscured AGN but with strong thermal dust emission dominated by heating from nuclear star formation (Matt et al., 2000).
The large spatial extent of the Circinus galaxy allowed only the north-west side of the disk to be probed with SPIRAL. Figs. 1921 present the observations. Our spatial coverage was guided by TTF observations of Veilleux & Bland-Hawthorn (1997) and the HST study of Wilson, Shopbell, Simpson (2000). We have not attempted to correct the observed spectra for foreground reddening. The “hook” structure identified by Veilleux & Bland-Hawthorn (1997) traces the southern boundary of an ionisation cone, running east-west in the prominent emission lines.
The [O iii] line profiles show significant complexity with a number of mixed velocity components. Maximal line splitting in the centre of the ionisation cone, and single line profiles along its outer walls, might suggest a simple conic outflow structure. But the line intensity maps indicate limb darkening rather than the limb brightening one would expect on a conic emitting surface at the interface of a hot wind material and the cooler ISM, suggesting significant emission from gas within the cone. There is a strong velocity gradient across the filaments, each filament being at a different mean velocity, with the [O iii] emission from the east-west boundary significantly redshifted with respect to the opposite (north-south) region of the ionisation cone. The ouflow is best interpreted as a gas-filled ionisation cone illuminated by the central AGN, rather than a walled cavity structure.
NGC 5128 (Centaurus A)
Cen A is one of the most well studied active galaxies owing to its extraordinary brightness across 16 decades or more of the electromagnetic spectrum (Israel 1990). It is the nearest powerful AGN and, more specifically, the closest FR I radio source. Fortuitously, we are witnessing an accretion-powered radio source in the first 100 Myr of its projected Gyr lifetime. A well known feature of Cen A, unique among our sample, is the presence of a spectacular radio jet (Blanco, Graham, Lasker & Osmer, 1975; Peterson, Dickens & Cannon, 1975) which ignites optical filaments along its axis (Sutherland, Bicknell & Dopita, 1993). The jet-induced emission falls far beyond the radial extent of our IFU mosaic.
Over the inner galaxy, the extended ionised gas was first mapped by Bland, Taylor & Atherton (1987) and Nicholson, Bland-Hawthorn & Taylor (1992), and shown to arise exclusively from a severely-warped thin disk, later confirmed by CO observations (Quillen, Graham & Frogel, 1993). A diffuse highly ionised halo of [O iii] was first identified by Bland-Hawthorn & Kedziora-Chudczer (2003, see their Fig. 6) and has recently been shown to match the extended x-ray maps from Chandra (Kraft et al., 2008) extraordinarily closely. Extended mid-IR emission is also seen along the radio axis, revealing evidence for a limb-brightened shell (Quillen et al., 2006), and providing strong evidence for a bipolar outflow along the radio axis.
Here we provide only a brief summary of the SPIRAL observations presented in Figs. 2224. A more detailed discussion and associated modeling is to be presented elsewhere. The [O iii]/H vs. [N ii]/H IDD reveals a large number of data points above the extreme starburst line. When these points are identified in the SPIRAL data, they reveal a striking nuclear ionisation cone. The cones vissibility is enhanced after a spatial binning of the mosaiced blue IFU data (Fig. 25). The conic region, delineated by sharp edges, exhibits gas with the ionisation ratios expected from a hard AGN ionising spectrum, although shocks cannot be ruled out. The structure can be traced back towards the nucleus where it likely connects with the Pa emission cone seen by Krajnović, Sharp & Thatte (2007) at near-IR wavelengths. The feature is roughly aligned with the known radio jet structure above the plane of the disk. Our coverage to the south is insufficient to trace a possible counter cone. Throughout the cone, we clearly see variations in the [S ii] doublet consistent with density variations of order cm-3. This is consistent with the inferred shell-enhanced densities from the mid-IR observations (Quillen et al., 2006).
In summary, we have discovered an “ionisation cone” along the minor axis of Centaurus A for the first time. The phenomenon is most evident in emission-line ratio images (e.g. [O iii]/H) where a clear distinction can be made between the ionising source in the outflow from the background ionising source. This tends to favour an ionisation cone powered by an AGN source, but the phenomenon can also be identified in starburst galaxies (see §4.1), as we discovered here in NGC 6810.
IC 5063
Bergeron, Durret & Boksenberg (1983) presented early evidence for an obscured Seyfert nucleus via the detection of a broad yet weak component to the H emission. Colina, Sparks & Macchetto (1991) reported high-excitation emission lines and confirmed the broad H profile, thereby supporting the claim of a concealed active nucleus. Both papers note the kinematic decoupling of gas in the inner regions from the extended disk rotation curve of the galaxy. Colina, Sparks & Macchetto (1991) favoured an explanation invoking outflowing gas, and provided evidence of a wide angle (50∘) ionisation cone via the spatial map of the [O iii]/H ratio.
At radio wavelengths, Morganti et al. (2007) present high quality observations of warm and cool material moving outwards from the nucleus (see also Morganti, Oosterloo & Tsvetanov (1998)). Their observations suggest a radio lobe/jet structure which in turn may be responsible for the disturbed kinematics of the outflow gas. These authors conclude there is little evidence for shock-driven excitation, proposing instead that the emission is overwhelmed by AGN photoionisation.
The SPIRAL observations are shown in Figs. 2628. As presented in previous work (Bergeron, Durret & Boksenberg, 1983; Colina, Sparks & Macchetto, 1991), the velocity field of the emission line gas is dominated by a regular disk rotation beyond 2″ from the nucleus, although line profiles show evidence of broadening at the base of the stronger lines, and line splitting is apparent above the mid-plane. The kinematically distinct outflowing gas shows little evidence of the classic line splitting expected from a hollow conic outflow structure, indicative of a more homogeneous gas distribution in this region. The ionisation diagnostic diagrams (Fig. 28) indicate AGN photoionisation almost exclusively, at least in regions where the intensity of emission is sufficently above the fitting threshold.
NGC 6240
As one of the closest of the ultraluminous infrared galaxies (ULIRG), NGC 6240 is central to the longstanding debate as to the presence or absence of quasar-like nuclei in ULIRG sources. In the case of NGC 6240, hard x-ray observations unambiguously identify a double AGN core at its heart (Komossa et al., 2003). A large-scale wind was first reported by Heckman, Armus and Miley (1990) (cf. Ptak, Heckman, Levenson et al. (2003), Colbert, Wilson & Bland-Hawthorn (1994)). The extended emission-line gas has been mapped in optical lines by imaging tunable filters (Bland-Hawthorn, Wilson & Tully, 1991; Veilleux et al., 2003) and in x-ray emission (Komossa et al., 2003).
The SPIRAL observations show that the nuclear regions of NGC 6240 are highly complex both in the kinematics and ionised gas distribution. With limited spatial coverage possible due to observing constraints, our observations were guided by the study of Veilleux et al. (2003) and focus on the region of high [N ii]/H ratio emission. Two dimensional emission maps are not shown as the complexity of the emission structure in the nuclear region combined with the low surface brightness of emission in the less complex outer zones is not easily interpreted in this manner. Spectra from the nucleus show kinematically broadened line emission (FWHM13Å) with a velocity spread of 500-600 km s-1. Most spectra do not easily separate into identifiable H and [N ii] lines.
An emission-line filament is observed to extend east from the nucleus. We interpret the isolated line in the filament spectrum as H offset in velocity from the host galaxy by km s-1in the outer reaches of the mosaic. This is at odds with the H vs. [N ii] map of Veilleux et al. (2003) but we note that the proposed shift in the emission wavelength could lead to cross-contamination between the wavelength settings of the tunable filter observations. The conspicuous absence of satellite H (and the fainter [N ii] line) in the filament spectrum support our proposed identification. On heavily binning adjacent spectra, there is evidence for a weak feature compatible with broad [N ii] emission to accompany H. There is tentative evidence for [O iii] emission associated with the H filament as well, although the sensitivity of the data is not sufficient to confirm this in detail. In summary, we are unable to construct IDDs for this object with the present observations.
4. AGN vs. Starburst
In the previous section, we saw consistent differences in the ionisation characteristics of outflowing gas associated with starburst and AGN sources. We now present a simple model that largely explains these differences. Consequently, our model provides a key insight into the galactic wind mechanism and the radiative timescales of the starburst and AGN phenomenon.
4.1. Predicted and observed levels of photoionisation
Our galaxy sample spans bolometric luminosities in the range L⊙ and are distinguished by their nuclear starburst or AGN activity. All of the galaxies were selected on the basis of known minor-axis outflows. The new observations reveal that all of the AGN galaxies display IDDs typical of direct photoionisation by the AGN, whereas the starburst galaxies display IDDs typical of shock ionisation. How are we to understand this?
First we note that both nuclear starburst and active galaxies almost certainly have duty cycles such that what we observe now is more representative of their peak activity rather than their quiescent phase. We now show that prima facie the distinction between starburst and AGN outflow IDDs is surprising when one considers the overall ionizing photon production in both classes of sources.
A black hole that converts rest-mass energy with an efficiency into radiation has a luminosity
| (1) | |||||
| (2) |
for which is the mass accretion rate. In reality, the accretion disk luminosity can limit the accretion rate through radiation pressure. The so-called Eddington limit is given by
| (3) | |||||
| (4) |
where is the black-hole mass, is the proton mass and is the Thomson cross-section for electron scattering. This equation allows us to derive a maximum accretion rate , and therefore a maximum ionizing luminosity, for a given black-hole mass. We find that this relation is not strongly constrained with the present data. For a canonical power-law continuum () typical of active galactic nuclei, the number of Lyman continuum (LyC) photons is given by
| (5) |
for which is the fraction of () arising from AGN activity today (i.e. not averaged over the lifetime of the source).
The total radiative output from a luminous starburst at the present epoch can be approximated by (e.g. Maloney 1999; Heckman, Lehnert & Armus 1993)
| (6) | |||||
| (7) |
where is the starburst duration estimated from the gas supply divided by the star formation rate . The third and fourth terms indicate the lower and upper stellar mass cut-offs. For a conventional IMF, the star formation rate is roughly
| (8) |
We can now determine the rate of Lyman continuum photons produced by the starburst. To a useful approximation,
| (9) | |||||
| (10) |
which is to be compared to equation 5 above. The high-energy cut-off for the hot young stars declines rapidly beyond 50 eV. The factor is the fraction of () arising from the starburst activity today (i.e. not averaged over the lifetime of the source).
The LyC photon rate for both starbursts and AGNs for two sources with the same bolometric luminosity is essentially the same. While the nonthermal spectrum of the AGN means that the harder photons propagate at least an order of magnitude further into the surrounding gas, the photon number is dominated by the soft photons so that the comparison is still meaningful. We do not discuss the possibility of the total accretion disk luminosity being channelled into a smaller solid angle (i.e. intrinsically beamed) because we were unable to find compelling evidence for this to be so. This is to be addressed in our later papers.
An ionizing photon rate as high as phot s-1 is easily large enough to account for the off-nuclear line fluxes observed in all galaxies, whether starburst or AGN. At a distance of 1 kpc, the ionizing flux is phot cm-2 s-1. We can relate this to the H surface brightness through the emission measure where
| (11) |
which is an integral of H recombinations along the line of sight multiplied by a filling factor .222 cm-6 pc is equivalent to 2 erg cm-2 s-1 arcsec-2 (cgs) for a plasma at 104 K. If we assume that the absorbing cloud along the minor axis is optically thick, we can relate this directly to an H surface brightness in cgs units such that
| (12) |
where is the distance to the central source (Bland-Hawthorn et al. 1998, Appendix). Therefore the expected H surface brightness at 1 kpc is roughly cgs for the AGNs, and cgs for the starbursts. (The difference here relates to the different mean bolometric luminosities between the two classes of objects.) These predictions are an order of magnitude brighter than what is seen in our objects (Table 4), with the possible exception of the AGN IC 5063 where the minor axis filaments are very bright. The higher predicted values may be due to a combination of several factors: (i) the emitting regions have a small filling factor (), (ii) some dust is mixed in with the filaments (cf. Cecil et al. 2001), and (iii) for the AGN/starburst fraction of the bolometric luminosity.
Thus we find that both AGNs and starbursts have the capability to ionise much of the extended gas filaments observed far along the minor axis, assuming that the radiation is not scattered or absorbed en route. So we arrive at an important conclusion. The distinction between starburst and AGN outflow IDDs is one of timescale, assuming that the wind mechanism is not too dissimilar between the two sources (e.g. Veilleux et al. 2005). The time evolution of UV photon production must be radically different in both cases. To explore this issue further, we examine more closely how the energy is deposited into the surrounding medium.
4.2. Time evolution of UV and mechanical luminosity in a starburst
The starburst phase in a galaxy’s life is a spectacular phenomenon that can be observed to very high redshifts. Just how the formation of hundreds of millions of stars can be triggered over the central regions of galaxies in a dynamical time remains an open issue. What is well known is that the high mass stars evolve rapidly, giving off prodigious amounts of UV radiation initially before entering into the supernova phase, whereupon a huge amount of mechanical energy is deposited into the ISM (Leitherer et al. 1992).
In Fig. 29, we show the results from running Starburst99 with a conventional initial mass function (IMF) for both instantaneous and continuous star formation models. We show the time evolution of the ionizing and mechanical luminosities arising from the starburst. Two upper mass cut-offs are presented in order to illustrate the important contribution of the highest mass stars. In Fig. 29(a), the rapid drop in UV production at 10 Myr is evident, as is the rise of mechanical output from supernovae beyond here. This corresponds to stars more massive than 13 evolving off the main sequence to become supernovae.
Fig. 29(a) can readily account for why stellar photoionisation does not dominate over shock ionisation. Thus, we conclude that the ionisation timescale () indicated by starburst winds is such that Myr. Fig. 29(b) effectively rules out the continuous star formation model, at least for the starbursts in our sample. The model predicts that stellar photoionisation is detectable at all times contrary to what we observe.
In the next section, we show that the predicted mechanical luminosity in the instantaneous star formation model is more than enough to explain the observed shock ionisation. Indeed, we argue that Fig. 29 dates the observed starburst wind phenomenon in the range 10 to 40 Myr. A more precise age will depend on how the starburst region evolved early in its life (Suchkov et al. 1994; Cooper et al. 2008). We discuss this issue in more detail below.
4.3. Time evolution of UV and mechanical luminosity in an AGN
We must now explain the dominance of AGN photoionisation of the filaments in AGN wind objects. There are few reliable constraints on the long-term temporal evolution of accretion-disk radiation fields. Like starbursts, AGNs clearly display all the hallmarks of duty cycles, bursts and outflows over the course of their lifetimes (Soltan 1983; Cavaliere & Padovani 1990). Most galaxies appear to have central massive black holes, but only a few percent can be classified as AGNs. The most likely explanation is that almost any galaxy can display AGN activity if its nuclear regions experience substantial gas accretion from outside.
But we arrive at the long-standing debate on what can be uniquely attributed to the AGN as compared to, say, circumnuclear star-forming activity (Terlevich et al. 1985). After all, the gas inflow that triggers the former can just as easily give rise to the latter. These activities are commonly seen in close proximity, in particular, in Seyfert galaxies. We address both of these issues now, i.e. why the AGN dominates the photoionisation of the wind filaments, and whether our conclusions are affected by the presence of the circumnuclear starburst.
A reasonable AGN scenario is that the activity is initially triggered by a gas dump, followed by a slow decline in the fuelling process (e.g. Norman & Silk 1983) as the gas settles down within the nuclear potential well. We assume an exponential model for the UV output from an AGN such that
| (13) |
where is the maximum fraction of the bolometric luminosity that the AGN achieves over the lifetime of the activity with half life . We further restrict this relation using the following normalization:
| (14) |
where LL denotes the Lyman limit ( 13.6 eV) and the RHS is given by equation 5. In practice, this normalization for and is difficult to do properly because our observations constitute an instantaneous snapshot, rather than the time-averaged behavior of its properties. Of course, the same holds true for starburst activity. In principle, IFU studies of a large sample of AGNs and starbursts could provide accurate measurements of and and therefore provide strong constraints on for both AGNs and starbursts.
If we integrate equation 13 over time ( Myr), subject to the normalization in equation 14, we arrive at the important result that . The normalization ensures that a range of AGN models depending on and produce the same ionizing radiation field averaged over the lifetime of the source. In Fig. 30, we superimpose four such models on the instantaneous starburst model in Fig. 29.
As already mentioned, essentially all of our AGN sources show appreciable circumnuclear star formation. Since AGN photoionisation is clearly dominant over stellar photoionisation in all of our AGN sources, the predicted surface brightness values effectively rule out AGN exponential timescales below 10 Myr. If the AGN UV radiation field is “beamed” along the wind axis, in the sense that the AGN source is strongly anisotropic, then shorter AGN timescales are possible. But the dynamical timescale of the wind discussed in the next section argues against this interpretation. Furthermore, we have been unable to find any reliable evidence for a UV boost along the wind axis in AGNs.
But a question remains. In Fig. 30, note how the starburst mechanical luminosity can dominate over the AGN UV luminosity beyond 10 Myr, assuming the mass/energy input can be efficiently converted to ionizing radiation. Why do we therefore not see the signatures of shocks in AGN-driven winds? Shocks are seen in starburst winds because the central ionizing source fades rapidly early in the evolution of the wind. But this problem only arises if we assume that the mechanical energy in the AGN sources is supplied with a long delay as for starburst-driven winds because, for example, the AGN wind is assisted by a circumnuclear starburst. The observations may therefore indicate that the AGN-driven winds are fundamentally different from starburst-driven winds. In this scenario, the mechanical energy is supplied by the accretion disk immediately, but the shock ionizing luminosity never exceeds the luminosity of the central accretion disk.
We now consider the shock ionisation observed in starburst-driven winds. We find that only a fraction of the available mechanical luminosity must be used in shock-exciting the gas, either because the process is inefficient or because the filling factor of the extended filaments is lower than unity.
4.4. Dynamical timescale of a large-scale wind
Here we address the dynamical timescale of galactic winds before going onto derive levels of optical emission powered by shock ionisation. Once the starburst or AGN fires up, it begins to deposit energy into its surroundings. This largely mechanical energy over-pressurizes a circumnuclear cavity of hot gas that reaches a temperature
| (15) |
where is the efficiency of turning mechanical energy into heat, and is the mass-loading factor (Veilleux et al. 2005). This ratio measures the total mass of heated gas to the mass that is directly ejected by SNe and stellar winds or by the AGN. Most galactic winds appear to entrain gas from the interstellar medium as shown by the rotation of this material about the flow axis (see Veilleux et al. (2005) for a detailed discussion). The entrained gas, which can easily dominate the wind mass, is accounted for with typically larger than unity (e.g. Suchkov et al. 1994).
The central cavity is too hot to cool efficiently and so builds up a pressure
| (16) |
where is the radius of the energy injection zone. This pressure can significantly exceed the pressure of the undisturbed ISM. The hot cavity then evolves like a stellar wind-blown bubble (e.g., Castor, McCray, & Weaver 1975; Koo & McKee 1992a,b). As hot gas expands through the sonic radius, it cools adiabatically. Beyond the sonic radius, the wind drives a shock into the surrounding ISM and starts to sweep up a shell of shocked gas, a process that gradually slows the bubble to much less than the wind velocity. This marks the end of the adiabatic “free expansion” phase, whose duration is set by the mechanical luminosity of the starburst or AGN and the original density of the ISM. After free expansion, the system develops distinct concentric zones from the centre moving outwards due to the strong shocks (Cooper et al 2008; Dopita & Sutherland 1996; Weaver et al. 1977).
Energy-conserving bubbles. If radiative losses of the overall system are negligible, the expanding bubble is energy-conserving. In that case, the radius and the velocity of the expanding shell of shocked ISM are given by (Castor et al. 1975; Weaver et al. 1977)
| (17) |
and therefore
| (18) | |||||
| (19) |
where is the age of the bubble in Myr, is the ambient density in cm-3. By convention, we use for the mechanical luminosity of the wind in units of 1044 erg s-1 ().
Momentum-conserving bubbles. If radiative losses are significant, momentum conserving bubbles decelerate somewhat faster such that (e.g., Avedisova 1972; Steigman, Strittmatter, & Williams 1975; Koo & McKee 1992a,b). For the galaxies we are considering here, the inferred timescales are roughly comparable (see Table 5).
| energy conserving | momentum conserving | |||
|---|---|---|---|---|
| 1 | 0.6 | 871 | 0.5 | 871 |
| 2 | 1.7 | 549 | 2.0 | 616 |
| 3 | 3.4 | 419 | 4.4 | 503 |
| 4 | 5.6 | 346 | 7.8 | 435 |
| 5 | 8.1 | 298 | 12.2 | 390 |
In most simulations to date, the terminal velocity of gas entrained by a galactic wind is km s-1 (e.g. Suchkov et al. 1994; Cooper et al. 2008). Proper comparisons are difficult because the models deal with clumpiness in the entrained gas, which the scaling relations above do not. Chevalier & Clegg (1985) provide a useful formula for the terminal velocity of a cloud accelerated by a wind (see also Strickland & Heckman 2008):
| (20) |
where and are the initial distance and column density of the cloud. (This formula is specific to the “constant velocity” phase of the wind before it breaks free of the confining medium.) The factors and account for the fractions of supernova energy and mass respectively that work to heat the diffuse gas. These authors explore fractions in the range 0.1 to 1 and ultimately favour the high end of this range. In any event, the dynamical time of the wind is roughly Myr (see also Cooper et al. 2008) which is considerably longer than the cooling time of the entrained gas.
The wind timescale is comparable to the dynamical time of the starburst region itself, but is up to an order of magnitude less than the ionisation timescale established by our analysis above. This is a striking result that suggests a substantial delay ( Myr) after the onset of star formation before the conditions for a large-scale wind are properly established.
4.5. Shock ionisation in a large-scale wind
In the starburst wind objects, the overall ionisation properties are consistent with shock processes (see §3.1). A simple calculation can validate this. From Dopita & Sutherland (1996), the total shock luminosity is
| (21) |
These authors find that about 50% of the mechanical energy is converted into energy capable of ionizing gas. Assuming there is sufficient gas to soak up the ionizing photons, one can derive a useful relation for the H luminosity, such that
| (22) |
We now derive a canonical H surface brightness for shock-ionised filaments associated with the galactic wind. For a galaxy at a distance of Mpc, the observed H flux from the shock is
| (24) | |||||
which assumes, consistent with Dopita & Sutherland (1996), that only a single shock surface is observed with no correction for possible limb brightening.
The surface brightness of shocked emission at 1 kpc follows:
| (25) |
The pre-shock density normalization assumes that the halo gas in starburst galaxies follows an isothermal distribution (e.g. Cooper et al. 2008) normalised to a pre-shock density of cm-3 at 1 kpc consistent with material swept up in a wind (q.v. Chevalier & Clegg 1985; see below). Post-shock densities inferred from the [SII] doublet (e.g. McCarthy et al. 1987) are typically in the low density limit ( cm-3) beyond pc.
While equation 25 has a strong dependence on , the shock speed is well constrained by observation. Some authors have associated the terminal velocity of entrained gas with the shock velocity induced by the wind (e.g. Maloney 1999). But the levels of ionisation tell a different story. The strong [NII]/[OIII] signal favours shock velocities of order 100 km s-1 (e.g. Shopbell & Bland-Hawthorn 1998; Veilleux & Rupke 2002). This is supported by the soft x-ray emission which appears to be powered by similar shock velocities. How are we to understand this?
In our picture, the fast hot wind accelerates denser gas to a terminal velocity. These clouds are ram-pressure confined by the fast wind. We therefore write down a simple equation for shocks driven into the clouds such that
| (26) |
where and are the wind density and velocity.
Strickland & Heckman (2009) have recently conducted an excellent re-evaluation of Chevalier & Clegg’s original model for the M82 wind. The free-flowing or break-out wind speeds can be as high as km s-1. For our adopted values of , and above, we can balance equation 26 with cm-3, a factor of a few higher than the canonical solution at 1 kpc presented by Strickland & Heckman (2009). We consider this to be broadly consistent given the uncertainties. In our simple analysis, the shock velocity is always several times less than the terminal velocity of clouds caught in the flow.
Our simple model leads to an H surface brightness of cgs at 1 kpc. This approximate value is comparable to what is presented in Table 4 for the starburst galaxies. In principle, the filling factor of the shocked material can be low (), and there will be moderate levels of extinction internal to the entrained gas (i.e. mag; Cecil et al. 2001). But in principle, a moderately fast shock could account for the observed, extended line emission.
We note that the H surface brightness in equation 25 is comparable to the observed AGN surface brightness in Table 4, but much fainter than the predicted AGN surface brightness in equation 12. This may indicate that the filling factor in the wind filaments is . Fortunately, a discussion of the relative merits of different ionisation sources does not require knowledge of the gas filling factor . A lower filling factor affects the theoretical prediction identically in equations 12 and 25, and usefully brings our models into line with the observations, at least in principle. Thus, if AGN winds involve similar processes to starburst winds, we would not expect shocks to outshine direct photoionisation from the AGN, consistent with our observations.
We have already argued that shocks outshine direct stellar photoionisation from the starburst because the young starburst has dimmed tremendously by the time the wind breaks out. Close to the disk, we may still expect stellar photoionisation to dominate over shocks owing to large-scale star formation in the disk (Bland-Hawthorn & Maloney 1999). But much beyond 300 pc or so, wind-driven shocks can dominate the ionisation, as observed in our sample. If we invoke a lower filling factor consistent with AGN winds, we can readily explain NGC 3628, but now NGC 253 and NGC 1482 appear overluminous. Indeed, a careful study of Table 4 reveals the need to change over the range (0.1,1) to match our model to all of the observations. This may indicate that our model is oversimplified and needs to include a gas filling factor, or even a correction for internal extinction (although this is found to be typically less than 10% from the SPIRAL observations in the brightest regions). We note two things: (i) the inferred filling factors are not unreasonable and can be directly measured in principle; (ii) alternatively, the inferred extinction corrections are plausible, and these can also be directly inferred from the Balmer decrement with data of sufficient sensitivity.
5. Sequence of events: the birth and evolution of galactic winds
We conclude with a “big picture” model of the starburst wind phenomenon. Our purpose is to provide a physical explanation for the delay before the galactic wind gets going. We believe that this simple model explains the broadest features of our new SPIRAL observations. Therefore the stages of evolution for a galactic wind are as follows:
(1) Stars are born in dense molecular clouds whereupon the hot massive stars produce a strong UV radiation field (Lada & Lada 2003);
(2) The mean free path of Lyman continuum photons is greatly extended by stellar winds (and radiation pressure) that blow bubbles into the surrounding ISM. (Good discussions of this process are to be found in Castor et al. 1975; Weaver et al. 1977; MacLow & McCray 1988; Tomisaka & Ikeuchi 1988.) The intense UV radiation ionizes any pre-existing intracloud medium but this may have been cleared out by an earlier wind.
(3) The over-pressured warm gas evaporated from the surfaces of dense clouds helps to fill the wind-blown “voids” and intracloud region. The connection between the evaporating cloud skins and the intracloud wind material may help the wind to entrain denser gas from these same clouds (Cooper et al. 2008).
(4) The bulk of the supernova ejecta arises after 8-10 Myr (Fig. 29; Leitherer et al. 1992). As noted by others (e.g. Chevalier & Clegg 1985), the ejecta ultimately thermalizes the diffuse material which escapes as a wind; any shock heating of the denser medium escapes as infrared radiation (Strickland & Stevens 2000). The UV intensity declines dramatically since many of the high-mass stars have now exploded.
Thus we are led to an important conclusion. The large-scale wind cannot become established until vast quantities of warm diffuse gas are dislodged from the surfaces of dense clouds by UV evaporation. The ionised material with a sufficiently long cooling time is then mechanically heated by the supernova mass/energy input. It is therefore not surprising that, by the time the wind gets going, most of the short-lived massive stars have faded or disappeared. We would therefore not expect to see a strong signature of stellar photoionisation in the extended wind filaments if the starburst phenomenon arises from a single burst of star formation. Our new observations may provide the strongest evidence yet that starbursts truly are impulsive events. The fact that the signature of AGN photoionisation is clearly visible in the wind filaments argues that the accretion-disk UV timescale is considerably longer than the starburst timescale. Furthermore, unlike the starburst, the mechanical energy input must have occurred early in the life of the AGN, presumably at a time when jets can also be launched. We argue that our observations are a testament to this simple picture.
Conversely, if there are starburst sources where stellar photoionisation does dominate at large radial distances (cf. Shopbell & Bland-Hawthorn 1998), we anticipate that the circumnuclear regions in these sources are characterised by an extended episode of star formation (i.e. continuous star formation) due to an extended period of fuelling and accretion (e.g. sustained merger activity).
6. Summary
The role of mass/energy feedback and recycling in galactic winds over cosmic time is very poorly understood. In particular, we are far from a detailed understanding of how gas accretion to the circumnuclear regions fuels local star formation and nuclear activity. So what can we say?
The galaxy wind phenomenon is well established and its influence can be detected in the highest redshift sources (Heckman et al. 1990; Strickland et al. 2004b; Veilleux et al. 2005). Galactic winds are associated with both star formation (e.g. starbursts), nuclear activity (e.g. FR I radio sources), and a combination of star formation and nuclear activity (e.g. Seyfert galaxies). But this raises many questions. How do winds get going, how energetic are they, how long do they last, and what is their role in galaxy evolution? Do we arrive at similar answers for AGN-driven winds and starburst-driven winds?
Here we are able to shed light on the first question (§5). We have carried out the most detailed and extensive survey to date of extended plasma gas in active galaxies. We constructed ionisation diagnostic diagrams to study the nature of the emission in ten galaxies. We find that the wholly starburst-powered sources have extended emission that is largely consistent with shock ionisation. This sets an important lower limit on the time at which the starburst phenomenon began ( Myr). At this time, the stellar UV ionisation sources have long since faded from view which essentially rules out a continuous star formation model for the nucleus, at least in our limited subset of starburst galaxies. An interesting question is whether we can identify those sources that are in an early starburst phase and before the onset of the large-scale wind.
The second question presents difficulties for us, at least in the present analysis. In all of our AGN sources, there is evidence of circumnuclear star formation: the present data are unable to establish which source of activity is responsible for the wind. In future studies, it may be possible to shed light on this question in one of two ways. X-ray spectroscopy can, in principle, establish the [/Fe] abundance ratio of the outflowing gas. Enhanced abundances implicate the presence of SN II, and therefore the central importance of the starburst in driving the outflow. Such an effect may have already been seen in dwarf starburst galaxies (Martin et al. (2002), Ott, Walter & Brinks (2005)), but we are unaware of similar studies in Seyfert outflow sources. This is an important avenue for future research.
An alternative approach is to carefully trace the pressure changes over the circumnuclear regions down to small galactic radii. O’Connell & Mangano (1978) noticed that the gas densities, as measured from the [SII] doublet, appear to decrease along the minor axis of M82. Chevalier & Clegg (1985) interpreted this observation as a change of wind pressure in a starburst-driven wind. This idea has been explored extensively by Heckman et al. (1990) who used the [S ii] doublet to measure the electron densities as a function of radius in a subset of starburst galaxies. In M82, high pressures have been inferred from the [S iii] doublet (Houck et al. (1984), Smith et al. (2006)), from fine structure lines in the far infrared (Lugten et al. 1986; Duffy et al. 1987), and from the non-thermal radio continuum (Schaaf et al. 1989). After certain assumptions, pressures can be inferred by combining observations of radio recombination lines and the associated free-free emission (Rodriguez & Chaisson 1980; Seaquist, Bell & Bignell 1985). The intrinsically higher resolution of linked radio receivers should allow the pressure profile to be traced to the smallest VLBI spatial scales. Naively, the pressure profile can be relatively steep closer to the black hole compared to an anticipated flatter profile across the energy injection region of a starburst (Chevalier & Clegg 1985). Thus, we may be able to distinguish between AGN-powered vs. starburst-powered momentum by measuring the gas pressure as a function of galactocentric radius. We leave this to future work.
In the case of the AGN sources, we find that the extended line emission is always powered by the accretion disk rather than by shock ionisation. Some of these sources are clearly associated with central starbursts that may well contribute momentum to the outflow in which case age-dating the onset of the outflow is more problematic. In the case of the AGN-driven outflow, these could have commenced as recently as 10 Myr or so, although if the starburst dominates, the longer timescale is preferred. The latter case is interesting because it would indicate that the AGN source has a lifetime approaching 100 Myr, and that the amount of gas converted to energy is of order 10.
In the next paper, we combine the ionisation diagnostics with the emission-line kinematics to learn more about the energetics of the outflowing gas. The integral field spectrograph approach is clearly very powerful for studying extended emission line sources. We stress that our methods for deriving and comparing ionisation and dynamic timescales can be extended to a wider class of active galaxies (e.g. quasar hosts), mergers (e.g. ULIRGs) and star-forming galaxies (e.g. dwarf irregulars). It will be interesting to compare the inferred timescales with the star formation histories extracted from circumnuclear stellar populations. In high-redshift galaxies where stellar populations are harder to observe, the ionisation diagnostics may provide key information. In the Appendix, we include a brief discussion about how future studies can be improved to advance this work further.
References
- Annibali, Greggio, Tosi et al. (2003) Annibali, F., Greggio, L., Tosi, M., Aloisi, A., Leitherer, C. 2003, AJ, 126, 2752
- Avedisova (1972) Avedisova, V.S., 1972, SvA, 15, 708
- Baldwin, Phillips & Terlevich (1981) Baldwin J.A, Phillips M.M, & Terlevich R.1981 PASP 93 5
- Baldwin, Phillips & Terlevich (1981) Baldwin J.A, Phillips M.M, & Terlevich R.1981 PASP 93 817
- Begelman & Bland-Hawthorn (1997) Begelman, M.C. & Bland-Hawthorn, J., 1997, Nature, 385, 22
- Bergeron, Durret & Boksenberg (1983) Bergeron, J., Durret, F., Boksenberg, A, 1983, A&A, 127, 322
- Blanco, Graham, Lasker & Osmer (1975) Blanco, V.M., Graham, J.A., Lasker, B.M., Osmer, P.S., 1975 ApJ, 198, L63
- Bland, Taylor & Atherton (1987) Bland, J., Taylor, K., Atherton, P.D., 1987 MNRAS, 228, 595
- Bland & Tully (1988) Bland, J. & Tully, B., 1988, Nature, 334, 43
- Bland-Hawthorn, Wilson & Tully (1991) Bland-Hawthorn, J., Wilson, A.S., Tully, R.B., 1991, ApJ, 371L, 19
- Bland-Hawthorn & Cohen (2003) Bland-Hawthorn, J., & Cohen, M. 2003, ApJ, 582, 246
- Bland-Hawthorn & Kedziora-Chudczer (2003) Bland-Hawthorn, J., & Kedziora-Chudczer, L., 2003, PASA, 20, 242
- Bland-Hawthorn & Maloney (1999) Bland-Hawthorn, J., & Maloney, P.R., 1999, ApJ, 510L, 33
- Bland-Hawthorn et al. (1998) Bland-Hawthorn, J., Veilleux, S., Cecil, G.N., Putman, M.E., Gibson, B.K., Maloney, P.R., 1998 MNRAS, 299, 611
- Burbidge & Burbidge (1960) Burbidge, E.M., Burbidge, G.R., 1960, ApJ, 132, 30
- Buzzoni (2005) Buzzoni, A., 2005, MNRAS, 361,725,
- Carretta et al. (2007) Carretta, E., Bragaglia, A., & Gratton, R. 2007, A&A, 473, 129
- Castor, McCray & Weaver (1975) Castor, J., McCray, R., Weaver, R., 1975, ApJ, 200L, 107
- Cavaliere & Padovani (1988) Cavaliere, A., & Padovani, P., 1988, ApJ, 333L 33
- Cecil, Bland & Tully (1990) Cecil, G., Bland, J., Tully, R.B., 1990, ApJ, 355, 70
- Cecil, Bland-Hawthorn & Veilleux (2002) Cecil, G., Bland-Hawthorn, J., Veilleux, S., 2002, ApJ, 576, 745
- Cecil et al. (2001) Cecil, G., Bland-Hawthorn, J., Veilleux, S., Filippenko, A.V., 2001 ApJ, 555, 338
- Cen & Ostriker (1999) Cen, R., & Ostriker, J. P. 1999, ApJ, 514, 1
- Chevalier & Clegg (1985) Chevalier, R.A., Clegg, A.W. 1985 Natur 317 44
- Coccato et al. (2004) Coccato, L., Corsini, E.M., Pizzella, A., Morelli, L., Funes, J.G., Bertola, F., 2004, A&A, 416, 507
- Colbert, Wilson & Bland-Hawthorn (1994) Colbert, E.J.M., Wilson, A.S., & Bland-Hawthorn, J., 1994, ApJ, 436, 89
- Colina, Sparks & Macchetto (1991) Colina, L.; Sparks, W. B.; Macchetto, F. 1991ApJ…370..102C
- Collins et al. (2007) Collins, J. A., Shull, J. M., & Giroux, M. L. 2007, ApJ, 657, 271
- Condon et al. (1982) Condon, J.J., Condon, M.A., Gisler, G., Puschell, J.J., 1982 ApJ, 252 102
- Cooper et al. (2008) Cooper, J.L., Bicknell, G.V., Sutherland, R.S., Bland-Hawthorn, J., 2008, ApJ, 674, 157
- Dalcanton (2007) Dalcanton, J. J. 2007, ApJ, 658, 941
- Davé et al. (2008) Davé, R., Oppenheimer, B. D., & Sivanandam, S. 2008, MNRAS, 391 110
- Demoulin & Burbidge (1970) Demoulin, M.H., Burbidge, E.M., 1970, ApJ, 159, 799
- de Zeeuw et al. (2002) de Zeeuw, P.T., Bureau, M., Emsellem, E., Bacon, R., Carollo, C.M., Copin, Y., Davies, R.L., Kuntschner, H., et al., 2002, MNRAS, 329 513
- Dopita & Sutherland (1996) Dopita, M.A., Sutherland, R.S., 1996, ApJS, 102 161
- Duffy et al. (1987) Duffy, P.B., Erickson, E.F., Haas, M.R., Houck, J.R., 1987, ApJ, 315, 68
- Edmunds & Pagel (1982) Edmunds, M.G., & Pagel, B.E.J., 1982 MNRAS 198 1089
- Efstathiou (2000) Efstathiou, G. 2000, MNRAS, 317, 697
- Erb et al. (2006) Erb, D. K. et al.2̇006, ApJ, 647, 128
- Fall (2002) Fall, S. M. 2002, in Disks of Galaxies: Kinematics, Dynamics and Perturbations, ASP Conf. Series, Vol. 275, ed. E. Athanassoula, A. Bosma, & R. Mujica (San Francisco: ASP), p. 389
- Fabbiano, Heckman & Keel (1990) Fabbiano, G., Heckman, T., Keel, W.C., 1990, ApJ, 355, 442
- Flohic et al. (2006) Flohic, H.M.L.G., Eracleous, M., Chartas, G., Shields, J.C., Moran, E.C., 2006, ApJ, 647, 140
- Forbes, Boisson & Ward (1992) Forbes, D.A., Boisson, C., & Ward, M.J., 1992, MNRAS, 259, 293
- Forbes & Norris (1998) Forbes, D.A., & Norris, R.P. 1998, MNRAS, 300, 757
- Freeman et al. (1977) Freeman, K.C., Karlsson B., Lynga, G., Burrell, J.F., van Woerden, H., Goss, W.M., Mebold, U., 1977, A&A, 55, 445
- Fox et al. (2005) Fox, A. J., Wakker, B. P., Savage, B. D., Tripp, T. M., Sembach, K. R., & Bland- Hawthorn, J. 2005, ApJ, 630, 332
- Genzel et al. (2008) Genzel, R., Burkert, A., Bouché, N., Cresci, G., Förster Schreiber, N.M., Shapley, A., Shapiro, K., Tacconi, L.J. et al., 2008, ApJ, 687, 59
- Greenhill et al. (2003b) Greenhill, L.J., Booth, R.S., Ellingsen, S.P., Herrnstein, J.R., Jauncey, D.L., McCulloch, P.M., Moran, J.M., Norris, R.P., Reynolds, J.E., Tzioumis, A.K. 2003, ApJ, 590, 162
- Greenhill et al. (2003a) Greenhill, L.J., Kondratko, P.T., Lovell, J.E.J., Kuiper, T.B.H., Moran, J.M., Jauncey,D.L., Baines, G.P., 2003 ApJ, 582L, 11
- Greve (2004) Greve, A., 2004, A&A, 416, 67
- Grimes, Heckman, Aloisi et al. (2009) Grimes, J.P., Heckman, T., Aloisi, A., Calzetti, D., Leitherer, C., Martin, C.L., Meurer, G., Sembach, K., Strickland, D. 2009, ApJS, 181, 272
- Hameed & Devereux (1999) Hameed, S., Devereux, N., 1999, AJ, 118, 730
- Heckman, Armus & Miley (1990) Heckman, T.M, Armus, L.M., Miley, G.K., 1990, ApJS, 74, 833
- Heckman et al. (1998) Heckman, T.M., Robert., Leitherer, C., Garnett, D.R., van der Rydt, F., 1998, ApJ, 503, 646
- Hjelm & Lindblad (1996) Hjelm, M., Lindblad, P.O., 1996, A&A, 305, 727
- Holtzman et al. (1993) Holtzman, J. A. et al., 1993, AJ, 106, 1826
- Hoopes et al. (2005) Hoopes, C.G., Heckman, T.M., Strickland D.K., Seibert, M. Madore, B.F., Rich, R.M., Bianchi, L., Gil de Paz, A., 2005 ApJ, 619L 99
- Houck et al. (1984) Houck, J.R., Shure, M.A., Gull, G.E., Herter, T., 1984, ApJ, 287L, 11
- Hunter, Hawley & Gallagher (1993) Hunter, D.A., Hawley, W.N., & Gallagher, J.S. iii, 1993, AJ, 106, 1797
- Irwin & Sofue (1996) Irwin, J.A., Sofue, Y., 1996, ApJ, 464, 738
- Israel (1998) Israel, F.P., 1998, A&ARv, 8 237
- Jiménez-Bailón et al. (2005) Jiménez-Bailón, E., Santos-Lleó, M., Dahlem, M., Ehle, M., Mas-Hesse, J.M., Guainazzi, M., Heckman, T.M., Weaver, K.A. 2005, A&A, 442, 861
- Junkes et al. (1995) Junkes, N., Zinnecker, H., Hensler, G., Dahlem, M., Pietsch, W., 1995, A&A, 294, 8
- Jöersäeter et al. (1984) Jöersäeter, S. Peterson, C.J., Lindblad, P.O., Boksenberg, A., 1984, A&AS, 58, 507
- Keeney et al. (2006) Keeney, B. A., Danforth, C. W., Stocke, J. T., Penton, S. V., Shull, J. M., & Sembach, K. R. 2006, ApJ, 646, 951
- Kewley et al. (2001) Kewley L.J., Dopita M.A., Sutherland R.S., Heisler C.A. & Trevena J. 2001 ApJ 556 121
- Kirby et al. (2008) Kirby, E. N., Simon, J. D., Geha, M., Guhathakurta, P., & Frebel, A. 2008, ApJ, 685, L43
- Krabbe, Sternberg & Genzel (1994) Krabbe, A., Sternberg, A., Genzel, R., 1994, ApJ, 425, 72
- Krajnović, Sharp & Thatte (2007) Krajnović, D., Sharp, R. & Thatte, N., 2007, MNRAS, 374, 385
- Komossa et al. (2003) Komossa, S., Burwitz, V., Hasinger, G., Predehl, P., Kaastra, J.S.,, Ikebe, Y. 2003 ApJ 582L 15
- Koo & McKee (1992a) Koo, B.-C., & McKee, C.F., 1992a, ApJ, 388, 93
- Koo & McKee (1992b) Koo, B.-C., & McKee, C.F., 1992b, ApJ, 388, 103
- Kraft et al. (2008) Kraft, R.P., Hardcastle, M.J., Sivakoff, G.R., Jordán, A., Nulsen, P.E.J., Birkinshaw, M., Forman, W.R., Jones, C., et al. 2008 ApJ, 677L 97
- Lada & Lada (2003) Lada, C.J., & Lada, E.A., 2003, ARA&A, 41, 57
- Leitherer, Robert & Drissen (1992) Leitherer, C., Robert, C., Drissen, L., 1992, ApJ, 401, 596 A&A, 467, 283
- Lehnert & Heckman (1996) Lehnert, M.D., & Heckman, T.M. 1996, ApJ, 462, 651
- Lugten et al. (1986) Lugten, J.B., Watson, D.M., Crawford, M.K., Genzel, R., 1986, ApJ, 311L, 51
- Laurent et al. (2000) Laurent, O., Mirabel, I.F., Charmandaris, V., Gallais, P., Madden, S.C., Sauvage, M., Vigroux, L., Cesarsky, C., 2000, A&A, 359, 887
- Lutz et al. (2002) Lutz, D., Maiolino, R., Moorwood, A.F.M., Netzer, H., Wagner, S.J., Sturm, E., Genzel, R., 2002, A&A, 396, 439
- Mac Low & McCray (1988) Mac Low, M.-M.& McCray, R., 1988, ApJ, 324, 776
- Madau et al. (2001) Madau, P., Ferrara, A., & Rees, M. J. 2001, ApJ, 555, 92
- Maloney (1999) Maloney, P.R., 1999, Ap&SS, 266, 207
- Martin (2006) Martin, C.L., 2006, ApJ, 647, 222
- Martin et al. (2002) Martin, C. L., Kobulnicky, H. A., & Heckman, T. M. 2002, ApJ, 574, 663
- Matt et al. (2000) Matt, G., Fabian, A.C., Guainazzi, M., Iwasawa, K., Bassani, L., Malaguti, G., 2000, MNRAS318, 173
- McCarthy, van Breugel & Heckman (1987) McCarthy, P.J., van Breugel. W., Heckman, T., 1987 AJ, 93, 264
- Meurer, Freeman, Dopita & Cacciari (1992) Meurer, G.R., Freeman, K.C., Dopita, M.A.. Cacciari C., 1992, AJ, 103, 60
- Morganti et al. (2007) Morganti, R., Holt, J.,Saripalli, L., Oosterloo, T.,A., & Tadhunter C.N. 2007 A&A 476 723
- Morganti, Oosterloo & Tsvetanov (1998) Morganti, R., Oosterloo, T., Tsvetanov, Z, 1998, AJ, 115, 915
- Mueller-Sánchez, Davies, Eisenhauer et al. (2006) Mueller-Sánchez, F., Davies, R.I., Eisenhauer, F., Tacconi L.J., Genzel, R., Sternberg, A., 2006, A&A, 454, 481
- Norman & Silkk (1983) Norman, C., Silk, J., 1983, ApJ, 266, 502
- Navarro & White (1994) Navarro, J. F., & White, S. D. M. 1994, MNRAS, 267, 401
- Nicholson, Bland-Hawthorn & Taylor (1992) Nicholson, R.A., Bland-Hawthorn, J.; Taylor, K., 1992 ApJ, 387, 503
- O’Connell & Mangano (1978) O’Connell, R.W., & Mangano, J.J., 1978, ApJ, 221, 62
- Oliva et al. (1994) Oliva, E., Salvati, M., Moorwood, A.F.M., Marconi A., 1994, A&A, 288, 457
- Osterbrock (1988) Osterbrock, D.E., “Astrophysics of Gaseous Nebulae and Active Galactic Nuclei”, University Science Books
- Ott, Walter & Brinks (2005) Ott, J., Walter, F., & Brinks, E., 2005, MNRAS, 358, 1453
- Persic et al. (1998) Persic, M., Mariani, S., Cappi, M., Bassani, L., Danese, L., Dean, A.J., di Cocco, G., Franceschini, A., et al., 1998, A&A, 339L 33
- Peterson, Dickens & Cannon (1975) Peterson, B.A., Dickens, R.J., Cannon, R.D.m 1975, PASAu, 2, 366
- Phillips (1993) Phillips, A.C., 1993, AJ, 105, 486
- Phillips et al. (1983) Phillips, M.M., Edmunds, M.G., Pagel, B.E.J., Turtle, A.J., 1983, MNRAS, 203, 759
- Pogge & Eskridge (1987) Pogge, R.W. & Eskridge, P.B., 1987, AJ, 93, 291
- Ptak, Heckman, Levenson et al. (2003) Ptak, A., Heckman, T., Levenson, N.A., Weaver, K., Strickland, D., 2003, ApJ, 592, 782
- Quillen et al. (2006) Quillen, A.C., Brookes, M.H., Keene, J., Stern, D., Lawrence, C.R., Werner, M.W., 2006,ApJ, 645, 1092
- Quillen, Graham & Frogel (1993) Quillen, A.C., Graham, J.R., Frogel, J.A., 1993, ApJ, 412, 550
- Rand (1998) Rand, R.J., 1998, ApJ, 501, 137
- Rice et al. (1988) Rice, W., Lonsdale, C.J., Soifer, B.T., Neugebauer, G., Kopan, E.L., Lloyd, L.A., de Jong, T., Habing, H.J., 1988 ApJS, 68, 91
- Rieke, Lebofsky, Thompson et al. (1980) Rieke, G.H., Lebofsky, M.J., Thompson, R.I., Low, F.J., Tokunaga, A.T., 1980, ApJ, 238, 24
- Robertson et al. (2006) Robertson, B. et al. 2006, ApJ, 645, 986
- Rodriguez & Chaisson (1980) Rodriguez, L.F. & Chaisson, E.J., 1980, ApJ, 238, 41
- Ryan-Weber et al. (2006) Ryan-Weber, E. V., Pettini, M., & Madau, P. 2006, MNRAS, 371, L78
- Saunders et al. (2004) Saunders, W., Bridges T., Gillingham, P., et al., 2004, SPIE, 5492, 389
- Sakamoto et al. (2006) Sakamoto, K., Ho, Paul T.P., Iono, D., Keto, E.R., Mao, R., Matsushita, S., Peck, A.B., Wiedner, M.C., Wilner, D.J., Zhao, J. 2006 ApJ, 636, 685
- Sandqvist, Jöersäeter & Lindblad (1995) Sandqvist, A., Jöersäeter, S., Lindblad, P.O., 1995, A&A, 295, 585
- Schaaf et al. (1989) Schaaf, R., Pietsch, W., Biermann, P.L., Kronberg, P.P., Schmutzler, T., 1989, ApJ, 336, 722
- Schmelz, Baan & Haschick (1987a) Schmelz, J. T.; Baan, W. A.; Haschick, A. D. 1987, ApJ, 320 145
- Schmelz, Baan & Haschick (1987b) Schmelz, J. T.; Baan, W. A.; Haschick, A. D. 1987, ApJ, 315 492
- Schiano (1985) Schiano, A.V.R., 1985, ApJ, 299, 24
- Schwartz & Martin (2004) Schwartz, C.M., & Martin, C.L., 2004, ApJ, 610, 201
- Schwartz, Martin, Chandar et al. (2006) Schwartz, C.M., Martin, C.L., Chandar, R., Leitherer, C., Heckman, T.M., Oey, M.S. 2006, ApJ, 646, 858
- Seaquist, Bell & Bignell (1985) Seaquist, E.R., Bell, M.B., Bignell, R.C., 1985, ApJ, 294, 546
- Sedov (1958) Sedov, L.I., 1958, RvMP, 30, 1077
- Sharp et al. (2006) Sharp, R.G., et al., 2006, SPIE, 6269E, 14
- Shopbell & Bland-Hawthorn (1998) Shopbell, P.L. & Bland-Hawthorn, J., 1998, ApJ, 493, 129
- Shull & McKee (1979) Shull & McKee, 1979, ApJ, 227, 131
- Siebenmorgen et al. (2008) Siebenmorgen, R., Haas, M., Pantin, E., Krü gel, E., Leipski, C., Kä ufl, H.U., Lagage, P.O., Moorwood, A., Smette, A., Sterzik, M. 2008, A&A, 488, 83
- Smith et al. (2006) Smith, L.J., Westmoquette, M.S., Gallagher, J.S., O’Connell, R.W., Rosario, D.J., de Grijs, R., 2006, MNRAS, 370, 513
- Soltan (1982) Soltan, A., 1982, MNRAS, 200, 115
- Steigman, Strittmatter & Williams (1875) Steigman, G., Strittmatter, P.A., Williams, R.E., 1975, ApJ, 198, 575
- Steinmetz & Müller (1995) Steinmetz, M., & Müller, E. 1995, MNRAS, 276, 549
- Stevens, Forbes & Norris (1999) Stevens, I.R., Forbes, D.A., Norris, R.P., 1999, MNRAS, 306, 479
- Strickland (2007) Strickland, 2007, MNRAS, 376, 523
- Strickland et al. (2004a) Strickland, D.K., Heckman, T.M, Colbert, E.J.M., Hoopes, C.G., & Weaver, K.A., 2004, ApJS, 151, 193
- Strickland et al. (2004b) Strickland, D.K., Heckman, T.M., Colbert, E.J.M., Hoopes, C.G., Weaver, K.A., 2004, ApJ, 606, 829
- Strickland et al. (2000) Strickland, D.K., Heckman, T.M., Weaver, K.A., & Dahlem, M. 2000, AJ, 120, 2965
- Strickland & Heckman (2009) Strickland, D.K., & Heckman, T.M., 2009, ApJ, 697 2030
- Strickland & Stevens (2000) Strickland, D.K., & Stevens, I.R., 2000, MNRAS, 314, 511
- Storchi-Bergmann & Bonatto (1991) Storchi-Bergmann, T., Bonatto, C.J., 1991 MNRAS, 250, 138
- Suchkov et al. (1994) Suchkov, A.A., Balsara, D.S.; Heckman, T.M., Leitherer, C. 1994, ApJ, 430, 511
- Sutherland, Bicknell & Dopita (1993) Sutherland, R.S., Bicknell, G.V., Dopita, M.A., 1993, ApJ, 414, 510
- Tadhunter & Tsvetanov (1989) Tadhunter, C. & Tsvetanov, Z., 1989, Nature, 341, 422
- Taylor (1950) Taylor, G., 1950, RSPSA, 201, 159
- Terlevich, & Melnick (1985) Terlevich, R., & Melnick, J., 1985, MNRAS 213 841
- Tomisaka & Ikeuchi (1988) Tomisaka, K., & Ikeuchi, S., 1988, ApJ, 330, 695
- Tremonti et al. (2004) Tremonti, C. A. et al. 2004, ApJ, 613, 898
- Tully (1988) Tully, B.R., “Nearby galaxies catalog”, 1988, Cambridge University Press
- Veilleux & Bland-Hawthorn (1997) Veilleux & Bland-Hawthorn J., 1997, ApJL, 479, 105
- Veilleux et al. (2005) Veilleux, S., Cecil, G., Bland-Hawthorn, J. 2005, ARA&A, 43, 769
- Veilleux et al. (1994) Veilleux, S., Cecil, G., Bland-Hawthorn, J., Tully, R.B., Filippenko, A.V., Sargent, W.L.W., 1994, ApJ, 433, 48
- Veilleux & Osterbrock (1987) Veilleux, & Osterbrock, 1987, ApJS, 63, 295
- Veilleux & Rupke (2002) Veilleux S., & Rupke, D.S., 2002, ApJ, 565, 63L
- Veilleux et al. (2003) Veilleux, S., Shopbell, P.L., Rupke, D.S., Bland-Hawthorn, J. & Cecil, G., 2003, AJ, 126, 2185
- Veron-Cetty & Veron (1985) Veron-Cetty, M.-P., & Veron, P, 1985, A&A, 145, 425
- Veron, Lindblad, Zuiderwijk et al. (1980) Veron, P., Lindblad, P.O., Zuiderwijk, E.J., Veron, M.P., Adam, G., 1980, A&A, 87, 245
- Ward et al. (1978) Ward, M.J., Wilson, A.S., Penston, M.V., Elvis, M., Maccacaro, T., Tritton, K.P., 1978, ApJ, 223, 788
- Weaver et al. (1977) Weaver , R., McCray, R., Castor, J., Shapiro, P., Moore, R., 1977, ApJ, 218, 377
- Westmoquette, Smith, Gallagher et al. (2009) Westmoquette, M.S., Smith, L.J., Gallagher, J.S., Trancho, G., Bastian, N., Konstantopoulos, I.S., 2009, ApJ, 696, 192
- Westmoquette, Gallagher, Smith et al. (2009) Westmoquette, M.S., Gallagher, J.S., Smith, L.J., Trancho, G., Bastian, N., Konstantopoulos, I.S., 2009, ApJ, 706, 1571
- Wilson, Shopbell, Simpson (2000) Wilson, Shopbell, Simpson et al. 2000, AJ, 120, 1325


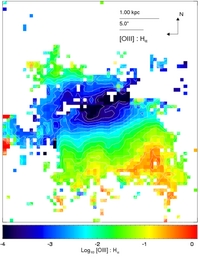
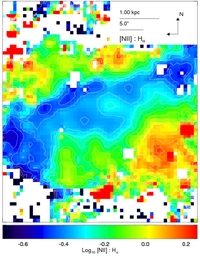
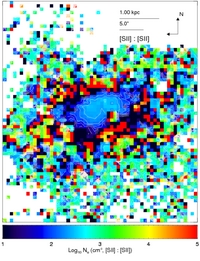
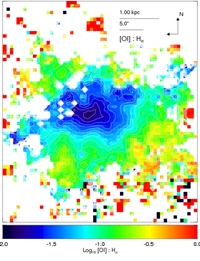
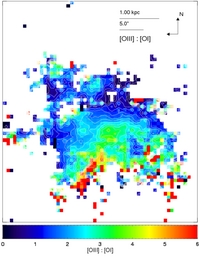
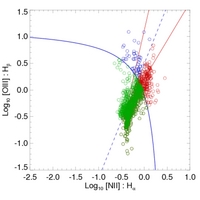
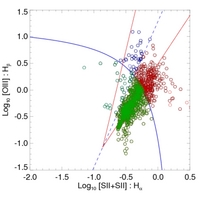
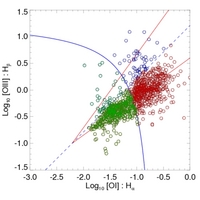
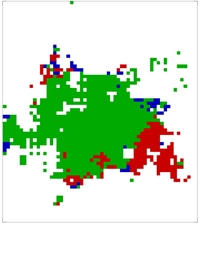
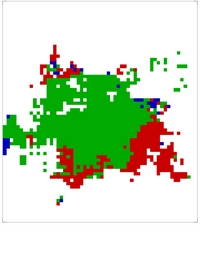
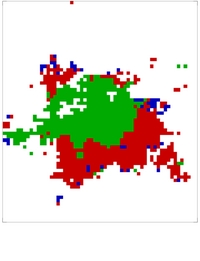
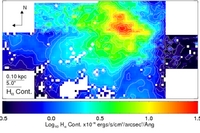
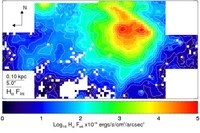
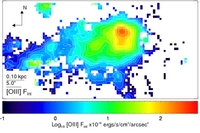
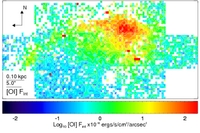
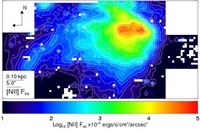
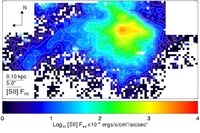
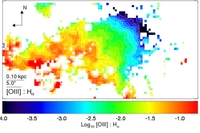
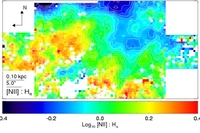
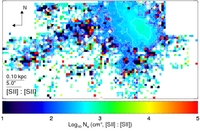
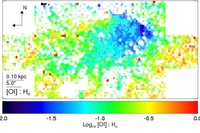
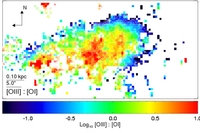
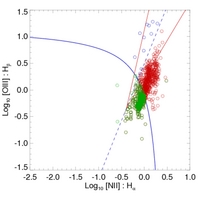
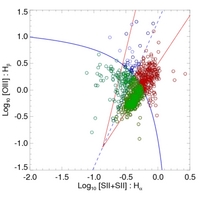
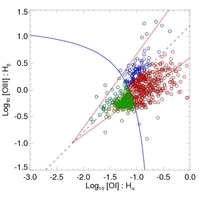

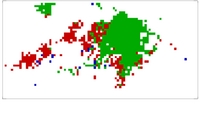
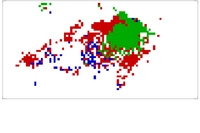
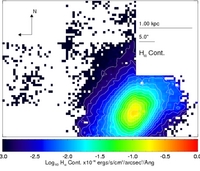
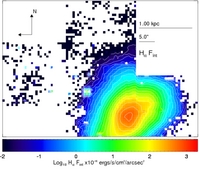
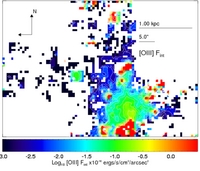
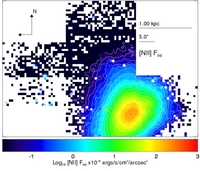
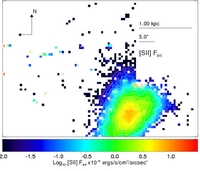
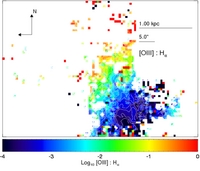
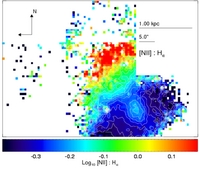
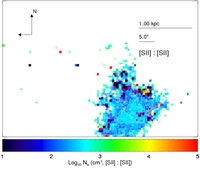
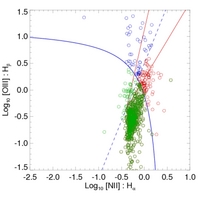
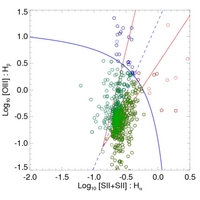
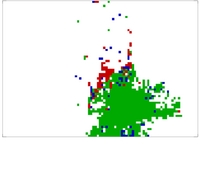
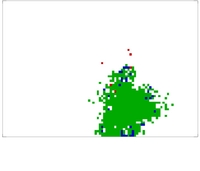
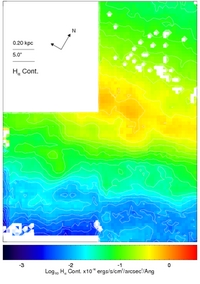
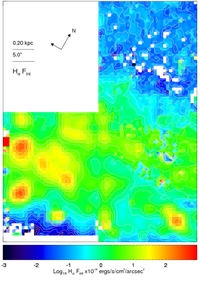
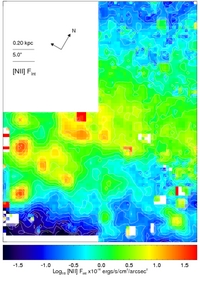
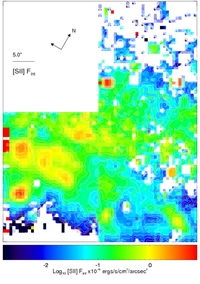
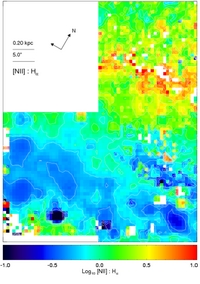
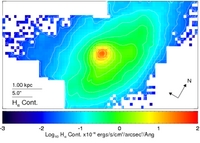
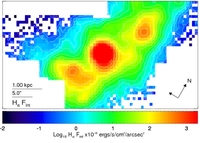
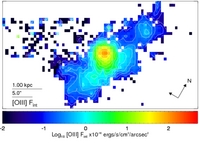
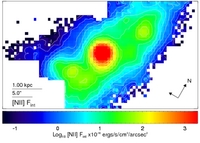
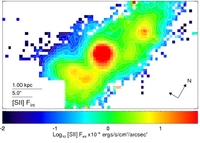
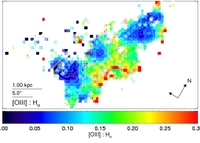
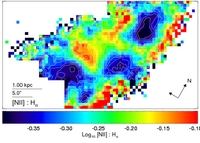
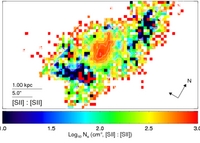
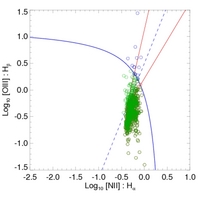
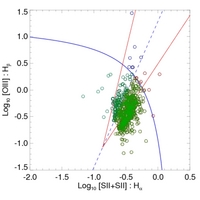
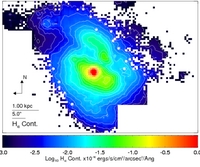
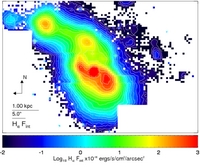
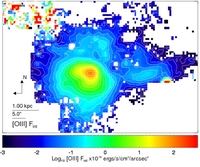
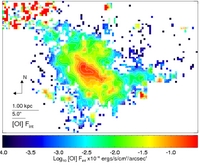
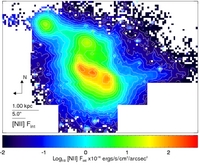
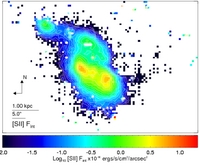
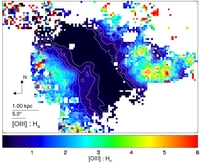
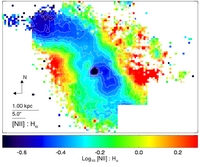
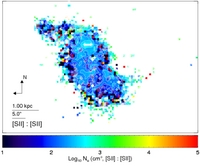
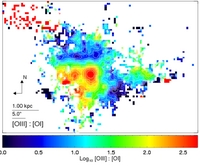
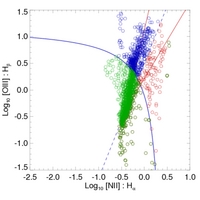
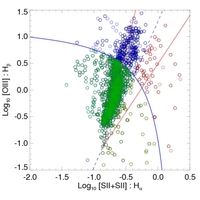
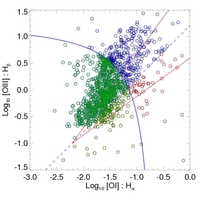
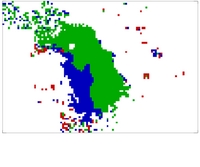
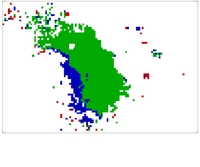
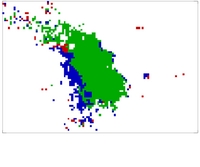
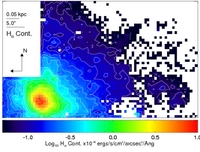
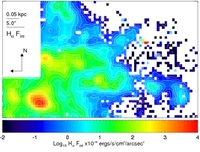
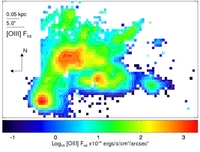
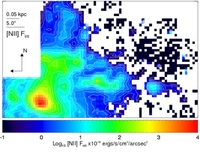
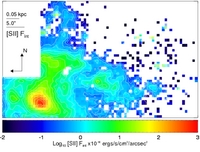
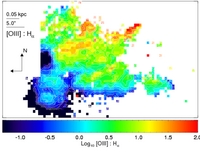
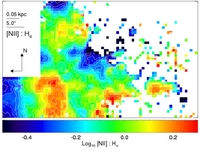
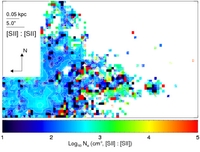
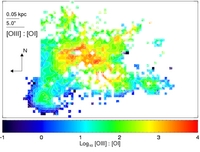
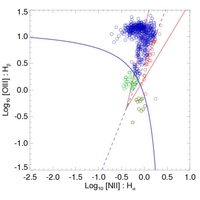
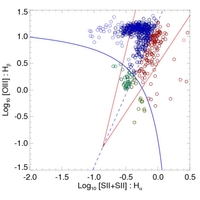
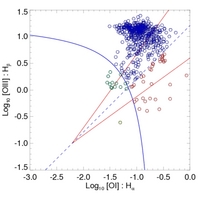
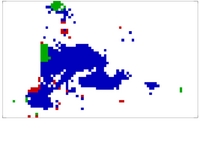
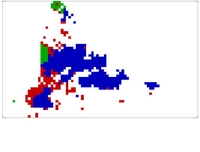
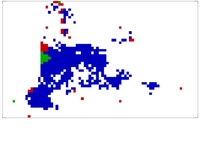
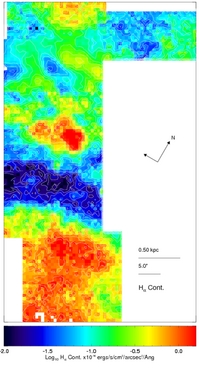
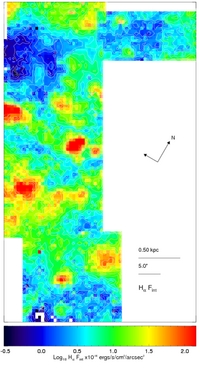
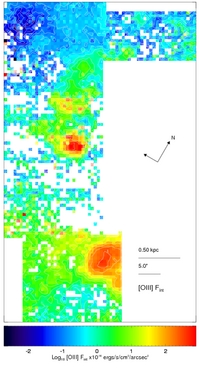
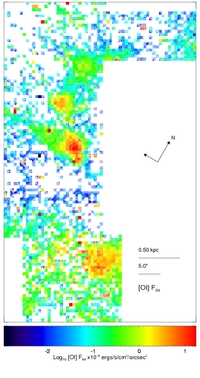
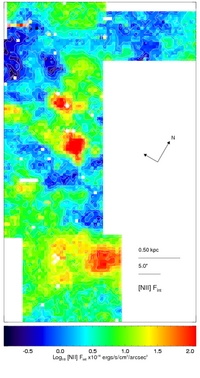
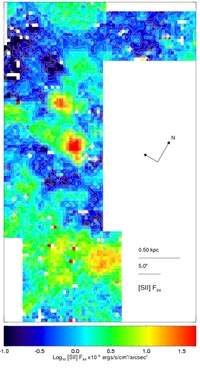
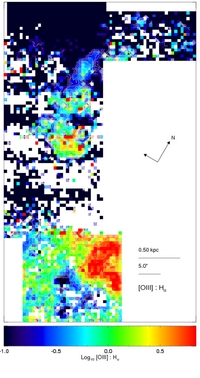
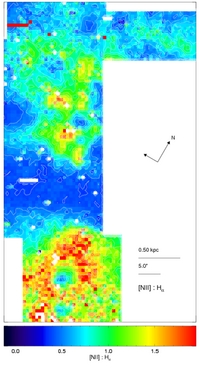
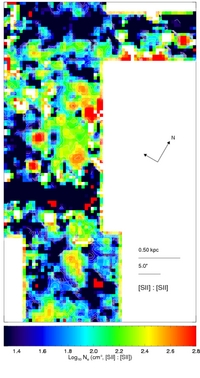
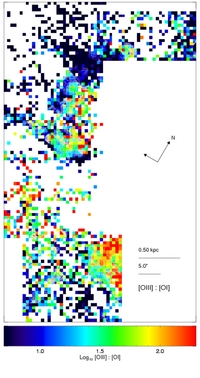
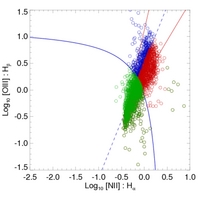
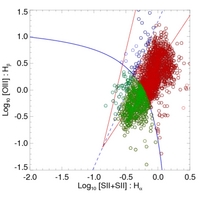
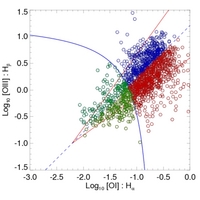
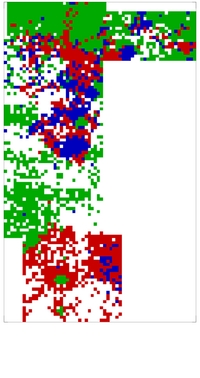
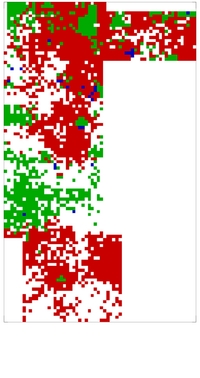
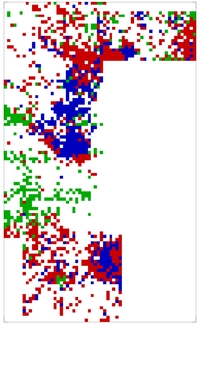
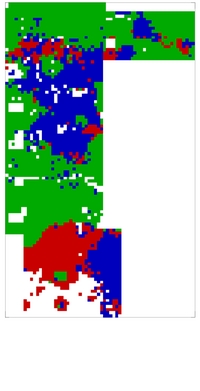
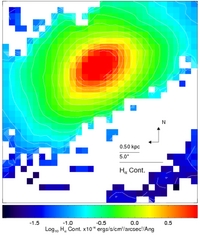
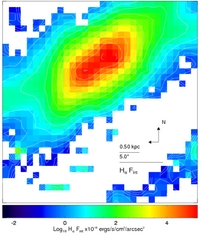
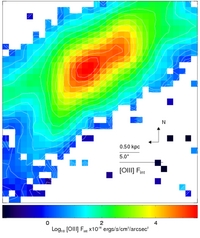
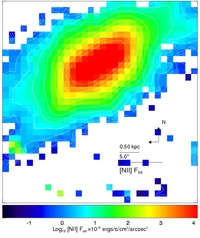
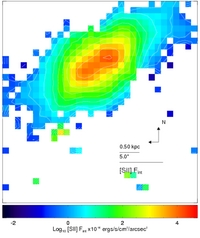
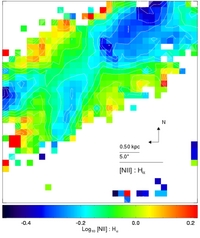
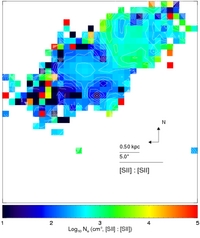
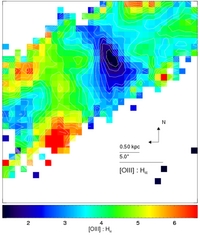
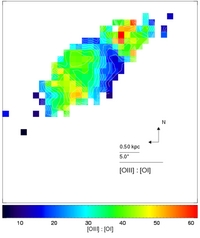
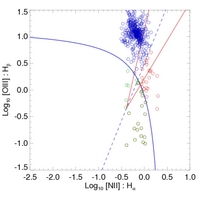
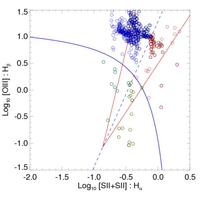
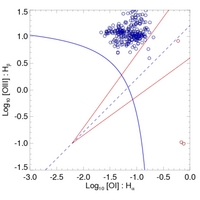
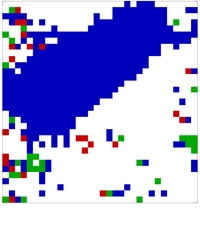
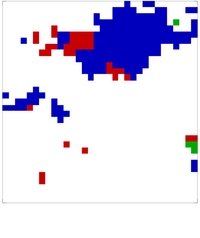
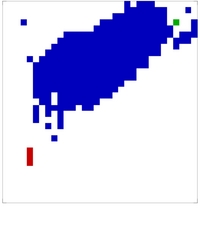
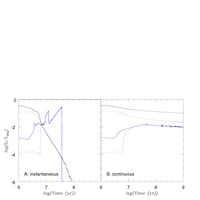
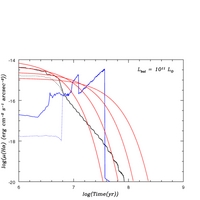
Appendix A The use of integral field spectrographs – lessons learned
The use of a double-beam integral field spectrograph has been critical to the success of this project. It provides both detailed ionisation diagnostics and kinematics over the extent of the outflowing gas. We have demonstrated how these IDDs can be used to classify the nature of the wind outflow for each source, and to define spatial zones in which different ionisation sources dominate. Furthermore, we have begun the process of spectral and spatial kinematic and ionisation deconvolution for each source, in an effort to disentangle the complexity of each system.
We conclude that blue sensitivity (below 500nm) is a key factor to many of the diagnostic requirements, in particular sensitivity to the H and [O iii] spectral region (with SPIRAL we can not comment on the utility of [O ii] emission feature for such work). As a clear shock diagnostic, [O i] is also of great value to classification of the nature of the ionisation source, although in all cases presented in this work, sensitivity to the [O iii] emission still presents the primary limitation. This limitation is imposed in part by the reduced throughput of the blue arm of the AAOmega system (Sharp et al., 2006) but will remain an important consideration for more balanced systems.
Spectral resolution is critical to disentangling the multiple emission components of many of the sources discussed, with line splitting in many of the outflows only marginally resolved in our R5000 spectroscopy (50 km s-1). One must of course also consider wavelength coverage. While many of the fainter lines common to ISM studies may be beyond the reach of a survey such as ours (for example the temperature sensitive [N ii] 5756 line is typically rather faint) we have demonstrated the added value of an extended spectral range in contrast to the limited coverage usually practical with Fabry-Pérot tunable filter systems such as that employed for example by Veilleux et al. (2003). A range of source redshifts, even for a nearby galaxy sample, further complicates the choice of wavelength range selection.
The observations and interpretation presented here have been possible primarily due to the high surface brightness sensitivity of the AAOmega-SPIRAL system afforded by the large projected spatial pixel size on the sky. The 0.7arcsec on a side square elements provide an individual field of view of 0.49arcsec2, which represents factors of 2, 5.4 & 12 increase in contrast to 0.5,0.3 or 0.2arcsec systems, more than accounting for the smaller size of the prime mirror of the AAT 3.9m when compared to systems available on the current generation of large optical telescopes. This allows SPIRAL to move out of the detector readnoise limit, below which re-binning of adjacent apertures will not recover signal-to-noise quickly. As recently demonstrated by Westmoquette et al. 09a/b, in truth one must ultimately combine the wide field of view and low surface brightness observations practicable with large pixels, with dedicated narrow field observations at higher spatial resolution of critical regions of each object.