The Milky Way Nuclear Star Cluster in Context
Abstract
Nuclear star clusters are located at the dynamical centers of the majority of galaxies. They are usually the densest and most massive star cluster in their host galaxy. In this article, I will give a brief overview of our current knowledge on nuclear star clusters and their formation. Subsequently, I will introduce the nuclear star cluster at the center of the Milky Way, that surrounds the massive black hole, Sagittarius A* (Sgr A*). This cluster is a unique template for understanding nuclear star clusters in general because it is the only one of its kind which we can resolve into individual stars. Thus, we can study its structure, dynamics, and population in detail. I will summarize our current knowledge of the Milky Way nuclear star cluster, discuss its relation with nuclear clusters in other galaxies and point out where further research is needed.
Instituto de Astrofísica de Andalucía - CSIC, Glorieta de la Astronomía s/n, 18008 Granada, Spain
1. Nuclear star clusters
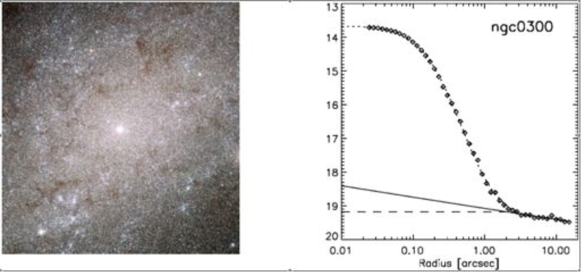
The study of nuclear star clusters (NSCs) of galaxies has only become feasible from the middle of the 1990s on with the high sensitivity and spatial resolution offered by the Hubble Space Telescope. NSCs are detected in 50%-80% of spiral, (d)E, and S0 galaxies (e.g., Phillips et al. 1996; Carollo et al. 1998; Matthews et al. 1999; Böker et al. 2002, 2004; Balcells et al. 2003; Graham & Guzmán 2003; Côté et al. 2006). It is not always possible to identify NSCs unambiguously, though. Different galaxy types pose different obstacles to their detection. For example, in some galaxies an NSC may be hidden by a high central surface brightness, while in late spirals with low surface density the exact center may be hard to determine, making it difficult to choose between several candidate clusters. Therefore, the reported detection rates can be regarded as lower limits to their frequency of occurrence which may possibly reach up to 100%. NSCs appear to be absent in massive ellipticals however. Some of them show central “extra light”, but this appears to be a phenomenon distinct from true NSCs (Kormendy et al. 2009).
A concise review on the properties of NSCs is given in Boeker (2009). NSCs have typically half-light radii of 2-5 pc and masses of M⊙. Consequently, they are among the most massive and certainly densest star clusters in the Universe. The star formation histories of NSCs are complex and a large fraction of them show evidence for several generations of stars with the youngest ones having frequently ages Myr (Rossa et al. 2006; Walcher et al. 2006). Hence, NSCs appear to be characterized by repeated episodes of star formation.
Two hypotheses have been suggested for the formation of NSCs: (a) Migratory formation via (repeated) infall of globular clusters or starburst-like clusters into galaxy centers through dynamical friction. (b) In-situ formation via repeated gas infall and subsequent star formation. It may well be that both mechanisms contribute to the buildup of NSCs over a Hubble time. The discovery of rotation of the NSCs of NGC 4244 (Seth et al. 2008b) and of the Milky Way (Trippe et al. 2008; Schödel et al. 2009) combined with the observation that many NSCs show signs of star formation within the last 100 Myr suggest that they form at least partially from infalling material from the host galaxy.
The recent realization that NSCs appear to obey similar scaling relationships with respect to their host galaxy masses as do massive black holes (MBHs) has raised even higher interest in these still poorly understood objects (Rossa et al. 2006; Wehner & Harris 2006; Ferrarese et al. 2006; Balcells et al. 2007; Graham & Spitler 2009). NSCs have been found to coexist with massive black holes in a small but steadily increasing (due to improved observations) number of cases (e.g., Filippenko & Ho 2003; González Delgado et al. 2008; Seth et al. 2008a; Kormendy et al. 2009). Based on a compilation of the cases of coexisting NSCs and MBHs with reliably estimated masses, Graham & Spitler (2009) show that the masses of the nuclei of the most massive ellipticals appear to be dominated by SMBHs, with NSCs not detected in many cases. The nuclear masses of the least massive spheroids appear to be dominated, however, by the masses of their respective NSCs. There is a transitional zone between these two regimes, where MBHs and NSCs clearly coexist (see Fig. 1 in Graham & Spitler 2009).
Studying NSCs is a difficult task. Because of their great distances and compact sizes, NSCs have, on average, apparent diameters and apparent -band magnitudes around (e.g., Böker et al. 2002). They are barely spatially resolved, even with the HST or with 8-10m ground-based telescopes equipped with adaptive optics. This makes the nuclear cluster at the center of the Milky Way (MW) a special target: It is the only NSC that can be resolved down to milli-parsec scales with current instrumentation. It serves as a unique template to study the interaction of a massive black hole with the surrounding nuclear star cluster and interstellar matter.
2. Large scale structure of the Milky Way NSC
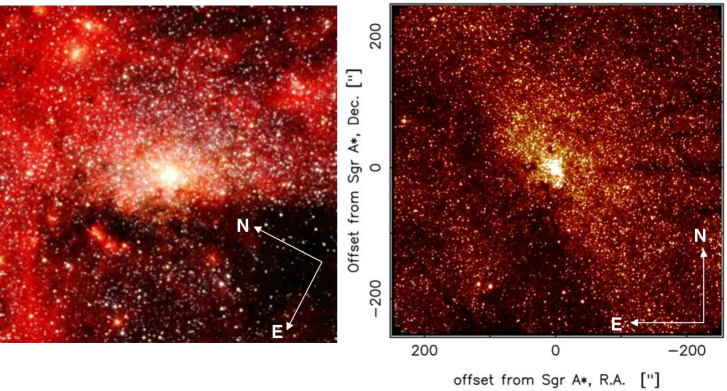
The nuclear star cluster at the center of the Milky Way was detected in the pioneering NIR observations of the Galactic center by Becklin & Neugebauer (1968). It was described as a dominant source in diameter, but its true nature was not clear, given the lack of observations of extragalactic NSCs at that time. Recent images of the MW NSC are shown in Fig. 2. The first publications to study the MW NSC in detail are by Mezger et al. (1999), Philipp et al. (1999), and Launhardt et al. (2002). The latter derive a volume density of for the cluster, with a core radius of pc, and estimate its total mass to M⊙.
The center of the Milky Way is the nearest center of a galaxy. From recent measurements of its distance (Nishiyama et al. 2006b; Ghez et al. 2008; Groenewegen et al. 2008; Trippe et al. 2008; Matsunaga et al. 2009; Gillessen et al. 2009; Reid et al. 2009a, b) one can calculate a mean value of kpc. Here, the unweighted average was computed, with the standard deviation of the individual measurements as uncertainty (see also Schödel et al., 2010, A&A, in press, arXiv0912.1273). At 8 kpc, of projected distance corresponds to 0.039 pc. This makes the nuclear cluster at the Galactic center (GC) the only NSC that can be resolved down to scales of a few milliparsecs with current instrumentation.
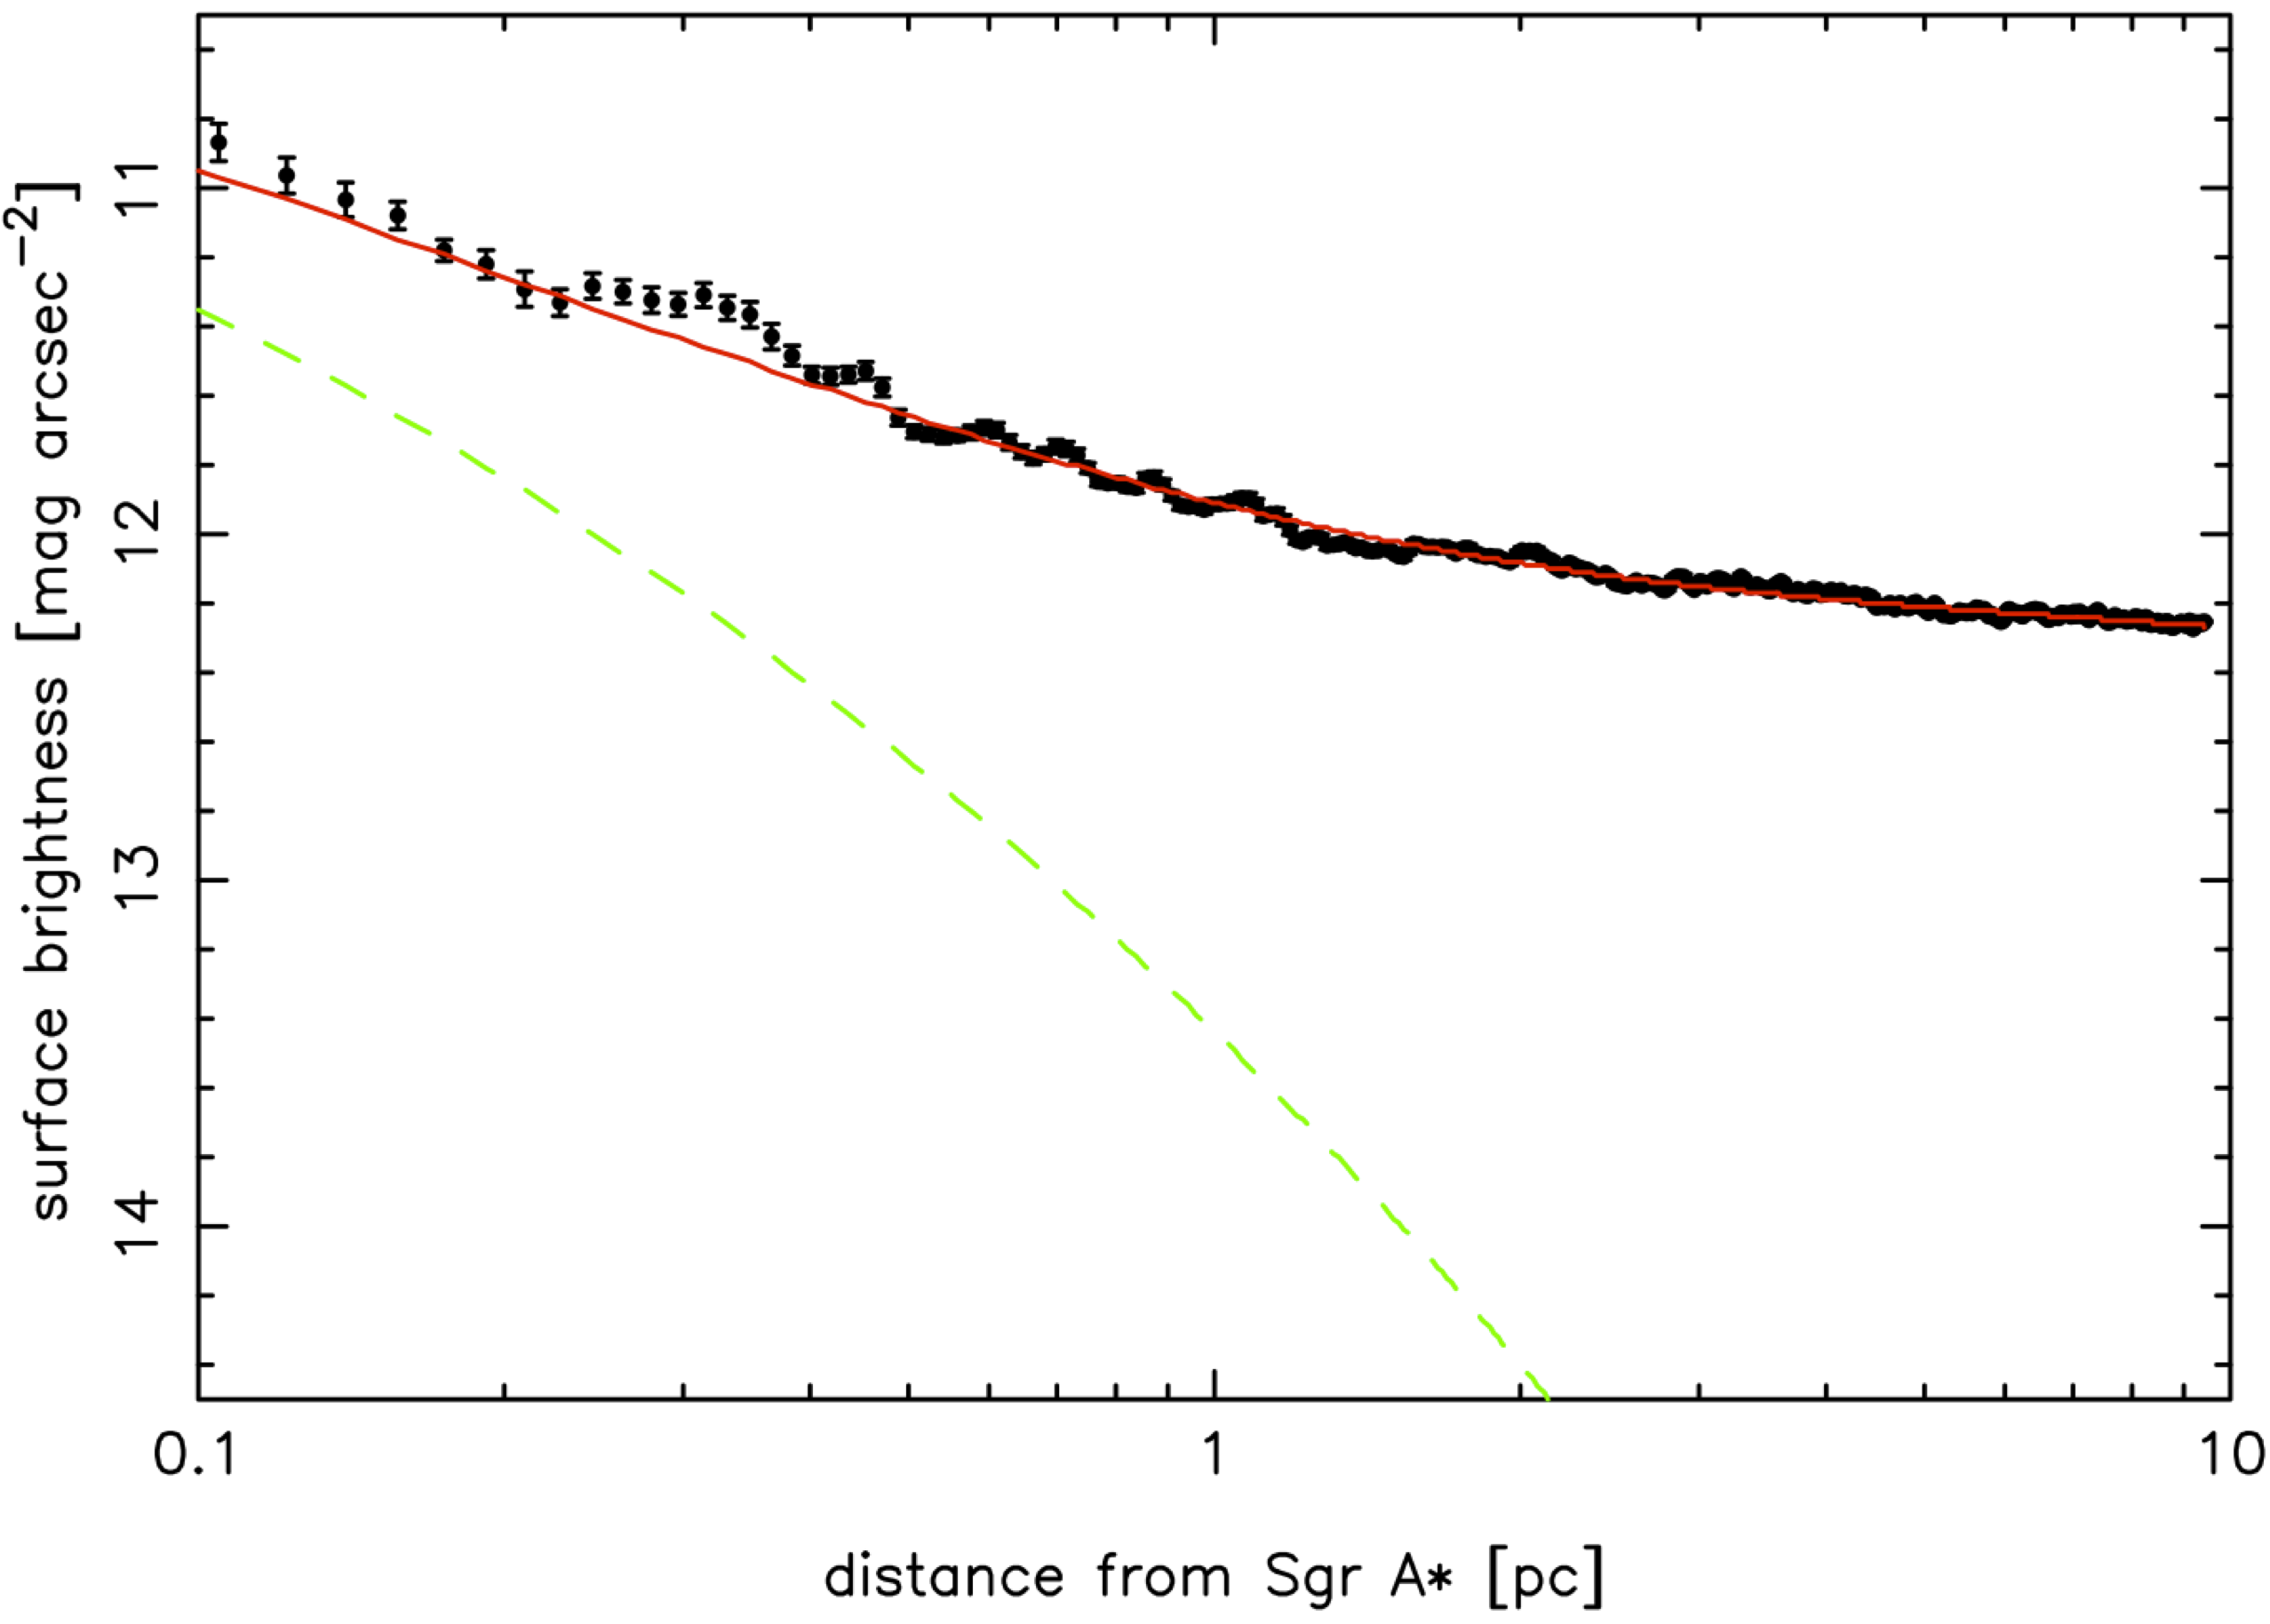
As can be seen in Fig. 2, strong and variable extinction poses serious obstacles to studying the exact shape and size of the Milky Way’s central star cluster. Graham & Spitler (2009) model the MW NSC with a Sérsic function with an index of and obtain an effective half-light radius pc. They used the NSC light profile determined from 2MASS data by Schödel et al. (2008). Because of saturation issues, 2MASS data are not ideal for examining the GC. Using the -band image from the IRSF/SIRIUS GC survey ( Fig. 2, see, e.g., Nishiyama et al. 2006a), we have re-determined and calibrated the light profile of the cluster (Fig. 3), assuming spherical symmetry and neglecting the influence of extinction. A Sérsic profile was fitted to the profile and results in a half-light radius of pc, somewhat larger than the one given by Graham & Spitler (2009). This discrepancy is indicative of the uncertainty of our current knowledge of this value. In this case, the uncertainty may be largely due to the different data used for determining the light profile and/or issues of photometric calibration/offsets. It is clear that more work is needed here. Particularly, an effective way to take extinction into account would be of great help. When estimating the mass of the NSC from its size and luminosity, major sources of uncertainties are the NIR mass-to-light ratio. One must also be careful to take into account that the light from the NSC is dominated by a small number of massive stars (see Launhardt et al. 2002; Schödel et al. 2007).
3. Kinematics of the Milky Way NSC
The kinematics of the MW NSC on large scales was first studied with spectroscopic measurements (e.g., McGinn et al. 1989; Sellgren et al. 1990). Indications were found for an overall rotation of the cluster parallel to Galactic rotation. This finding was recently confirmed and significantly improved by the study of Trippe et al. (2008) (see also Schödel, Merritt, & Eckart 2009). Proper motion studies of the GC were initially limited to the central arcseconds around Sgr A* (e.g., Genzel et al. 1997; Ghez et al. 1998). Only recently, two independent works measured stellar proper motions out to a projected distance of pc from Sgr A* (Trippe et al. 2008; Schödel et al. 2009).
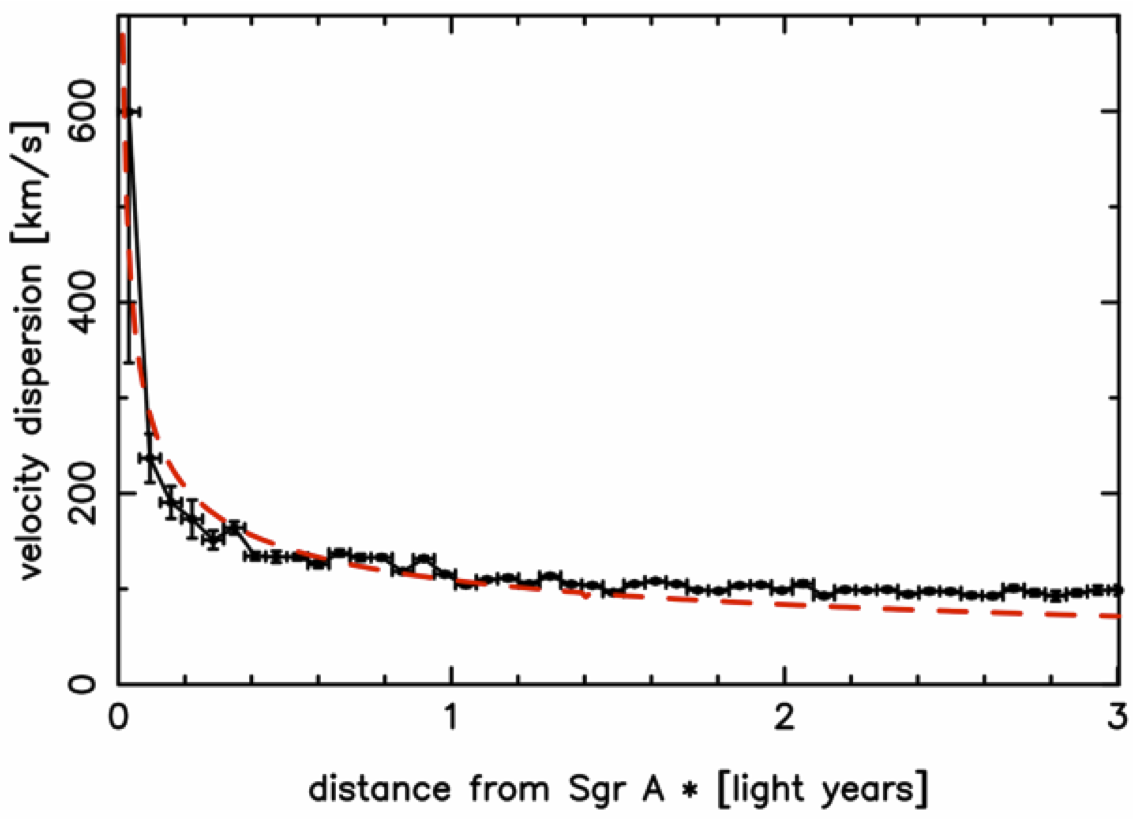
Figure 4 shows the azimuthally averaged profile of the one-dimensional proper motion velocity dispersion at the GC, based on the data from Schödel et al. (2009). The dashed line indicates the velocity dispersion profile of a purely Keplerian cluster, projected onto the plane of the sky. The Keplerian profile is purely illustrative and no mathematical fit. A mathematical fit is difficult to achieve because of our insufficient knowledge of the three-dimensional cluster volume density law of the NSC, particularly in the in the innermost arcseconds (see discussion in Schödel et al. 2009). Because of the rotation of the cluster and possibly present anisotropies, it is not rigorously right to present a one-dimensional profile of the velocity dispersion (see Trippe et al. 2008; Schödel et al. 2009). However, we believe that Fig. 4 serves well to illustrate two points. One of them is that the proper motions only show a clear Keplerian increase within of the MBH Sgr A*, demonstrating the difficulty of unambiguously proving the existence of a black hole embedded in a dense stellar cluster, particularly in extragalactic targets. The other point is that the Kepler law does not fit the data at projected distances beyond pc. This is a sign that the gravitational potential of the NSC itself starts becoming of increasing importance with distance from the MBH, Sgr A*.
Both Trippe et al. (2008) and Schödel et al. (2009) used their proper motion data to estimate the enclosed mass at the GC that is not contained in Sgr A*, i.e. mainly due to stars or stellar remnants. There are significant differences in the methodology applied by the two authors. Particularly, the parameterized model of Trippe et al. (2008) takes cluster rotation into account but does not represent a self-consistent model and does not allow to derive unique estimates of the enclosed mass (see discussion in Schödel et al. 2009). The analysis in Schödel et al. (2009) neglects rotation (which introduces only a small error) and does not make any assumption about the distribution of the extended (stellar) mass within 1 pc of Sgr A* other than that it must follow a power-law. Surprisingly, the latter authors find that even a mass density that decreases toward the black hole can fit the data. This is an unexpected result and highlights the need for more research, particularly for better constraints on the three-dimensional volume density model of the cluster. Under the assumption that the mass density does in fact increase toward Sgr A* (as is generally assumed), the data require at least M⊙ of extended mass within 1 pc of the black hole. If the mass-to-luminosity ratio is constant in the central parsec, there must be as much as M⊙ of extended mass. These values do not require any special assumptions on the composition of the cluster.
4. Is there a cusp around Sgr A*?
Numerous studies on the large-scale structure of the stellar cluster at the GC have found a volume density that depends on the distance from Sgr A* roughly as (see introduction and discussion in Schödel et al. 2007). Note, however, that the Sérsic model derived by Graham & Spitler (2009) results in a steeper power law. The authors point out that previous works may have been biased by not having accurately taken into account the contribution from the nuclear bulge.
Theoretical considerations on stellar dynamics predict the existence of a cusp in the central parts of a dense, dynamically relaxed star cluster surrounding an MBH (for a reviews see Merritt 2006; Alexander 2007), with volume density laws between (in case of strong mass segregation and for the most massive stars , Alexander & Hopman 2009). Early work on the stellar number density around Sgr A* found an almost flat cluster core, with a radius pc (e.g., Eckart et al. 1993; Haller et al. 1996; Launhardt et al. 2002). However, these early studies were seriously limited by incompleteness due to stellar crowding. Genzel et al. (2003) determined the number density of the NSC with the significantly improved resolution and sensitivity of adaptive optics observations at an 8m-class telescope and found that the volume density of stars increases towards Sgr A* as at distances less than pc from the black hole. Schödel et al. (2007) revisited the problem with improved data and methodology and found that the power-law index of the volume density of stars near Sgr A* is as low as . Hence, the power-law index of the stellar volume density is significantly lower than predicted by classical cusp formation theories. This indicates that some of the assumptions on which the theoretical work is based may not be valid in the case of the GC.
At least the assumption about the cluster being old and dynamically relaxed appears to be violated to some degree because the MW NSC shows clear signs of repeated bursts of star formation, with the most recent one having occurred only a few Myr ago (e.g., Krabbe et al. 1995; Paumard et al. 2006; Maness et al. 2007). The timescale for two-body relaxation in the central parsec of the GC, however, is generally assumed to be Gyr (see Alexander 2007; Merritt 2009). Moreover, Genzel et al. (2003) showed that the fraction of young, massive stars increases toward Sgr A*. Young stars dominate the number counts in the central arcseconds (see also Eisenhauer et al. 2005).
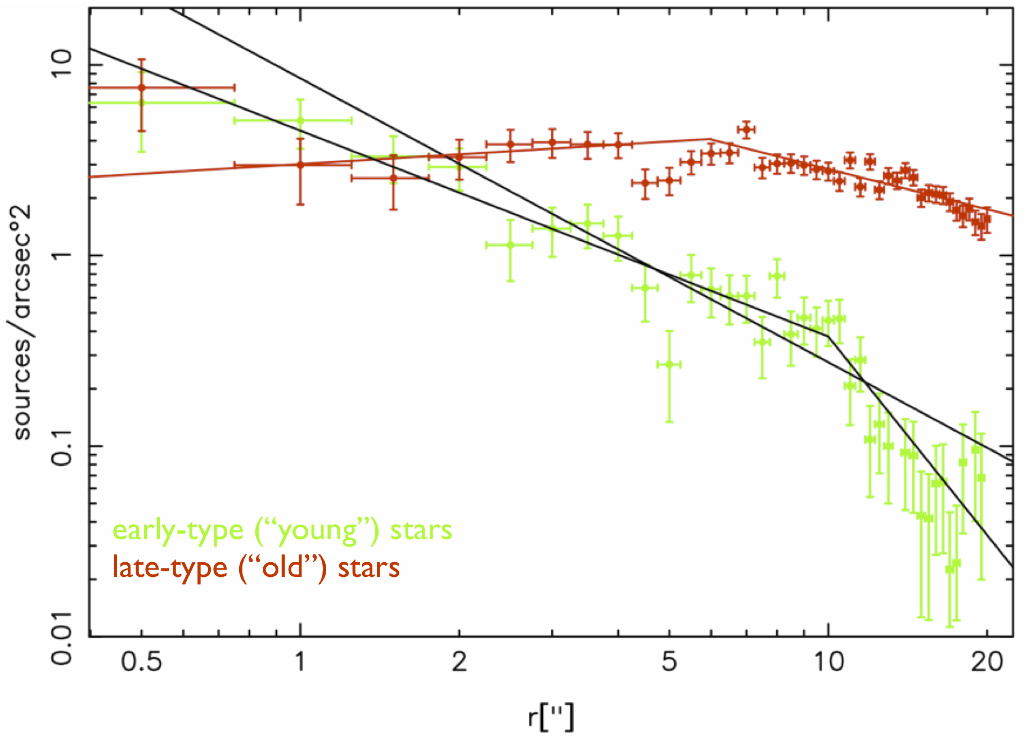
Recently, Buchholz et al. (2009) have photometrically classified stars down to within 1 pc of Sgr A*. They could thus determine the stellar surface density for early- and late-type stars separately (see Fig. 5). The vast majority of the late-type stars in their sample is expected to be older than about 1 Gyr and therefore possibly dynamically relaxed. Buchholz et al. (2009) found that the surface density of late-type stars is constant within of Sgr A* and may be even slightly decreasing in the innermost arcseconds. While a lack of giant stars in the innermost arcseconds had been noted earlier (e.g., Genzel et al. 1996; Haller et al. 1996), those early observations were limited to the brightest giants (). The findings of Buchholz et al. (2009) were confirmed by spectroscopic studies, which cover, however, smaller areas of the NSC and are probably slightly shallower (Do et al. 2009; Bartko et al. 2010). Do et al. (2009) show that if the de-projected density profile for the late-type stars is given by , then at the confidence level. This is in clear contradiction to the expected presence of a stellar cusp around Sgr A*.
An important caveat that has to be taken into account at this point is that because of the extreme stellar crowding at the GC, current instrumentation only detects the brightest stars. The completeness limit of current imaging observations is , which corresponds to a mean stellar mass of about 2 M⊙ (see Fig. 16 in Schödel et al. 2007). We are only observing the tip of the iceberg. Nevertheless, lighter stars should be pushed outward by the heavier components of the cluster and are not expected to show a steeper density law than the visible stars. Finally, there may be a cusp formed by stellar mass BHs around Sgr A* (Morris 1993; Miralda-Escudé & Gould 2000). Observational proof of such a hypothetical cluster of stellar BHs is very difficult to obtain, but the statistics of detected X-ray transients in the GC may indicate such a concentration of stellar BHs in the central parsec (Muno et al. 2005).
Currently, there is no satisfactory explanation for the absence of a cusp in the observed stars around Sgr A*. Working hypotheses include the collisional destruction of the envelopes of giant stars in the densest parts of the cluster (e.g., Freitag et al. 2008; Dale et al. 2009) or the infall of an intermediate mass black hole into the GC, which may have destroyed the cusp(see Merritt & Szell 2006).
5. Summary
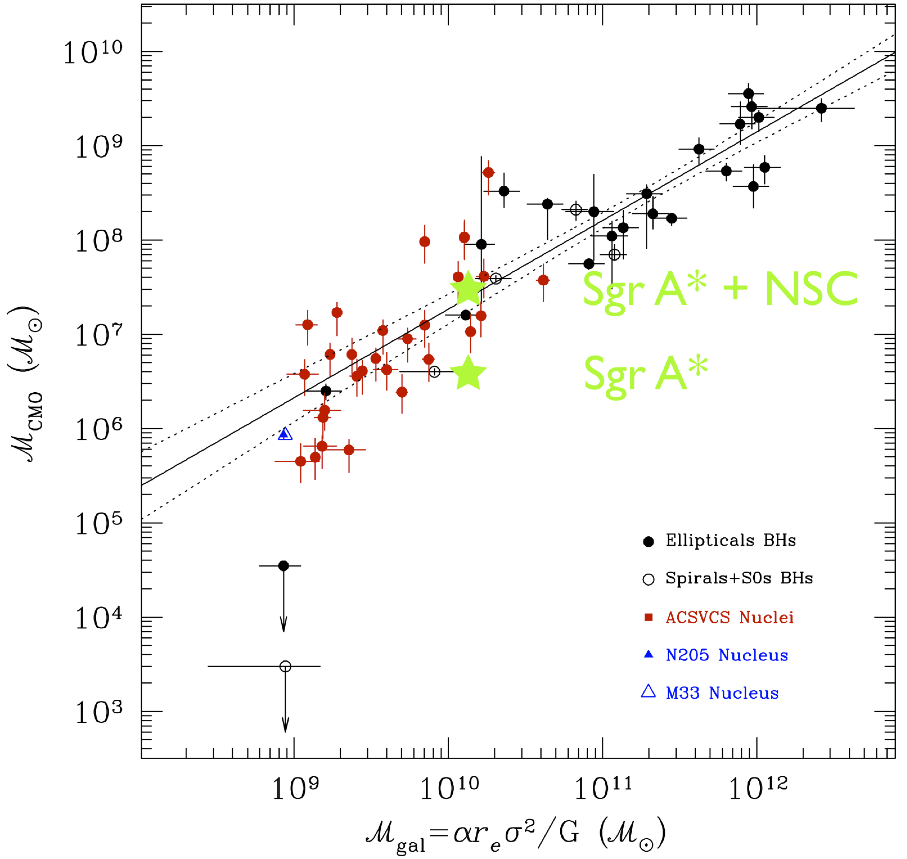
Nuclear star clusters are found at the dynamical centers of the majority of spiral, dwarf ellipticals (spheroidal galaxies), and S0 galaxies. With effective radii of a few pc and masses of M⊙ they are probably the densest and most massive star clusters in the Universe. They show a complex stellar population, produced by repeated star formation events. Intriguingly, there appears to exist a similar relation between the mass of NSCs and the mass of the host galaxy (respectively its spheroid) as between SMBHs and the host galaxies (see Fig. 6). This may indicate that there is always a central massive object (CMO) present at galaxy centers, either preferentially in the form of an NSC in low-mass galaxies or in the form of an SMBH in the most massive galaxies (e.g., Ferrarese et al. 2006; Graham & Spitler 2009). Massive black holes may well be present at the nuclei of almost all galaxies, but it can be extremely difficult to prove unambiguously the presence of a black hole inside a NSC (see section 3.). In the discussion about CMOs it is important to point out that the relation between massive black holes and NSCs is not clear at this point. For example, Kormendy et al. (2009) argue that this apparent relation could be an accident and that there is no further relation between MBHs and NSCs than that they are both probably fed by gas from the surrounding galactic disk. Additional reliable measurements of extragalactic MBH and NSC masses are needed to resolve this issue.
The cluster at the center of the Milky Way appears to be very similar to its extragalactic cousins and thus represent a valid template for their understanding. It has a mass of one to a few M⊙, an effective radius of 3-5 pc, and shows a complex star formation history. Adding the mass of the MW NSC to the mass of the central black hole, Sgr A*, makes the central massive object at the GC fit much better on the relationship between CMO and galaxy mass than if only considering the BH mass alone (Fig. 6). Research questions with respect to the Galaxy’s nuclear star cluster that should be addressed in the coming years are: How can extinction be taken into account when studying the MW NSC? Is it really spherically symmetric? What mathematical model fits best its shape and what is its correct effective radius? How is the extended mass distributed in the central parsec? Is there a hidden cusp of stellar mass black holes? What is the best explanation for the absence of an observed cusp around Sgr A* in the old stellar population?
Acknowledgments.
I am grateful to S. Nishiyama for providing the image of the Milky Way nuclear star cluster from the IRSF/SIRIUS survey.
References
- Alexander (2007) Alexander, T. 2007, ArXiv e-prints
- Alexander & Hopman (2009) Alexander, T. & Hopman, C. 2009, ApJ, 697, 1861
- Balcells et al. (2003) Balcells, M., Graham, A. W., Domínguez-Palmero, L., & Peletier, R. F. 2003, ApJ, 582, L79
- Balcells et al. (2007) Balcells, M., Graham, A. W., & Peletier, R. F. 2007, ApJ, 665, 1084
- Bartko et al. (2010) Bartko, H., Martins, F., Trippe, S., et al. 2010, ApJ, 708, 834
- Becklin & Neugebauer (1968) Becklin, E. E. & Neugebauer, G. 1968, ApJ, 151, 145
- Boeker (2009) Boeker, T. 2009, ArXiv e-prints
- Böker et al. (2002) Böker, T., Laine, S., van der Marel, R. P., et al. 2002, AJ, 123, 1389
- Böker et al. (2004) Böker, T., Sarzi, M., McLaughlin, D. E., et al. 2004, AJ, 127, 105
- Buchholz et al. (2009) Buchholz, R. M., Schödel, R., & Eckart, A. 2009, A&A, 499, 483
- Cardone & Sereno (2005) Cardone, V. F. & Sereno, M. 2005, A&A, 438, 545
- Carollo et al. (1998) Carollo, C. M., Stiavelli, M., & Mack, J. 1998, AJ, 116, 68
- Côté et al. (2006) Côté, P., Piatek, S., Ferrarese, L., et al. 2006, ApJS, 165, 57
- Dale et al. (2009) Dale, J. E., Davies, M. B., Church, R. P., & Freitag, M. 2009, MNRAS, 393, 1016
- Do et al. (2009) Do, T., Ghez, A. M., Morris, M. R., et al. 2009, ApJ, 703, 1323
- Dwek et al. (1995) Dwek, E., Arendt, R. G., Hauser, M. G., et al. 1995, ApJ, 445, 716
- Eckart et al. (1993) Eckart, A., Genzel, R., Hofmann, R., Sams, B. J., & Tacconi-Garman, L. E. 1993, ApJ, 407, L77
- Eisenhauer et al. (2005) Eisenhauer, F., Genzel, R., Alexander, T., et al. 2005, ApJ, 628, 246
- Ferrarese et al. (2006) Ferrarese, L., Côté, P., Dalla Bontà, E., et al. 2006, ApJ, 644, L21
- Filippenko & Ho (2003) Filippenko, A. V. & Ho, L. C. 2003, ApJ, 588, L13
- Freitag et al. (2008) Freitag, M., Dale, J. E., Church, R. P., & Davies, M. B. 2008, in IAU Symposium, Vol. 245, IAU Symposium, ed. M. Bureau, E. Athanassoula, & B. Barbuy, 211–214
- Genzel et al. (1997) Genzel, R., Eckart, A., Ott, T., & Eisenhauer, F. 1997, MNRAS, 291, 219
- Genzel et al. (2003) Genzel, R., Schödel, R., Ott, T., et al. 2003, ApJ, 594, 812
- Genzel et al. (1996) Genzel, R., Thatte, N., Krabbe, A., Kroker, H., & Tacconi-Garman, L. E. 1996, ApJ, 472, 153
- Ghez et al. (1998) Ghez, A. M., Klein, B. L., Morris, M., & Becklin, E. E. 1998, ApJ, 509, 678
- Ghez et al. (2008) Ghez, A. M., Salim, S., Weinberg, N. N., et al. 2008, ApJ, 689, 1044
- Gillessen et al. (2009) Gillessen, S., Eisenhauer, F., Trippe, S., et al. 2009, ApJ, 692, 1075
- González Delgado et al. (2008) González Delgado, R. M., Pérez, E., Cid Fernandes, R., & Schmitt, H. 2008, AJ, 135, 747
- Graham & Guzmán (2003) Graham, A. W. & Guzmán, R. 2003, AJ, 125, 2936
- Graham & Spitler (2009) Graham, A. W. & Spitler, L. R. 2009, MNRAS, 397, 1003
- Groenewegen et al. (2008) Groenewegen, M. A. T., Udalski, A., & Bono, G. 2008, A&A, 481, 441
- Haller et al. (1996) Haller, J. W., Rieke, M. J., Rieke, G. H., et al. 1996, ApJ, 456, 194
- Kormendy et al. (2009) Kormendy, J., Fisher, D. B., Cornell, M. E., & Bender, R. 2009, ApJS, 182, 216
- Krabbe et al. (1995) Krabbe, A., Genzel, R., Eckart, A., et al. 1995, ApJ, 447, L95+
- Launhardt et al. (2002) Launhardt, R., Zylka, R., & Mezger, P. G. 2002, A&A, 384, 112
- Maness et al. (2007) Maness, H., Martins, F., Trippe, S., et al. 2007, ApJ, 669, 1024
- Matsunaga et al. (2009) Matsunaga, N., Kawadu, T., Nishiyama, S., et al. 2009, ArXiv e-prints
- Matthews et al. (1999) Matthews, L. D., Gallagher, III, J. S., Krist, J. E., et al. 1999, AJ, 118, 208
- McGinn et al. (1989) McGinn, M. T., Sellgren, K., Becklin, E. E., & Hall, D. N. B. 1989, ApJ, 338, 824
- Merritt (2006) Merritt, D. 2006, Reports on Progress in Physics, 69, 2513
- Merritt (2009) Merritt, D. 2009, ArXiv e-prints
- Merritt & Szell (2006) Merritt, D. & Szell, A. 2006, ApJ, 648, 890
- Mezger et al. (1999) Mezger, P. G., Zylka, R., Philipp, S., & Launhardt, R. 1999, A&A, 348, 457
- Miralda-Escudé & Gould (2000) Miralda-Escudé, J. & Gould, A. 2000, ApJ, 545, 847
- Morris (1993) Morris, M. 1993, ApJ, 408, 496
- Muno et al. (2005) Muno, M. P., Pfahl, E., Baganoff, F. K., et al. 2005, ApJ, 622, L113
- Nishiyama et al. (2006a) Nishiyama, S., Nagata, T., Kusakabe, N., et al. 2006a, ApJ, 638, 839
- Nishiyama et al. (2006b) Nishiyama, S., Nagata, T., Sato, S., et al. 2006b, ApJ, 647, 1093
- Nishiyama et al. (2009) Nishiyama, S., Tamura, M., Hatano, H., et al. 2009, ApJ, 696, 1407
- Paumard et al. (2006) Paumard, T., Genzel, R., Martins, F., et al. 2006, ApJ, 643, 1011
- Philipp et al. (1999) Philipp, S., Zylka, R., Mezger, P. G., et al. 1999, A&A, 348, 768
- Phillips et al. (1996) Phillips, A. C., Illingworth, G. D., MacKenty, J. W., & Franx, M. 1996, AJ, 111, 1566
- Reid et al. (2009a) Reid, M. J., Menten, K. M., Zheng, X. W., et al. 2009a, ApJ, 700, 137
- Reid et al. (2009b) Reid, M. J., Menten, K. M., Zheng, X. W., Brunthaler, A., & Xu, Y. 2009b, ApJ, 705, 1548
- Rossa et al. (2006) Rossa, J., van der Marel, R. P., Böker, T., et al. 2006, AJ, 132, 1074
- Schödel et al. (2007) Schödel, R., Eckart, A., Alexander, T., et al. 2007, A&A, 469, 125
- Schödel et al. (2008) Schödel, R., Merritt, D., & Eckart, A. 2008, Journal of Physics Conference Series, 131, 012044
- Schödel et al. (2009) Schödel, R., Merritt, D., & Eckart, A. 2009, A&A, 502, 91
- Sellgren et al. (1990) Sellgren, K., McGinn, M. T., Becklin, E. E., & Hall, D. N. 1990, ApJ, 359, 112
- Seth et al. (2008a) Seth, A., Agüeros, M., Lee, D., & Basu-Zych, A. 2008a, ApJ, 678, 116
- Seth et al. (2008b) Seth, A. C., Blum, R. D., Bastian, N., Caldwell, N., & Debattista, V. P. 2008b, ApJ, 687, 997
- Trippe et al. (2008) Trippe, S., Gillessen, S., Gerhard, O. E., et al. 2008, A&A, 492, 419
- van der Marel et al. (2007) van der Marel, R. P., Rossa, J., Walcher, C. J., et al. 2007, in IAU Symposium, Vol. 241, IAU Symposium, ed. A. Vazdekis & R. F. Peletier, 475–479
- Walcher et al. (2006) Walcher, C. J., Böker, T., Charlot, S., et al. 2006, ApJ, 649, 692
- Wehner & Harris (2006) Wehner, E. H. & Harris, W. E. 2006, ApJ, 644, L17