Dilbert-Peter model of organization effectiveness: computer simulations
Abstract
We provide a technical report on a computer simulation of general effectiveness of a hierarchical organization depending on two main aspects: effects of promotion to managerial levels and efforts to self-promote of individual employees, reducing their actual productivity. The combination of judgment by appearance in the promotion to higher levels of hierarchy and the Peter Principle (which states that people are promoted to their level of incompetence) results in fast declines in effectiveness of the organization. The model uses a few synthetic parameters aimed at reproduction of realistic conditions in typical multilayer organizations.
I Introduction
Computer simulations have become increasingly popular in describing social phenomena, from traffic jams to opinion formation. The number of topics and works is very large and there are even popular expositions of the discipline, such as Ball (2004). In some cases the new tools provide significant insight into observed phenomena. Unfortunately, sometimes the computer simulations and statistical mechanics serve the same purposes as described by Andreski (1972), namely to fortify work that is trivial from sociological point of view. There is also another pitfall resulting from the focus on the mathematical and computer tools, namely minimal reference to the actual social observations. With these dangers in mind it seems quite adventurous to propose a mathematical model of purely social phenomena, especially well established in descriptive sociology.
An example of such work, where computer model genuinely allows to go beyond traditional description, is a recent publication by Pluchino et al. (2009), who have provided a simple and interesting simulation of the famous Peter Principle (Peter and Hull (1969)). The principle results from observation that in any hierarchical organization global effectiveness is diminished due to the fact often skills which make a person an excellent worker at a given level in the organization may be unsuited at a higher one. Thus, promotion of the best employees (which looks like a reasonable way of action) results in loss of skilled workers and, possibly, creation of less than optimal managers. Of course, such ineffective manager would no longer be promoted, so eventually everyone would become stuck at their level of incompetence. Peter originally formulated this idea in a joke-like fashion, but once we recognize its importance, it becomes pretty obvious and common sense. There are several works providing more exact description of the effects of the principle, for example Kane (1970); Fairburn and Malcomson (2001); Lazear (2001, 2004). It should be noted that companies fight against the “incompetence stasis” resulting from the Peter Principle via constant pressure on employees: promoting the best is usually accompanied by firing the worst performers at each level of hierarchy. But while this leads to culling of non-performers, it might mean loss of capable lower level employees who have been promoted beyond their skill range. The process creates a bad manager from a good worker, and then gets rid of the bad manager. This problem can in turn be solved by providing horizontal career paths, which ensure that the best specialists could be recognized and awarded without changing the area of their tasks, so that their skills would not be lost upon promotion. Yet, despite the fact that Peter Principle is known for forty years, examples of loss of productivity due to promoting people beyond their capacities are present in almost all types of hierarchical organizations, from scientific research to commercial companies.
In our model we attempt to go beyond the earlier approaches, which assume that the basis for promotions is the actual performance of the organization members. Our motivation comes from experience that decisions to hire and promote are based on perceived performance. Thus, employees or external candidates who focus on presenting themselves and their own results in good light (instead of just working) have better chances of advancement. Such individual public relations activity or self-promotion is quite natural and present everywhere: in commercial companies, universities or political parties. The result is that not only people reach their incompetency level, but also that the whole promotion process often focuses on those who have little to contribute to the organization but rather spend their effort and time on getting promoted. In honor of the Scott Adams’ Dilbert comic strip (Adams (1996)), we propose to call the resulting process Dilbert-Peter Principle. Similar combination of the two phenomena, which limit the effectiveness of organizations, has been proposed by Faria (2000). It might seem to be presumptuous to use Pointy Haired Boss and other characters featured in the Dilbert strip as “real world” basis for computer modelling. Would it not be better to use official company data, histories and performance figures as a source for inspiration for a simulation model? In our opinion, just the contrary. The official documents are usually written with the purpose of hiding the very mistakes and ineffectiveness we want to discuss. On the other hand, due to the popularity of the strip and its WEB site (http://www.dilbert.com/), the accumulated “database” of cases of stupidity and mismanagement is much better and true to life than the official corporate profiles and annual reports. The author’s personal experience, gathered in several companies, Polish, American, German and French, suggests that what looks like jokes is often an uncannily accurate description modern business organizations. Thousands of letters sent to Scott Adams from all over the world confirm this experience. In many areas we find organizations which share similar activities, sizes and structures, yet which differ widely in their effectiveness. This is true for both commercial companies and public organizations. Our goal is to find which which aspects of the model are crucial in determination of the overall productivity, and perhaps to suggest measures to improve the operations in real life.
II Model description
The purpose of the model is to provide a simplified description of effectiveness of a hierarchical organization in which people act to maximize their promotion chances. The promotions are achieved through comparisons of productivity of individuals within a given hierarchy level. One of the key differentiators of the model is the division between real productivity (for example sales results, number of research publications, lines of code accepted into a project) and employee productivity perception by the authorities responsible for making promotion decisions. While the effectiveness of the whole organization is measured by accumulating the real output of the contributors, their advancement within the organization is related to comparative perceived results. Observations show that often it is not the best performer that gets promoted (as postulated by the original Peter Principle) but those who appear to be the best workers. There are thus two main strategies to achieve the promotion. The first is via improvement of the real output, which corresponds directly to the Peter model background. The second way, observed all too frequently, is through the use of political games, thanks to which a person appears to be more productive and worthy of advancement. These individual PR activities are done at the expense of the actual work, thereby decreasing the contribution of the individual to the overall organizational effectiveness.
Following Pluchino et al. (2009) we propose to compare two possible scenarios, differing in description of individual productivity after the promotion. The first one, called continuity scenario (‘common sense’ in Pluchino et al. (2009)), in which the productivity at the new post is similar to the one at the previous one. Such situation is expected when the range of tasks related to the new position remains similar to the previous ones. The Peter scenario assumes that due to difference in tasks at different levels of the organization the productivity at the new post is unrelated to the old one. In both cases our current model measures the perceived productivity, including effects of internal politics. We investigate the effects of promotion process on key characteristics of the organization: its general productivity, averages of effectiveness at various levels of the hierarchy, dynamics of changes due to the promotion preferences.
The simulations presented here are designed to include several phenomena associated with modern enterprises and organizations, namely hierarchical organization, management contribution, measurements of effects dependent on both individual qualities and cumulative results of subordinates and interplay between in-company promotion and external hiring. The goal of the model is to provide some predictions regarding the dependence of the measured qualities on a few simple controls: importance of the political gamesmanship for promotion, heritability of skills after promotion (the continuity model versus Peter hypothesis) and tendency for internal or external advancement.
The basic model applies to organizations in which activities are uniform, i.e. where the nature of tasks is the same for all positions at a given hierarchy level. Examples might be provided by some government institutions (such as tax offices), research institutions or by specialized parts of larger bodies, for example sales divisions in large corporations. While the basic tasks and measurement criteria per level are comparable throughout the organization, advancing from one level to another might change (sometimes very significantly) the nature of the job: from tax collection or sales to management, more and more remote from the outside world as we move up in hierarchy
Presented results are based on a small number of selected conditions and, we hope, can be a starting point for a more advanced study.
II.1 Hierarchical structure
We are interested here in department based hierarchical organizations, such as a commercial company with many local sales offices, or large software house with multiple project teams. To a certain degree this description applies to research and government institutions as well. The simplest way of modeling such organization is via pyramid structure of units of the same size. Organization is divided into levels, numbered from top (). Each unit consists of a manager at level and subordinates (workgroup) at level .
The size of the whole organization is thus . To achieve reasonable number of levels and unit sizes we may restrict ourselves to and or , resulting in organizations with enough structure but limited to about 1000 people.
II.2 Agent characteristics
II.2.1 Real work and self-promotion
Employees are represented by computer agents numbered via subscript . Each agent is characterized by two parameters. The first, , is its capacity to perform effective work at its current position, called also raw productivity. We consider here two types of contributions: direct work (for example value of sales achieved by a salesman, lines of code written by a programmer or research papers published by a scientist) and managerial contribution, related to organizing, coaching and monitoring efforts of others. Managers, by their actions, may significantly influence the sum of individual results of their subordinates. This would correspond, to use our examples, to overall sales figures for a branch office, code submitted by a software development group or the research standing of the institute. We have decided to combine the two contributions into one parameter, to keep the spirit of Peter principle, defining one "competence".
The second characteristics of an agent is the effort he or she puts into internal political positioning (self-promotion) denoted by . This parameter may include activities and skills that are quite commonplace in modern organizations, for example excessive focus on presentation of results compared to the actual value of one’s own results (“PowerPoint economy”), presenting other’s achievements in bad light, forming and nurturing of cliques and power circles. We consider here that is focused on personal interest of the agent and does not contribute to actual results – neither those related to direct output, nor to management contributions. In this work we separate the “productive” part of political activities (such as organizing, motivating, ensuring cooperation…), being an inherent part of management activities and contributing to the real work done, from activities aimed at personal gain.
In our simulations we assume that the is drawn from Gaussian distribution centered around (a good value for might be , for reasons explained in Section II.2.2) with distribution width of , while for the distribution is linear from 0 to . The two parameters are used to model the actual results of the work done by the agent and the perception of the work done within the organization. The effective contribution to the organization productivity by the agent is given by
| (1) |
This is the simplest way of describing the fact that focusing on improving one’s own position by political activities must deduct some time from the actual work. On the other hand, effort spent on political maneuvers improves the perceived results. This is described in a more complex way, depending on additional parameter: organization’s susceptibility to self-promotion (Eq. 3). Similar trade-off between technical and social skills has been proposed by Faria (2000). It should be noted, however, that in our approach contains both the technical and social skills as defined by Faria. The change of responsibility upon promotion might result in a different optimal ratio of the two types of skills, and therefore, in different value of before and after promotion. The treatment of is different: it measures an internal characteristic of a person, its drive to improve own position, which does not improve the actual results in any way and has not been considered in the past. We have used values of , , in the simulations. This choice has been motivated by real life observations: for example such distribution of allows differences of work in the range of 200% or even more. As for , the choice of flat distribution rather than Gaussian reflects relatively frequent cases of extreme behavior: total lack of focus on self-promotion, or just the opposite. Author experiences lead to assumption of ; there are people who do spend more than half of time on political ploys aimed to advance their position.
II.2.2 Management contribution
To take into account the fact that in most organizations managers are measured on the results of the teams they manage, we introduce here accumulated versions of the effective work and perceived results, which combine the results of the manager and his or her subordinates. We have chosen to use a multiplicative way of describing the influence of the manager on the results of the department. This is by no means the only choice, but it provides a simple way of describing situation where a bad manager () would actually decrease the overall output of his department, while the good manager () would increase it. This multiplicative approach differs from additive view of Pluchino et al. (2009), who propose that contributions at higher levels of hierarchy should be modelled by simple addition of manager’s results multiplied by an artificial factor ranging from 0.2 at the lowest level to 1.0 at the top management, to simulate the increased importance of the higher levels of hierarchy. Increase of productivity of given employee over time is a real phenomenon found in many organizations, related with accumulation of skills and experiences. It would describe a horizontal progress from an apprentice to a top specialist – within a given level of hierarchy. It is less suited to vertical promotion and managerial tasks, where the contribution of a manager comes from organizing the work of the subordinates. Moreover, additive approach can not describe the Dilbertian influence of idiot bosses who often decrease the results of the departments they manage. The importance of the individual contribution must be higher as we move up in the organization levels. Thus we propose that effective results are given by
| (2) |
where denotes the agents that are directly managed by agent . Due to recursive nature of the above expression, the effective results of a manager include contributions of all its subordinates. For the lowest level of hierarchy . In such model, if all agents have the same value of and (no effort is wasted on political positioning) the results at a given layer are , assigning much greater importance to the managers that in the additive model. But if then the manager decreases the summed contributions of his or hers subordinates. Such model does not describe well situations where a manager combines the managerial tasks with the same type of production as his or her subordinates (e.g. programming team leader writing code, university department head doing his or her own research or sales manager being directly responsible for some customers). However, above certain realistic size of the workgroup, the qualitative results of our model remain unchanged by such assumption.
In contrast with the actual results, the perceived outcome for a manager is given by a combination of the real results of his department (compared to the expected average at the appropriate level) and the outcome of his political ploys. We have used a simple sum of these two factors
| (3) |
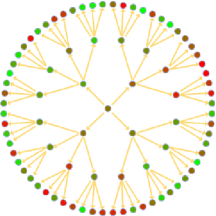
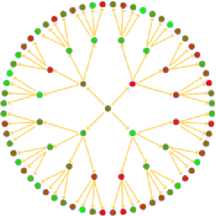
where is the average result at the level of the agent . is a numerical factor used to model self-promotion importance - one of the key parameters in the simulations. We use the name “susceptibility” for , as it determines the relative importance of self-promotion in the selection of candidates for promotion, and thus the way the organization responds to self interests of employees. Such form of the perceived results allows normalization of its two components independently of the level, number of subordinates etc. Agents with highest and lowest values of would be the candidates for promotion and sacking, respectively. Figure 1 shows sample organizational structure with and , comparing and at various levels of the organization. The positions are color coded, with highest values denoted by green, lowest by red. As may be seen, actual performance and perceived one may be quite different.
Using the assumptions about the distribution of raw output and self-promotion described in Section II.2.1, it is possible to calculate the average actual and perceived results at each organization level in a situation where the capabilities of each agent are drawn randomly
| (4) |
where
| (5) |
The overall outcome of the political activities on the real and perceived results of an agent at a given position are simply: increase of leads to decrease of real contribution but increase of the perceived one. Depending on the value of playing politics may prove to be advantageous - or not. As it turns out the result depends on the level of the organization, making the model more life-like.
II.3 Promotion, firing and hiring
To model the processes of promotion in an organization we need to provide some assumptions as to the personnel mobility within it. This requires balancing between model simplicity and the need to cover realistic situations. The rules proposed apply to organization levels . For the top level, there is no competition and no hiring/firing. Real organizations certainly experience changes at the CEO level, and such changes can bring large differences in the overall performance. Charismatic leaders, like Steve Jobs, by their vision and management skills can radically change the evolution of their companies. Such contributions are, however, impossible to simulate in a statistical computer model. Our goal is to model internal competition and promotion mechanisms within an organization, coming from lower levels. To allow such focus in our simulations we have assumed that the top manager has no influence on the overall productivity, having , and .
At lower levels the firing and promotion scheme easier to simulate. At the end of every quarter there is some chance (given by parameter ) that from each workgroup of employees subordinate to a given manager one would be fired. Thus the typical churn rate is the same at every level, being given by , and the reason for introducing is to allow adjustment of the rate of change in the model. This would allow the “simulation time” to reflect actual time for real organizations. The choice of the agent to be fired in each workgroup is deterministic: the worst perceived performer is selected as the candidate for firing.
We have also considered a variant in which a manager threatened by a possibility of being fired, if sufficiently skilled in political games, might pass the blame to one of his or her direct reports. In this variant, the existence of scapegoats further improves the chances of those agents who focus on politics instead of the real work. However, such blame-shifting requires high political skills, so we have assumed that it would be possible only with probability proportional the political skills of the threatened manager, . For low values of putting the blame to others would be virtually impossible, but for those who have high values pf closer to 1, the security of the manager in question would be greatly improved, at the expense of his subordinates. So, in blame-shifting scenario, survival role of is enhanced.
The vacant positions can be filled either by internal promotion or by external hiring. This can by described by assuming two mechanisms of filling a given empty post, each with probability being a part of the model. First, there is a probability that the post will be filled by externally hired agent (probability ). To keep the model close to the real hiring process we assume that for each vacant position some applicants with randomly drawn values of and would be compared (we used 4 candidates in the simulations). But it is important to remember that this process would compare the perceived qualities of the candidates. The same political skills that are used during employment may be a rough measure of how the candidate presents his or her past achievements and value for the future employer. So, the hired agent would be the one with the highest value of . It seems a reasonable assumption that the same susceptibility factor that is used to describe the organization’s susceptibility to political maneuvering of the employees would be used for appraisal of candidates. We have also run simulations where no selection of external candidates has been performed and thus the new agent would simply have a random set of , values. This allows to study the effects of pre-selection of external candidates.
The second option of filling a vacancy is through direct promotion of the best performer (again, we measure perceived performance!) of the organizational level directly below the vacancy. It is possible to consider two options: local promotion, where the promoted agent is selected from direct subordinates under the vacated position, and global where anyone from the lower level can be picked to fill the vacated post. In the preliminary results presented here the global model has been used. The promotion will, of course, leave another vacancy to be filled at a lower level. The hiring process should start at the highest vacancy and continue down. All the vacancies at the lowest level are, by their nature, filled by external hiring.
To make the model comparable to previous ‘Peter Principle’ studies two options of treating the agent capacities after a promotion are possible. They are: the continuity hypothesis, in which the productivity at the higher level remains close to the previous one
| (6) |
where denotes agents capacity on the higher level. Agent’s productivity changes by a small random value of , with normal distribution centered at zero with width of . This hypothesis would be applicable to situations where the tasks at the higher hierarchy level are somewhat similar to those at a lower level (advancement from programmer to programming team leader, for example). On the other hand, in situations where the new post calls for totally different set of skills (salesman promoted to sales manager or to marketing manager position) it is sensible to assume the Peter hypothesis in which is randomly drawn, without any relation to previous . For this reason the promotion modes (local or global) and the promotion hypotheses (common sense or Peter hypothesis) might be correlated.
Depending on the organization the change of the scope of activity due to promotion, from direct production (writing the code, visiting customers, conducting experiments) to managerial tasks of organizing, planning and supervision may be more or less gradual. The first promotion, turning a worker into first line manager introduces the greatest change and one could expect that Peter hypothesis to hold. On the other hand further promotions may involve the use of more or less the same set of managerial skills applied to larger groups and responsibilities, which would be better described by the common sense approach. It might make sense then to introduce a mixed model corresponding to such situation.
II.4 Simulation considerations
During simulation process we are looking both at global changes of organization effectiveness depending on the promotion model as well as individual career paths and results of individual strategies (given by unchanging values of the political factor of each agent). The simulation steps should correspond to realistic conditions, e.g. quarters or semesters – periods where typically performance of employees is reviewed. Thus we would be interested in, say, up to 64 steps (16 years) – but many of the interesting phenomena could happen on the shorter timescales. By experience, modern commercial organizations stay in the same shape (without major reorganizations) for periods of 3-5 years. And, of course, major reorganizations are not covered by the simplistic model described above. The individual results of the simulation runs differed significantly (as discussed in Section III.1) and we for each combination of parameters we have accumulated results of 8000 runs, to obtain averages and distribution of key characteristics.
The key parameters and characteristics of the simulated organization were:
-
•
Overall performance of the organization, given by the averages of effective total result of the topmost boss and its changes during simulation steps, as well as effective performances of organization units at different levels, as given by their bosses’ . We also recorded the number of new hires compared to internal promotions, to check the initial assumptions It is worth noting that these parameters are comparable to real world data, ans such comparison could lead to improvements of the model (for example probabilities of external hiring depending on the level of the vacancy).
-
•
Monitoring true productivity and self-promotion factor at various levels of the organization. Average for each level as well as the average value of raw individual productiveness were calculated at each step of the simulations; to check if it is the political manipulators or the real workers who move to the upper echelons, as suggested by common sense.
III Results and discussion
The model presented in this work is rather complex, involving several parameters designed to mimic at least some of the crucial aspects of modern organizational life. This complexity, however, makes deriving clear dependencies rather difficult. For the purpose of this preliminary paper we decided to divide the system controls into two groups. The first contains those that are static between various simulations, for example the distributions of and . For most of the simulations we have also kept the firing rate and the external hiring rate fixed. The values of these parameters were selected to keep the “simulation time” as close as possible to the real world, and obtain reasonable values of the churn ratio and average time spent as given position.
The second group contained controls that were varied between simulated organizations, describing their main characteristics: number of levels and workgroup size, presence or absence of blame-shifting, pere-selection sample size for external candidates and, of course, type of post-promotion efficiency model (Peter hypothesis, continuity model) and organization susceptibility to self-promotion.
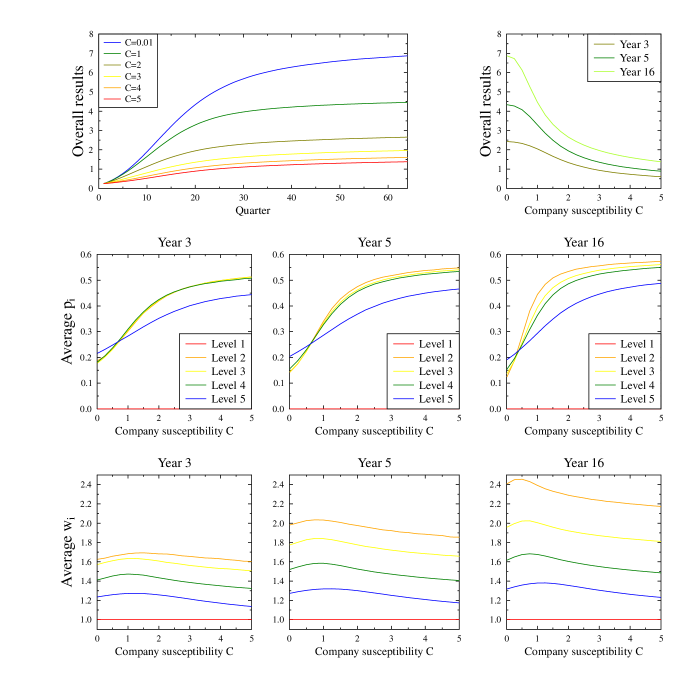
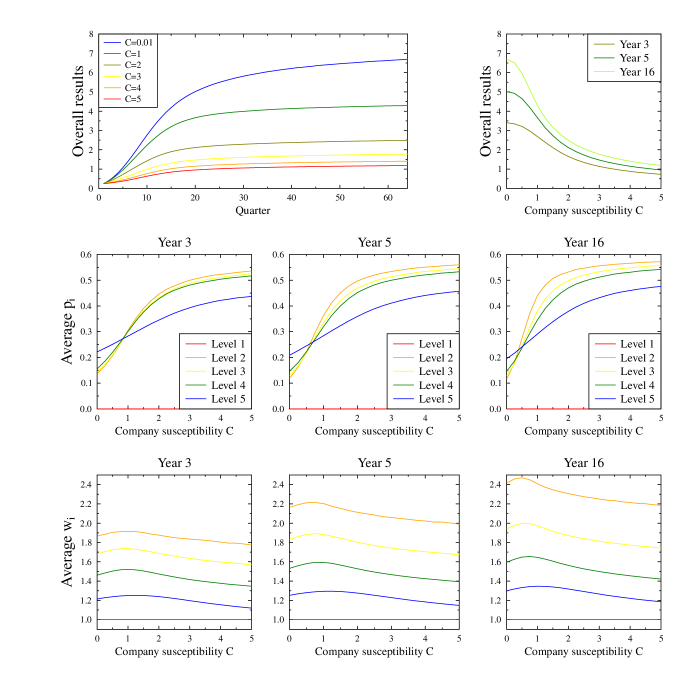
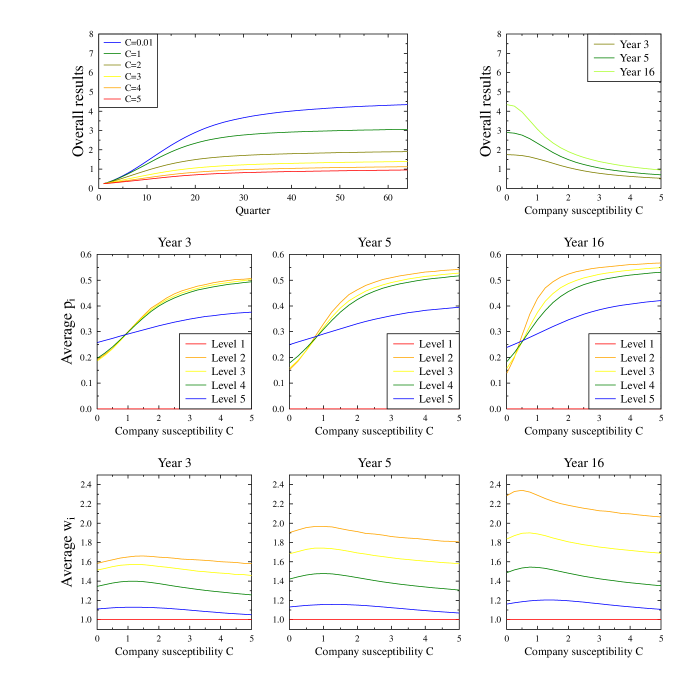
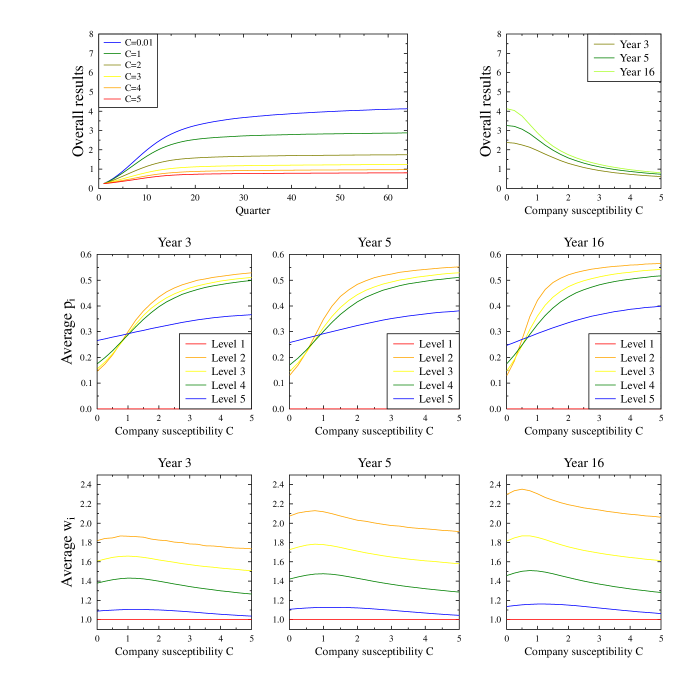
We present here results for two hierarchies, the first comprised of 5 levels of 5 people in a workgroup, the second of only 4 levels but 9 people in a workgroup. This choice was motivated by a desire to keep the overall sizes of the two configurations similar (781 in the first case, 820 in the second). Also, the number of workers in the lowest (non-managerial) level was of the same order (625 vs. 729). Based on the distribution of and defined in Section 2, we can derive two “yardstick” measures of the total organization productivity. The first, which we would call “neutral productivity”, assumes that no self-promotion take place () and that all workers and managers have the same effective . Then the organization’s output is simply given by the number of lowest level workers (as managers neither improve nor diminish the results). The other standard is the average productivity in a wholly random organization, this time including the negative effects of time and effort lost on political games. The values of such static, random distribution are, with our choice of parameters, rather low, (105 for the 5-by-5 case and 175 for the 4-by-9 one). This is, of course, due to the largely negative impact of the managerial structure, where every manager decreases the production of his/her department by a factor of (0.7 in our case). These values are also starting points of the results of the dynamical simulations, as the starting conditions used random distribution of agent characteristics. It should be noted that the random configuration and associated productivity seems highly unrealistic, as it means that all managers negatively influence the outcome. For this reason, we have used the neutral productivity as the criterion of the improvement vs. decline of the organization effectiveness in the simulations. Interestingly enough, some combinations of parameters resulted in configurations that were worse than the random one – negative selection is real, especially if the organization itself is under no threat of existence nor competition, as is often true for government structures.
Despite the fact that in all simulations the pool of agents’ individual capabilities remained the same, the final long term results of the model organizations varied by almost an order of magnitude! At the end of this report we include detailed average results of the simulations for several combinations of model parameters (Figures 13 to 23). Due to the interplay of the processes introduced in our model, separation of the individual contributions is not easy and the impact of various model parameters requires some detailed analysis.
III.1 Simulation statistics
Due to the multiplicative way the managerial contribution is modelled here, the influence of individual characteristics of managers, especially at high positions, can significantly change the overall productivity of the organization. As a result we observe rather wide distribution of results between simulation runs. As an example, Figure 2 presents distribution functions of overall productivity for the Peter model for various values of the susceptibility factor , at different stages of the evolution starting from random configuration: after3, 5 and 16 years. Figure 3 presents similar data for a set of simulations in the continuity model.
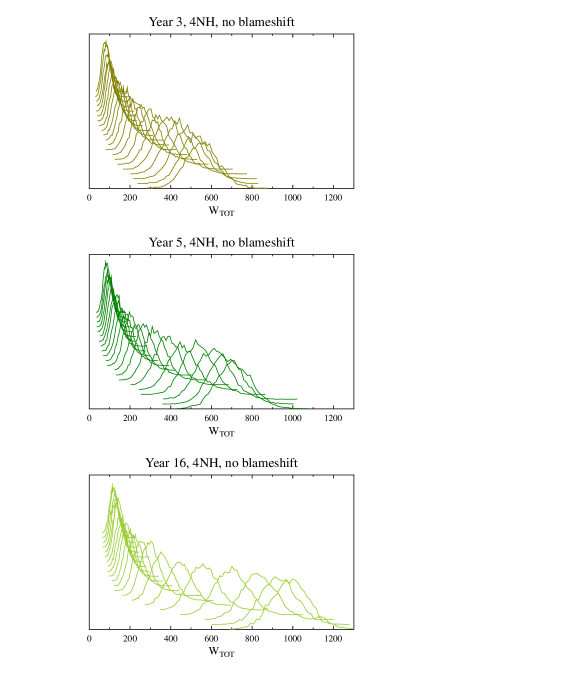
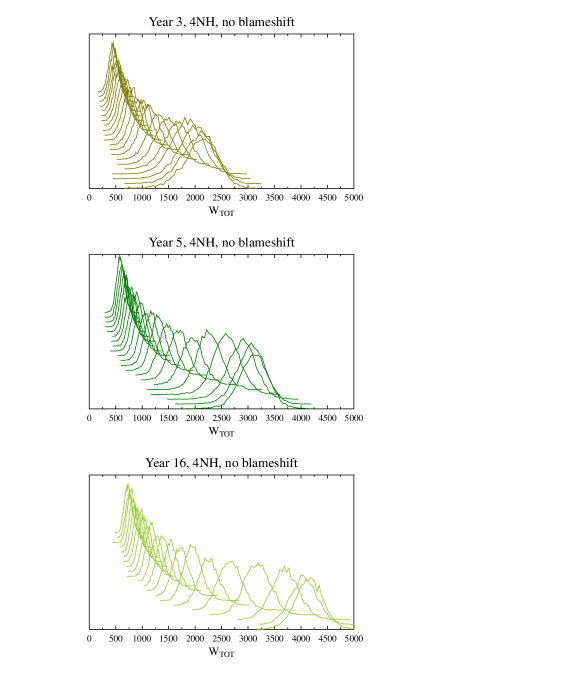
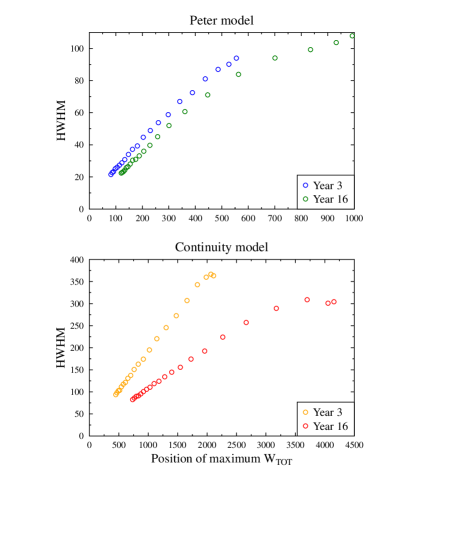
The widths of the distributions are rather high, with half-width at half-maximum strongly correlated with the position of the peak center (Fig. 4). In the continuity model we observe strong reduction of the width of the distribution of with the passage of time, but even after 16 years of continuous evolution, there are still significant differences of results between individual simulation runs. Thus, part of the trends observed for average values as functions of model parameters, discussed in the later part of this article, may be masked by individual differences between simulation runs. We note here that the average values of and for organization level have similar Gaussian distributions.
III.2 Evolution of individual agent characteristics
We note first that the behavior of the lowest and the mid-range hierarchy levels is different. This is due to radically different mechanisms of changes in the agents occupying these levels. The ratio of vacated positions to level size was set as constant for levels below the topmost. It should be noted, however, that the lowest level is filled entirely from outside, which leads to strong dependence of the average characteristics of agents on that level on the external hiring process – especially on the results of selection of the external candidates.
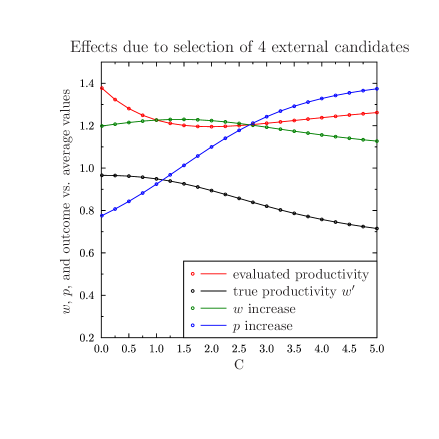
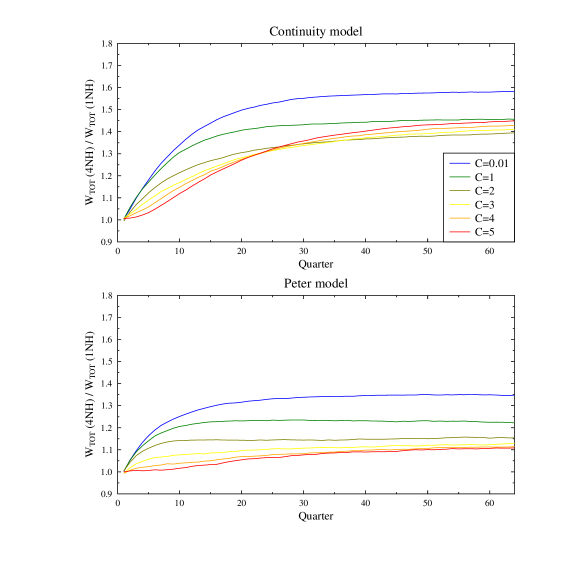
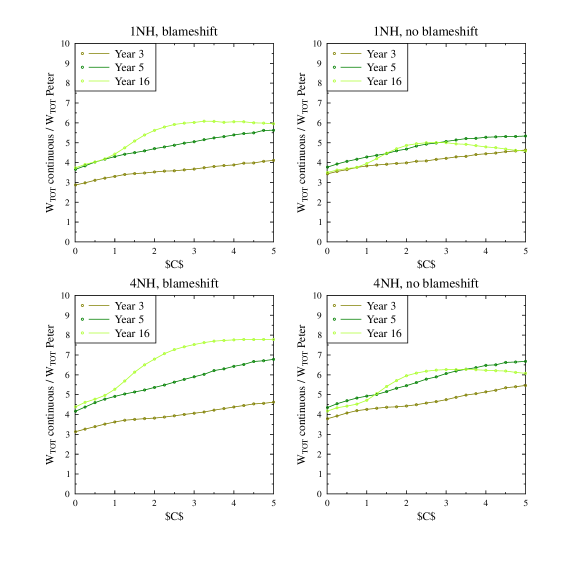
The most straightforward effects are due to the presence or absence of selection of external candidates. We have compared results when only one external candidate is randomly drawn (denoted 1NH) and when the candidate with best perceived value of expected productivity is chosen from four candidates (denoted 4NH). Without selection the expected values of and for the newly hired employees would be and , respectively. As Fig. 5 shows, allowing the organization to choose from only 4 candidates significantly influences the resulting values of and and the resulting productivity. Such increase in the real productivity of newhires is especially important for the lowest level of organization. For the Peter model, where only are kept by an agent upon promotion, the increases of are largely lost at higher levels. For the continuity model both and are inherited and, as the new hires participate in later promotion possibilities the values obtained with pre-selection on higher levels also show an increase compared with simple random values for external hiring. As a result, the overall performance of the organization is higher in the 4NH case than in the 1NH case for both Peter model and continuity model, but the difference is much higher for the continuity model (50-70% compared to 10-40%, see Fig.6).
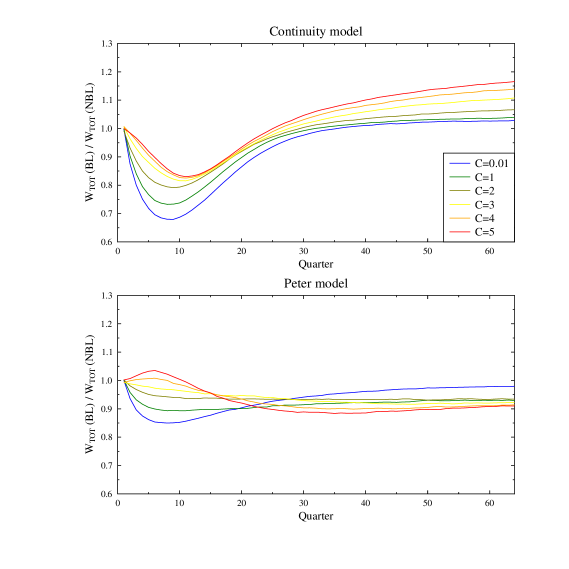
The blame-shift process during which managers can place the responsibility for the department weak performance on one of their subordinates acts in a more subtle way. First, it extends the lifetime of managers, especially the ones with weak real performance but high values of . Because we have assumed the probability of using a scapegoat to be given by manager’s (and independent on ) the effect is the strongest for low values of , where it leads to much larger average values of at mid-managerial levels for small . This is especially visible early in the simulations, within the first 3 years of organization evolution from the random initial state. The overall effects of the possibility to shift the blame for weak performance are different for the continuity and Peter models (see Fig. 7). For the Peter model there is a general but small decrease in organization productivity when blame-shifting is possible. For the continuity model there is a large decrease of productivity in initial stages that gets gradually compensated at later times, so that for large values the overall productivity in organizations allowing blame shifting becomes even greater than for those that do not allow this process.
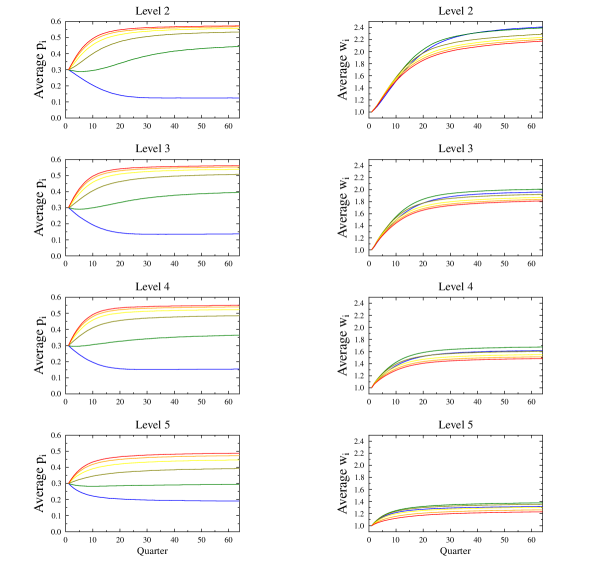
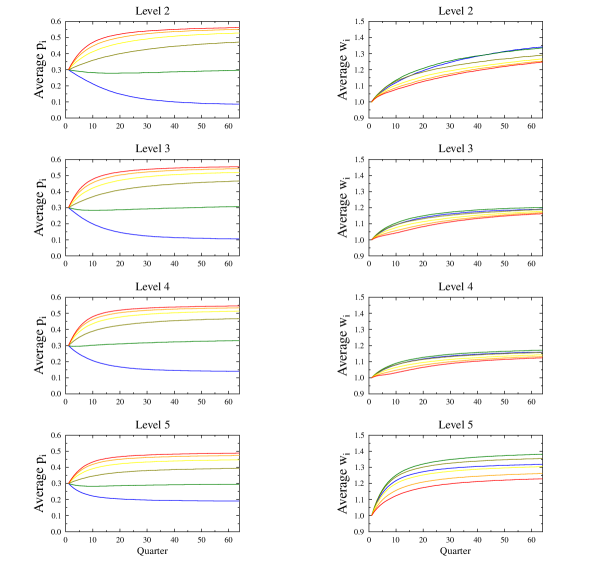
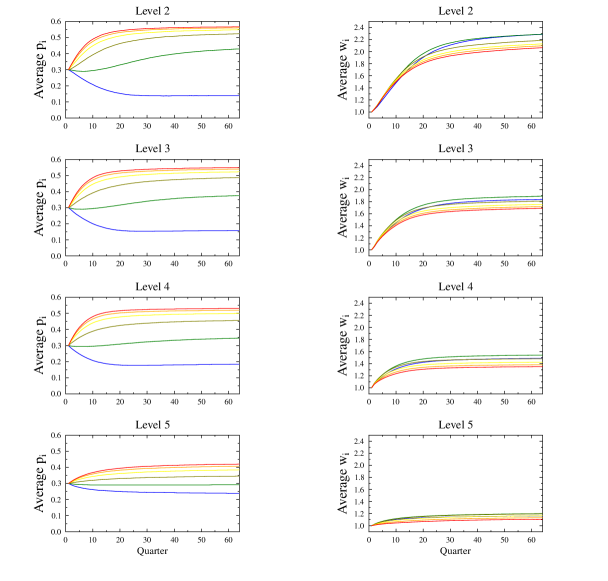
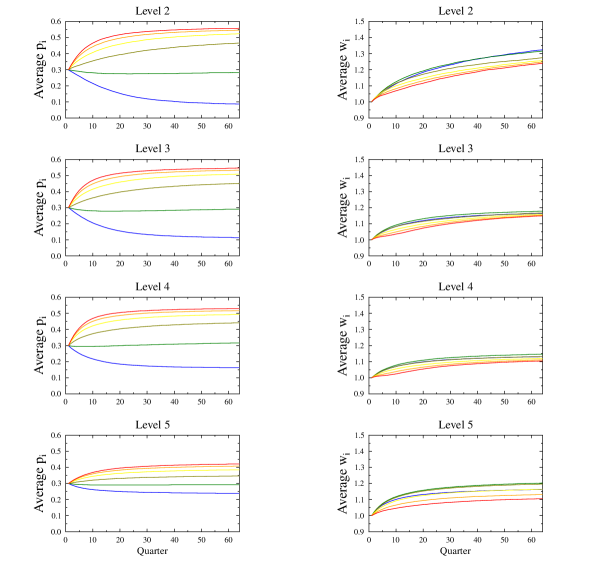
The time evolution of average values of and for various organization levels are – for most parameter combinations – reasonably well described by exponentially decaying functions of time and . For very low values of the self-promotion is selected against, thus decreases with time for both continuity and Peter models. For large values of selection favors high political activity and thus grows. In the intermediate regime of we observe more complex behavior of , remaining close to the average value for random distribution. On the other hand, the true productivity in both models is observed to grow with time. Obviously this increase is much higher for the continuity model, where the promotion preserves, at least partially, the values, so that talent and competencies are not lost.
III.3 Global characteristics
We shall focus now on the remaining model controls: the post-promotion effectiveness model (Peter or continuity) and the organization susceptibility to internal self promotion, . Both factors play a crucial role in the evolution of the organization effectiveness. Let us discuss first the differences between the two post-promotion models. The continuity model, even in the presence of strong susceptibility to internal PR, predicts improvement of the individual productivity with time at higher levels of organization. Selection of best (perceived) performers coupled with limited “inheritance” of the individual productivity significantly improves the average values, and as result, leads to much higher values of overall true productivity than in the Peter model.
The difference between the productivity in continuity model and Peter model can be as high as 8 times, as shown in Fig. 12. Selection process for the continuity model, even for very large values of susceptibility (when agents with high focus on self-promotion are at advantage), leads to performance better than for the random assignment of agent capacities – but lower than the neutral configuration, when internal politics plays no role. For the Peter model at large values the evolution may lead to decrease of productivity from the starting random configuration! This seems to be a very bad sign for any organization. For some combinations of parameters this decrease, happening over a short period of less than 10 quarters, diminished the productivity by a factor of 2 (see, for example, Figs. 22,21).
III.4 Conclusions
The general results of the simulations are not surprising (just as the original observations of Peter and Adams were not surprising). Everyday observations show that there are many organizations, big and small, commercial and governmental, where promotions and demotions follow political ploys and not the real capability of an employee to fulfill specific roles. And it is quite obvious to both internal and external observers, that the performance of these organizations may be far from optimal. Thus the model has no “discovery” value, but is, more or less, a mathematical toy, reflecting some aspects of the social reality. Obviously, it misses a lot of factors that are present in real life: individuality and creativeness of the leaders; innovative, market disruptive products or ideas; well established processes and organizational culture that effectively guide individual players; capacity to change the organizational form to adapt to new challenges. All these can be crucial in determining the success or a failure of the organization. On the other hand, the processes related to promotion and internal politics included in the model are present in almost all types of organizations and can negatively impact their results. The main idea behind the model is to look for some simple controls that could allow some general policy suggestions – as it turns out some model parameters are more important than others. For example, the presence of blame-shifting influences the overall performance only to a minor degree. Moreover, such self-preservation instincts are natural for managers, and it s very hard to avoid them. Another model variable, degree of pre-screening of external candidates, provides much higher influence on the resulting productivity (especially in the continuity model). But for most of modern organizations such competitive nature of hiring is already present, so there is little room for improvement here. The two major factors are the capability to preserve the skills and efficiency of an employee after the promotion and susceptibility of an organization to self-promotion, or, in other words, capacity to recognize the real values. Here the differences in overall productivity can be as high as an order of magnitude. Thus, the model suggests that organizations should focus on measures eliminating negative effects due to Peter Principle and to self-promotion. Such measures could include:
-
•
Using measurable and objective criteria for employee evaluation. This is relatively easy for some areas (for example in sales departments), but rather difficult in creative environments (scientific research, software engineering). Yet despite the difficulty, such standards would decrease the employee’s drive to use political skills for self-promotion, instead of focusing on the needed tasks.
-
•
Giving prospective candidates for promotion tasks related to the nature of duties at the higher level (e.g. temporary management of small groups, responsibility for analysis of results and preparing directions for action for workgroups and departments etc.) and measuring results of such assignments. These results should be used when considering promotion, as they estimate the productivity at the higher level, and thus decrease the effect of Peter Principle.
-
•
Introduction of horizontal advancement paths, in which employees who do not fit into the traditional promotion model (for example brilliant engineers lacking managerial skills) would still be able to achieve satisfaction within a company, without falling prey to the Peter Principle trap.
Even a moderate decrease of the company susceptibility to political ploys, and improvement of the “heritability” of skills after promotion may lead to dramatic improvement of overall productivity, not by single percentage points but by a significant factor.
III.5 Model extensions
The initial model presented here can be expanded in several directions. The best source of improvement of the model would be when the computer simulation could be coupled with some “microscopic” sociology studies (for example interviews focused on measuring the payoff of political activities within the organization). Especially, if one could provide comparative studies of general effectiveness of organizations built upon different social models.
The model itself is quite flexible and allows many improvements. Such extensions of the computer model would still miss the effects due to individuality of participants and specific nature of the organization but bring the simulated strictures still closer to reality. For example it would be interesting to study results of changes in organization policies related to promotion and susceptibility to self-interests in a “mature” environment. In such simulations an organization resulting from some years of evolution under one set of parameters would be used as the starting point of a new simulation, for example with a changed value of . This would correspond to corrective measures undertaken by top management, especially after a major change. The main question of such studies would be to determine, for example, the expected improvements due to lowering of susceptibility or the time it takes to see such improvement take the effect.
To make the model more realistic one might divide the organization into a few ‘divisions’. Promotion within a division (e.g. sales, marketing, manufacturing) should be based on a common sense hypothesis, as a lot of workload remains the same, so the effective results should be changing only partially. On the other hand, promotion across the departments should be less frequent and the new value of raw productivity would be totally uncorrelated.
Yet another direction of further research is the study of dependence of overall output and effectiveness per employee in a growing organization – as most of real life organizations are dynamically changing their size.
The model can also be improved by including effects of employee dissatisfaction and restlessness when they are not promoted. In the current paper, the external candidates come from an infinite pool of agents with random characteristics. In real life they would be the people from appropriate levels of other organizations (usually quite similar to the studied one). By symmetry, this effects should be included in the study: a process of agents leaving the company to join other ones. In contrast with firing of the worst perceived performers, here the agents most likely to leave would be the ones who have relatively high opinion of themselves and willingness to seek new opportunities. These qualities, in the first approximation are related to the self-promotion drive The probability should increase with time spent at the same position. As a result, increases of productivity introduced by the pre-screening of external candidates would be counterbalanced by the outflow of the restless, disgruntled employees.
References
- Ball [2004] Philip Ball. Critical mass: How one thing leads to another. Farrar Straus Giroux, 2004.
- Andreski [1972] Stanislav Andreski. Social Sciences as Sorcery. André Deutsch, 1972.
- Pluchino et al. [2009] Alessandro Pluchino, Andrea Rapisarda, and Cesare Garofalo. The Peter Principle Revisited: A Computational Study, Jul 2009. URL http://arxiv.org/abs/0907.0455.
- Peter and Hull [1969] L.J. Peter and R. Hull. The Peter Principle. William Morrow and Company, New York, 1969.
- Kane [1970] J. Kane. Dynamics of the Peter Principle. Management Science, 16(12), 1970.
- Fairburn and Malcomson [2001] J.A. Fairburn and J.M. Malcomson. Performance, promotion, and the Peter principle. The Review of Economic Studies, 68(1):45–66, 2001.
- Lazear [2001] E.P. Lazear. The Peter principle: promotions and declining productivity. Technical report, NBER Working Paper No. 8094, 2001. URL http://economics.uchicago.edu/download/peterprinciple.pdf.
- Lazear [2004] E.P. Lazear. The Peter Principle: a theory of decline. Journal of Political Economy, 112(S1):141–163, 2004. URL http://ftp.iza.org/dp759.pdf.
- Adams [1996] Scott Adams. The Dilbert Principle. Harper Business, 1996.
- Faria [2000] Joao Ricard Faria. An Economic Analysis of the Peter and Dilbert Principles. Technical report, UTS Working Paper No. 101, 2000. URL http://www.business.uts.edu.au/finance/research/wpapers/wp101.pdf.
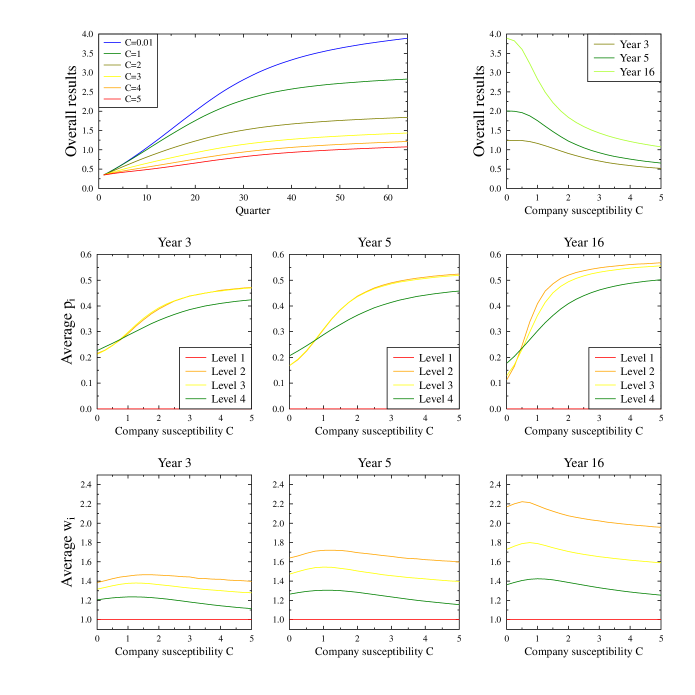
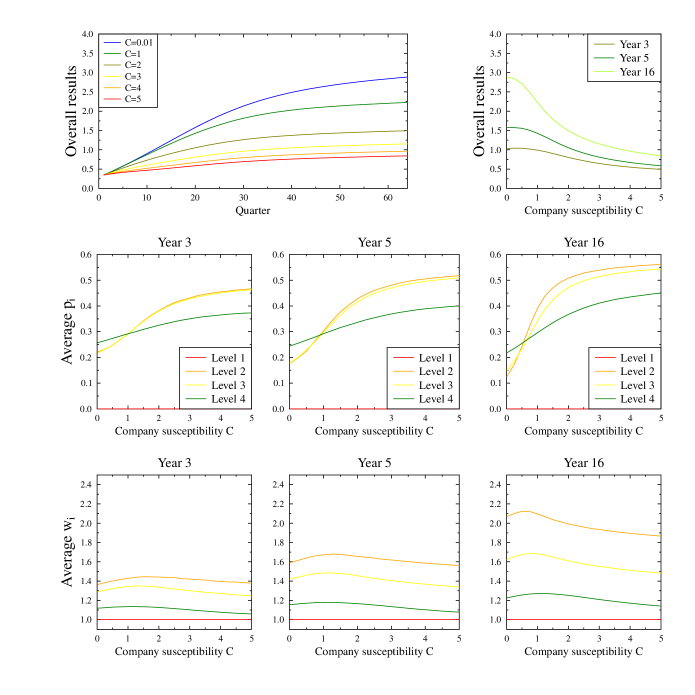
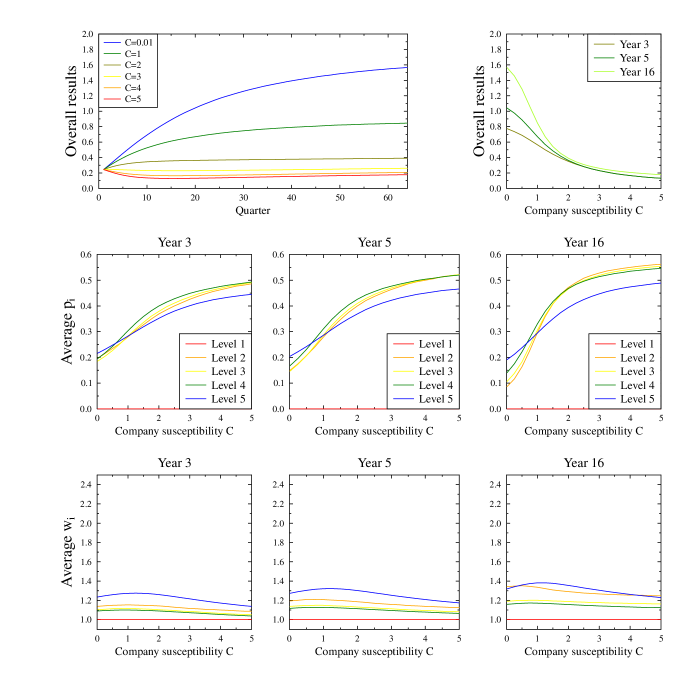
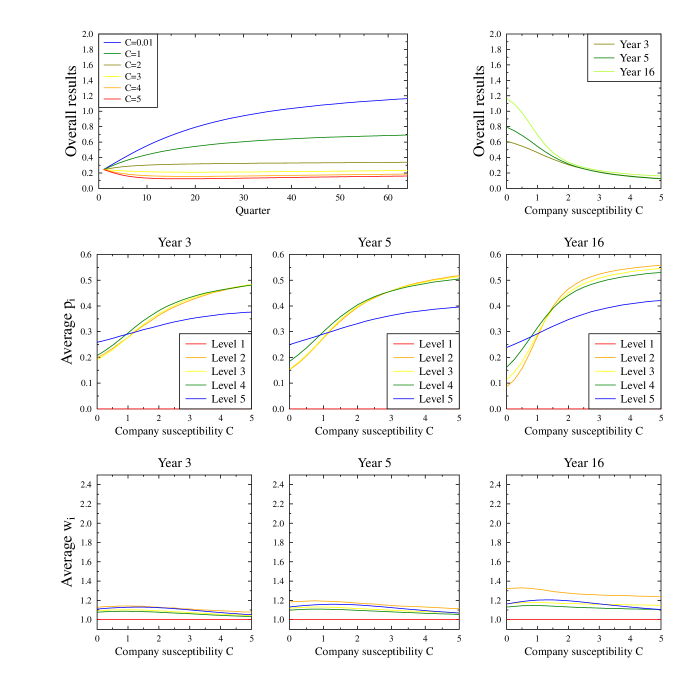
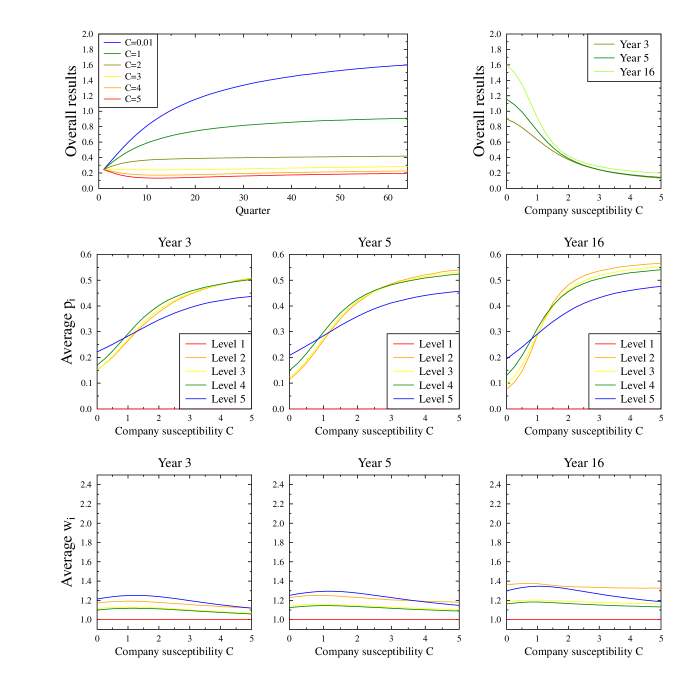
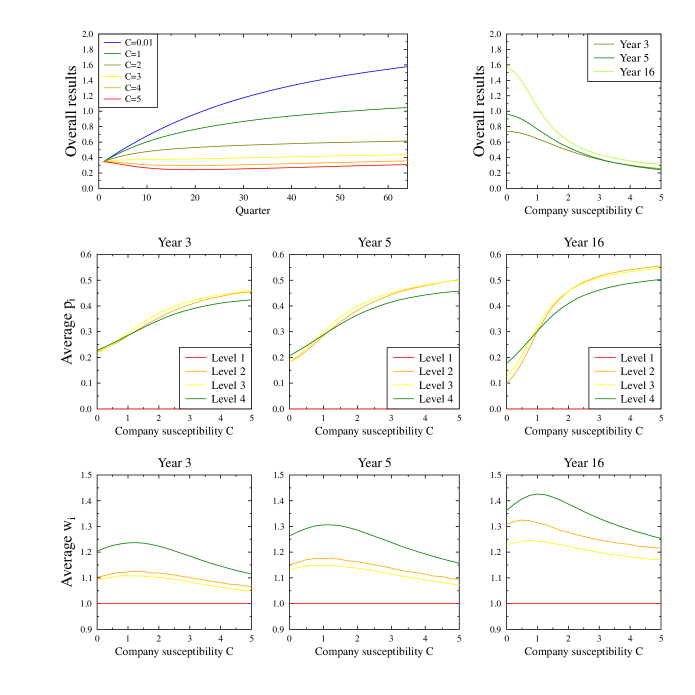
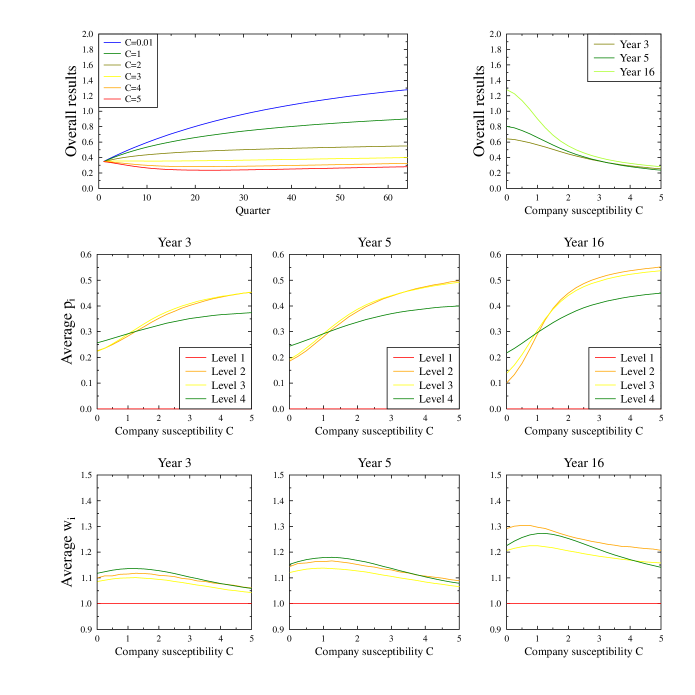
Appendix: Detailed simulation results
In this section we present more detailed simulation results for several sets of model parameters. We focus on the time evolution of average organization productivity (starting from a random configuration), dependence of this productivity on the susceptibility after 3, 5 and 15 years of evolution and similar dependence of the average and values at various levels of the organization. Overall productivity has been normalized to that of a “neutral” organization, in which all employees have neutral productivity (), and no self-promotion (), which means that the managers neither increase nor decrease their team output. In such neutral configuration, the productivity is given by the sum of work done by the workers at the lowest level. Such normalization allows to see the effects independently to organization size and number of levels.