Peculiarities and variations in the optical spectrum of the post-AGB star V448 Lac = IRAS 22223+4327
Abstract
Repeated observations with high spectral resolution acquired in 1998–2008 are used to study the temporal behavior of the spectral line profiles and velocity field in the atmosphere and circumstellar envelope of the post-AGB star V448 Lac. Asymmetry of the profiles of the strongest absorption lines with low-level excitation potentials f eV and time variations of these profiles have been detected, most prominently the profiles of the resonance lines of BaII, YII, LaII, SiII. The peculiarity of these profiles can be explained using a superposition of stellar absorption line and shell emission lines. Emission in the (0; 1) 5635 Å Swan band of the C2 molecule has been detected in the spectrum of V448 Lac for the first time. The core of the H line displays radial velocity variations with an amplitude of Vr8 km/s. Radial velocity variations displayed by weak metallic lines with lower amplitudes, Vr1–2 km/s, may be due to atmospheric pulsations. Differential line shifts, Vr = km/s, have been detected on various dates. The position of the molecular spectrum is stationary in time, indicating a constant expansion velocity of the circumstellar shell, Vexp = 15.2 km/s, as derived from the C2 and NaI lines.
1 Introduction
The semiregular variable star V448 Lac=BD+42o4388, identifed with the infrared source IRAS 22223+4327 (hereafter IRAS 22223), is one of the most interesting and fairly well-studied protoplanetary-nebula (PPN) candidates. Hrivnak [1] classified the star’s spectral type as Sp = G0Ia, whereas Arkhipova et al. [2] assigned a spectral type of F8I earlier. IRAS 22223 belongs to a small subgroup of PPN candidates with infrared spectra containing unidentified [3] emission at = 21 [4]. V448 Lac displays photometric variability typical of such objects: its maximum brightness amplitude is 0.2–0.3m in the UBV bands [2, 5]. The spectral-energy distribution of V448 Lac is two-peaked, as is also typical of PPNs. The total energy radiated in the visible is virtually the same as that radiated in the IR [see Fig. 5 in 4].
In the short-lived PPN evolution stage, we observe intermediate-mass stars (with initial masses of 3–8 M⊙), evolving from the asymptotic giant branch (AGB) to the planetary-nebula (PN) stage. The stellar evolution between the AGB and PN stages from the mechanisms and characteristic features of mass loss by AGB stars, to the complex shell morphology of PPNs and PNs, remains incompletely understood. The role of binarity has also been only poorly studied: it is difficult to detect a companion of a PPN in the complex pattern of the velocity field in the star’s atmosphere and shell. The main features of the PPN evolution stage are presented, for example, in [6]. Having consecutively passed through evolutionary stages with core hydrogen and helium burning, intermediate-mass AGB stars undergo a large mass loss in the form of their strong stellar winds (the mass-loss rate can reach 10yr). The remnant that is left after the star has lost most of its mass has a degenerate carbon and oxygen core with a typical mass about [7], surrounded by an expanding gas and dust shell, as a rule having a complex structure. Data on PPNs can be used to investigate mass loss via stellar wind, and provide unique possibilities for studies of stellar nucleosynthesis and the mixing and dredge-up of nuclear-reaction products from earlier stages of the star’s evolution to the surface layers. PPN studies are also important for understanding the evolution of galaxies, since the gas and dust ejected by such stars in the course of their evolution enrich their galaxies in heavy elements.
Post-AGB stars evolve very rapidly. A good example is the famous star FG Sge, which changed its spectral type from O3 to K2 over the past century [8]. Secular variations of the main parameters observed for several PPNs have stimulated spectroscopic monitoring of the most probable PPN candidates. Spectral variations have been detected for the optical counterparts of IRAS 01005+7910 [9], IRAS 05040+4820 [10], IRAS 18062+2410 [11], and IRAS 20572+4919 [12]; a trend of the effective temperature Teff was found for the star HD 161796 = IRAS 17436+5003 [13]. In this paper, we present the results of our highspectral-resolution monitoring of V448 Lac and compare these new data to those published earlier. Our main goal is to search for possible variations of the spectral features, and to study the velocity fields in the star’s atmosphere and shell. Section 2 briefly describes our observation and data-reduction techniques; Section 3 discusses our results; Section 4 considers stars with similar spectral characteristics; and Section 5 presents a brief summary of our main results.
2 Observations and spectral data reduction
Our spectroscopic data for V448 Lac were taken at the Nasmyth focus of the 6-m telescope BTA of the Special Astrophysical Observatory (SAO, Russian Academy of Sciences) with the NES echelle spectrograph [14, 15]. The observations were performed using a 20482048-pixel CCD–chip and image slicer [15]. The spectral resolution was R60000 and the signal-to-noise ratio S/N100. The Table presents the mean observing epochs and the measured heliocentric velocities. We extracted the one-dimensional vectors from the 2D echelle spectra using the modified [18] ECHELLE procedure of the MIDAS software package. We removed cosmic-ray traces via median averaging of two spectra obtained one after another. Our wavelength calibration was done using spectra from a Th-Ar hollow-cathode lamp. We checked and corrected the instrumental agreement between the spectra of the star and the hollowcathode lamp using telluric [OI] and H2O lines. The procedures used to measure the radial velocities, Vr, from the NES spectra and the sources of errors are described in more detail in [19]. The rms uncertainties of the Vr measurements for stars with narrow absorption lines are 0.8 km/s (the uncertainty from a single line).
3 Discussion of the results
3.1 Peculiarity in the optical spectrum of V448 Lac
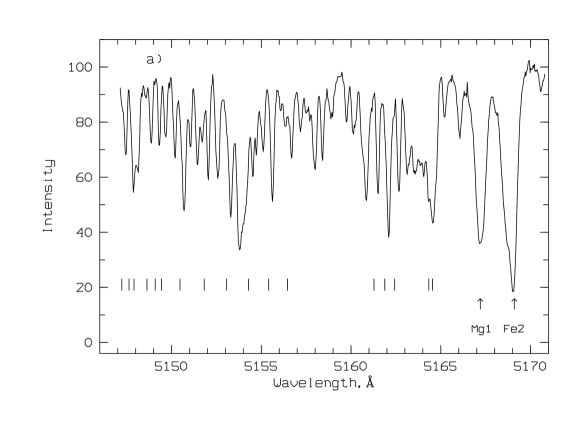
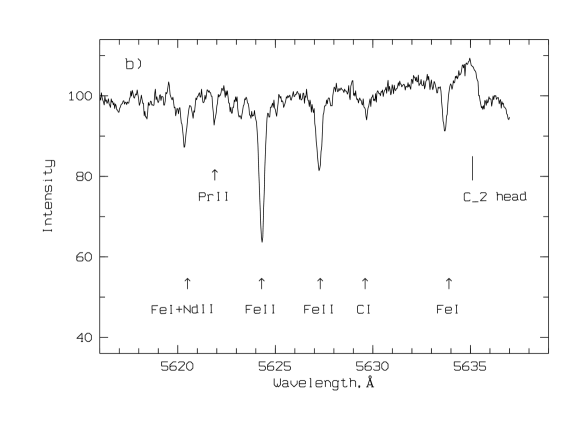
The main peculiarities of the optical spectrum of V448 Lac were already noted in the first low-spectralresolution studies. Hrivnak [1] found that, compared to the spectrum of a normal supergiant of a similar temperature, the spectrum of V448 Lac exhibited enhanced lines of s-process elements (BaII, YII, LaII) (we consider profile peculiarities for lines of heavy metal ions in the spectrum of V448 Lac in more detail in Section 3.2), and that C2 and C3 absorption bands were present. Our high-resolution spectra contain the (0; 0), (0; 1), and (1; 0) vibrational Swan bands of the C2 molecule. Figure 1a shows a portion of the spectrum with the vibrational C2 (0; 0) band of the Swan system, whose head is at 5165.2 Å. We mark there the lines of rotational transitions we used to derive the shell expansion velocity (see Section 3.2 below for details). Figure 1b demonstrates that the C2 (0; 1) 5635 Å band in the spectrum of V448 Lac is observed in emission. This circumstance was not noted in [1].
| JD=245… | Vr, / | |||||
|---|---|---|---|---|---|---|
| metals | HI | D1,2 NaI | C2 | |||
| lines | 1 | 2 | 3 | |||
| 1009.36 | 39.1 | 55.4 | 32.5 | 12.4 | (22) | |
| 1273.48 | 42.5 | 35.8 H | 55.3 | 33.4 | 12.2 | |
| 2131.53 | 42.6 | 40.2 H | 55.7 | (26) | ||
| 3691.25 | 41.8 | 40.2 H | 55.4 | 29.3 | 11.3 | |
| 3692.43 | 41.7 | 41.2 H | 55.7 | 30.0 | 11.5 | |
| 3694.36 | 41.5 | 41.0 H | 55.3 | 29.2 | 11.1 | |
| 4721.15 | 41.8 | H | 55.3 | |||
| 4760.17 | 40.8 | H | 55.6 | |||
| 4774.34 | 41.9 | H | 55.8 | (84) | ||
| 41.5 [16] | [17] | |||||
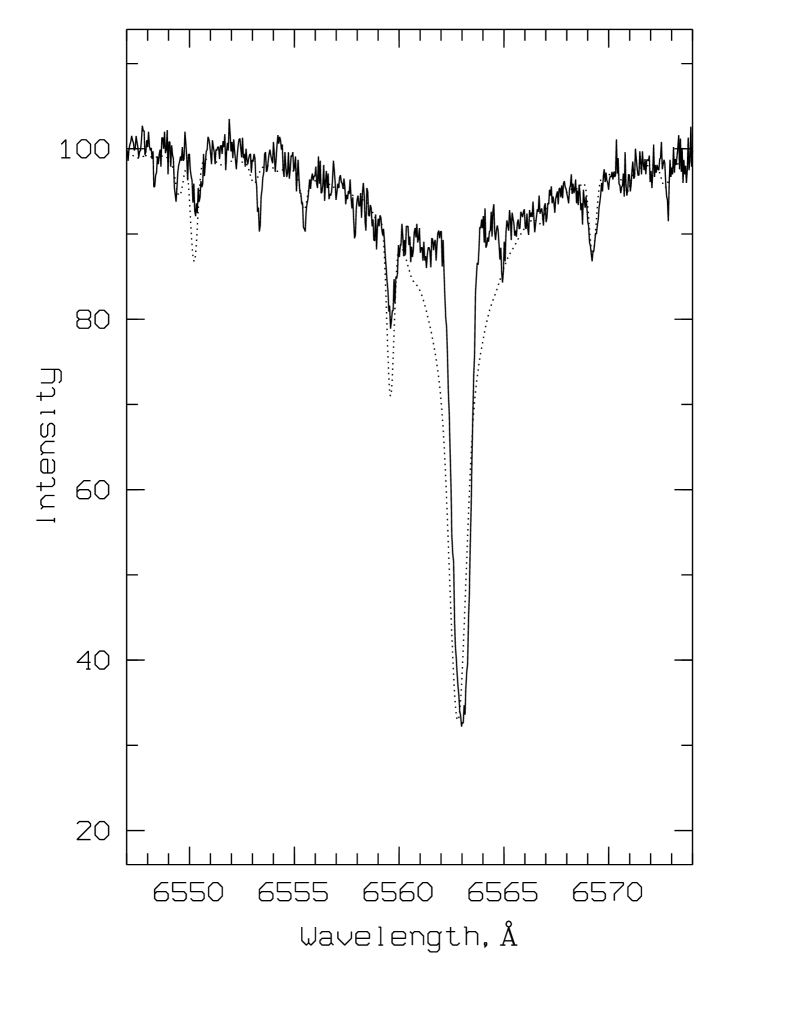
Neutral-hydrogen lines in PPN spectra are known to have peculiar profiles. Examples of the variety of the observed profies are presented, for example, in [20]. The complex profile of the H line in the spectrum of V448 Lac consists of a narrow core and broad wings. Figure 2 shows that the observed profile of this line does not agree with the theoretical profile we computed assuming local thermodynamic equilibrium (LTE) and using the main parameters of V448 Lac from [16] for a solar hydrogen abundance. This discrepancy suggests that the shell may contribute to the profile formation, and that the conditions under which the H core profile is formed may deviate from LTE. Figure 3 shows the core of the H line in the spectra of V448 Lac observed on three dates in 2005 and 2008. Figure 3 shows that the core of the H line varies; considering the data in the Table, we conclude that the H core is systematically shifted towards shorter wavelengths relative to the of lines of metals.
3.2 Asymmetric profiles of the strongest absorption lines
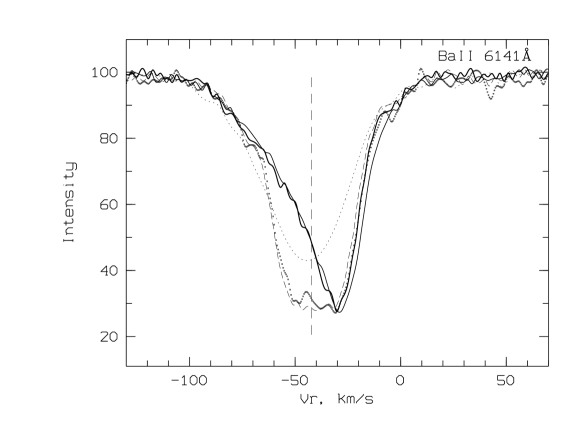
The strongest absorption lines in the spectrum of V448 Lac are low-excitation BaII lines. It follows from Fig. 4 that the equivalent width Wλ of the BaII 6141 Å line is close to that of the H line. Our high spectral resolution made it possible to detect another, previously unnoticed peculiarity of the optical spectrum of V448 Lac: asymmetry of the profiles of the strongest absorption lines of ions of the heavy metals BaII, LaII, YII, and ScII, as well as of the SiII 6347 Å line. This asymmetry is clearly demonstrated by the profiles of the BaII 6141, 6496, 5853 Å lines in Fig. 5. All strong BaII, LaII, YII, SiII, and ScII lines with depths R50–70 (with the exception of hydrogen lines) display the same kind of asymmetry: the short-wavelength wing is more extended that the long-wavelength wing. Comparing the spectra taken on different dates, we see that the profiles of these lines, formed in the expanding shell of the star, vary with time as well as with line strength. The strong lines demonstrate larger-amplitude profile variations with time, as well as shifts of their cores towards longer wavelengths compared to the weakest absorption lines: the velocities from the cores of these absorption lines are within –37Vr–30 km/s. Both these properties are also present for the H and H lines (third column of the Table): –41Vr–32 km/s. To illustrate the profile variations of strong lines, Fig. 6 shows the profile of the BaII 6141Å line for 4 observing epochs.

Note that the variations are displayed only by the short-wavelength profile wings and the position of the core, whereas the positions and intensities of the long-wavelength wings of these strong BaII, LaII, and YII absorption lines do not vary in time. An important feature is that the radial velocity measured for the wings of these strongest absorption lines (near the continuum) are close to the velocity derived from the weak lines. Because of this, the radial velocity measured from the upper part of the profile is more negative than the velocity measured for the core. Taken together, this behavior of the profiles of the strongest lines disagree with the profile variations expected for Schwarzschild’s mechanism [21], which has been used to explain line splitting in the atmospheres of some long-period variables [22]. The stationary longwavelength profile wings also distinguish the profile variations we detected from those observed in the spectra of selected cepheids (see [23] and references therein).
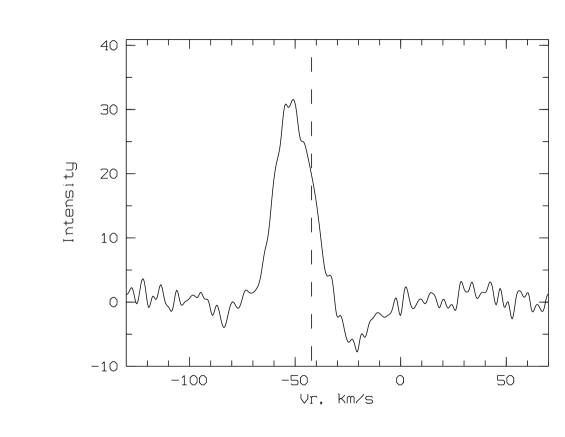
In order to explain the unusual peculiarity of the profiles of strong lines of heavy-metal ions, we substracted the asymmetric profile for the BaII 6141 Å line recorded on JD 2454760.17 from the symmetric profile observed on JD 2453694. The results in the appearance of a P Cygni-type emission line, shown in the bottom panel of Fig. 6. The emission line with a half-width exceeding 20 km/s is shifted towards shorter wavelengths relative to the systemic velocity. The emission maximum is at Vr km/s, identifying the circumstellar shell as the probable formation region of the emission. Confirmation of this is provided by the fact that that the epochs of the observations of V448 Lac when its spectrum demonstrated distorted profiles of the strong absorption lines are also characterized by enhanced emission in the Swan C2 (0; 1) 5635 Å band. One possible mechanism for emission from the circumstellar shell is the dissipation of energy from a shock excited by pulsations in the stellar atmosphere [24].

Similar emission lines of the ScII, TiII, FeII, YII, and BaII ions with widths of approximately 10–20 km/s and shifted towards shorter wavelengths are known for pulsating R CrB stars near their brightness minima [25–27]. In the spectrum of R CrB, such emission features appear in the cores of absorption lines after a decrease of the star’s brightness by 3m [26]. It is believed that the emission is formed in the upper atmospheres (chromospheres?) and shells of R CrB stars, due to the passage of shocks generated by pulsations. However, the atmospheric pulsations in the case of V448 Lac have low amplitudes, and it remains unclear how shocks could form, since this requires a much higher pulsation amplitude, Vr5–10 km/s [28].
The profile variations we found in the spectrum of V448 Lac could be due to a non-spherical shape and/or non-uniform structure of its circumstellar shell. At epochs when the observer receives radiation that is not distorted by the shell, the star’s spectrum displays symmetric absorption profiles. At epochs when the light from the star comes through and is scattered by the circumstellar matter of the expanding gas and dust shell, the shell’s emission profile is superposed on the profiles of the strongest absorption lines. In fact, the IR image of the nebula around V448 Lac obtained with a spatial resolution of about 1 is aspherical. Meixner et al. [29] suggested it was a rare type of toroidal shell. Observations with the Hubble Space Telescope in the visible with a higher resolution, 0.27pixel [30], detected more detailed structure of the nebula, in the form of 2 pairs of lobes.
3.3 Radial velocity variations lines of metals
To derive the mean radial velocity, Vr, we measured a large number of the least blended absorption lines in the spectra of V448 Lac (300–400 lines in each spectrum). We selected the lines using a spectral atlas for the post-AGB star HD 56126, which can be considered a canonical post-AGB object [31]. The atlas was prepared by Klochkova et al. [32] using echelle spectra taken with the same NES spectrograph on the 6-m SAO telescope. The amount of blending in the spectrum of V448 Lac is higher than in the spectrum of HD 56126 for two reasons: first, the effective temperature is lower for V448 Lac (Teff = 6500 K [16]) than for HD 56126 (Teff = 7000 K [33]), and second, the metallicity of V448 Lac ([Fe/H] dex [16]) is higher than that of HD 56126 ([Fe/H] dex [33]).
Because of the stronger blending, the accuracy of Vr measurements from single lines (the rms deviation, ) is somewhat worse for our V448 Lac spectra than for stars with narrow, medium-intensity absorption lines: about 1.5 km/s. In the Table, the data from the 2005–2008 spectra are complemented with our Vr measurements from spectra obtained in 1998–2001 at the 6-m telescope using the “Lynx” echelle spectrograph [34] with a resolution of R = 25000. The last line of the Table also presents the mean Vr values from [16]. This measurement is important for us because the spectrum was acquired earlier than our first observations. It follows from the long-term observations of Hrivnak [5] that the amplitude and period of the radial-velocity variations of V448 Lac are typical of PPNs: the radial velocity varies from –36 to –43 km/s with the period of 89d. All our mean Vr values for metallic absorption lines in the Table are in a narrower range, from –39 to –42 km/s.
Taking into account the large probability of differential motions in the outer atmospheric layers of V448 Lac, we tabulated Vr values for individual lines and groups of lines. The second column of the Table presents the mean velocity derived from absorption lines of low and intermediate intensity, Vr(Met). This restriction of the line sample is related to the revealed differential line shifts (see Section 3.4 for more detail). Subsequent columns of the Table contain the velocities derived from the H or H lines, the short-wavelength shell component (column “1”), the atmospheric component (column “2”), the longwavelength interstellar component (column “3”) of the D lines of the NaI doublet (cf. the observed profile of the NaI doublet lines in Fig. 7), and rotational lines of the C2 Swan bands. Let us consider these results in more detail.
Neutral hydrogen lines. The velocity measured from the cores of the H and H differs systematically from the mean for lines of metals, namely they are shifted towards shorter wavelengths. Note also the larger variation amplitude of the radial velocity derived from the H core (Vr 8 km/s) compared to the variations of the mean velocity from weak metallic lines (Vr 1–2 km/s).
Molecular Spectrum. Besides the IR–excess and reddening, the presence of a gas and dust shell around the central stars of PPNs is revealed by molecular features in the optical spectra of these objects. Since molecular spectra can be formed in stellar atmospheres with temperatures Teff 3000 K, they should be formed in circumstellar shells surrounding G0 supergiants. In our recorded wavelength range, the spectra of V448 Lac exhibit vibrational Swan bands of C2. Our high spectral resolution enables accurate measurements of the positions of the rotational lines of the Swan bands. Using the rotationalline wavelengths from the electronic tables of Bakker et al. [17], we measured the positions of several dozen rotational lines of the (0; 0) and (1; 0) Swan bands and determined the mean radial velocity in the band formation region. Since their profies are narrow compared to those of atmospheric lines, the rotational lines of the (0; 0) Swan band are easy to identify in the spectrum of V448 Lac (Fig. 1a). Thus, the uncertainty in the positions of single lines ( 0.8 km/s) is much lower than that for atmospheric absorption lines. Since head (1; 0) Swan band in the short-wavelength part of the spectrum, 4712–4734 AA, is more strongly blended with atmospheric lines, the measurement accuracy is somewhat worse: 0.9 km/s. Our velocity measurements from rotational components of the vibrational Swan bands of C2 gave the mean value Vr(C2) = –57.4 km/s ( 0.8 km/s) from the rotational lines of the C2 (1; 0) band with its head at 4734 Å and from the lines of the C2 (0; 0) band with its head at 5165 Å. The mean velocity for our earliest observation (at JD 2451009.36) is Vr(C2) = –57.2 km/s. These measurements are in excellent agreement with the data of Bakker et al. [17]: Vr(C2) = –57.2 km/s.
The shift of the circumstellar features relative to the systemic velocity enables us to determine the expansion rate of the corresponding regions in the circumstellar shell relative to the systemic velocity, Vlsr. The systemic velocity of IRAS 22223, V km/s (the heliocentric systemic velocity is V km/s) was determined as the velocity of the center of the CO(2–1) emission profile at millimeter wavelengths [35]. In contrast to the CO emission lines formed in the extended envelope expanding in all directions, the observed molecularcarbon absorption lines are formed in a restricted part of the shell located between the star and observer. As a result, we obtain the expansion velocity of the shell (i.e., of the part where the Swan bands are formed), Vexp = 15.2 km/s. This can be interpreted as the expansion velocity derived from the optical spectra; it agrees well with the expansion rate for IRAS 22223, V km/s, from the catalog [36], where numerous observations of circumstellar shells in the CO and HCN molecular bands are collected. Note also that the shell-expansion rate of IRAS 22223 is typical of the circumstellar shells of post-AGB stars (see, for instance, [36]).
In the case of V448 Lac, the heliocentric velocity from the metal lines is close to the systemic velocity, Vkm/s. This provides evidence for the absence of a stellar-mass secondary in the IRAS 22223 system. This result is non-trivial because the chemical evolution, mixing, and dredge-up of the accumulated products of nuclear reactions to the surface atmospheric layers, matter outflow, and the formation of the shell morphology could be different is the presence of a secondary.
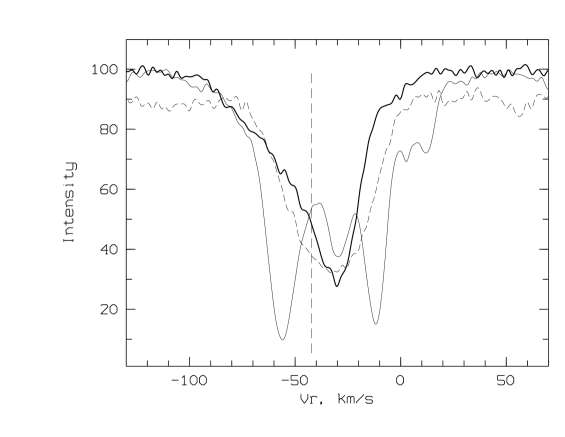
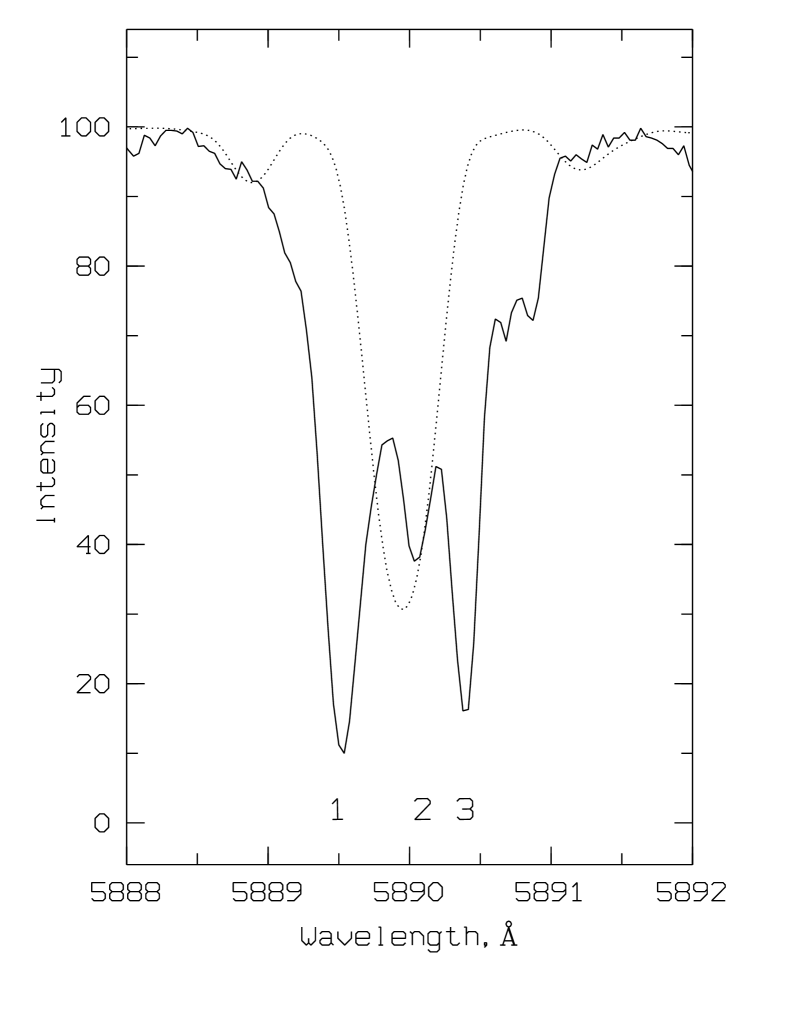
NaI D lines. The lines of the resonance NaI doublet in the spectrum of V448 Lac have a complex structure. It follows from the Table and Fig. 4, which shows the profile of the D1 line, that the doublet lines contain three strong absorption components located at the velocities Vr(NaI) = –55.8, –30.0, and –11.9 km/s. The component with Vr = –55.8 km/s is probably formed in the circumstellar shell, where the shell C2 Swan bands are formed. The component with Vr = –11.9 km/s (V km/s) is interstellar. The presence of this interstellar component in the spectrum of V448 Lac suggests that the star is located behind the local spiral arm in the Galaxy. It follows from [37] that the radial velocity in the local arm is V km/s, while in the Perseus arm, it is V km/s. Thus, the distance to the Perseus arm can be taken as an upper estimate for the distance to V448 Lac. Taking into account Galactic CO maps [38] and the Galactic coordinates (l = 96.75o, b = ) and systemic velocity (V km/s) of IRAS 22223, we obtain for the estimated distance of the source from the Sun 3.5 kpc.
It is more difficult to determine where component “2” in the system, whose velocity is Vr km/s, is formed. To determine this, we compared the observed profile of the NaI D lines to the theoretical profile computed using model parameters corresponding to the results from [16]. For our spectral synthesis, we applied the SynthV code developed by Shulyak et al. [39] and adapted by its authors for use in a Linux operating system. We computed a flat-parallel model with the stellar parameters from [16] using the code of [39]. Comparing the profiles in Fig. 7, where the position of the theoretical profile corresponds to the mean velocity from atmospheric absorption lines of metals, we can see that component “2” resembles the atmospheric NaI line with its core distorted similarly to the cores of strong BaII lines. This is confirmed by the similarity of the BaII 6141 Å line profile and the profile of the NaD component with Vr = –30 km/s in Fig. 4.
3.4 Differential line shifts and probable pulsations in the atmosphere
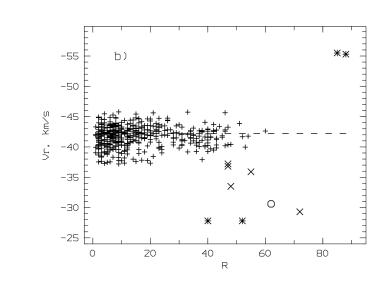
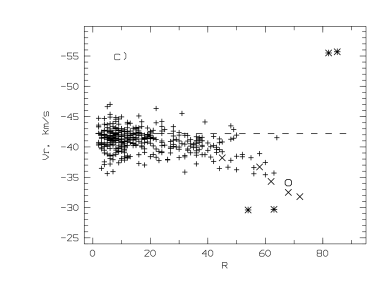
In the PPN case, in addition to Vr variations with time, the radial-velocity changes can also be complicated by differential motions in the extended atmospheres of these objects. A detailed analysis of the radial velocities from spectra with high spectral and temporal resolution for selected brightest PPNs enables the detection of behavior differences for radial velocities determined from lines with different excitations, formed at different depths in the stellar atmosphere. The extended spectral range recorded using our echelle spectrograph enabled us to study the differential radial velocities measured for lines of different intensities for V448 Lac. We plotted Vr(R) diagrams for each of our spectra of V448 Lac – relations between the heliocentric radial velocity, Vr , measured for the core of an absorption line and its central depth, R. Note that the continuum level corresponds to zero depth, while the strongest lines have R 100. Some examples of such relations typical of V448 Lac are shown in Fig. 8. The star’s center-of-mass velocity, V km/s [35], derived from CO observations in the millimeter, is indicated by the horizontal dashed lines in the panels. In all the diagrams in Fig. 8, the circumstellar and atmospheric components of the NaI doublet are marked, as well as the cores of the H and H lines and of resonance lines with abnormal profiles. Panel (d) also indicates the velocity from the rotational lines of the CO Swan system for the mean depth of these lines.
Klochkova and Chentsov [40] earlier analyzed the radial velocities of HD 56126 using a large set of lines with various natures (weak atmospheric absorption lines, HI lines, molecular bands, profile components of the NaI D lines) in spectra taken on different dates. These data revealed radial-velocity variations of HD 56126 even for the weakest absorption lines [40, Fig. 7], confirming the pulsational nature of the radial-velocity variations. By analogy with HD 56126, this suggests that the small radial-velocity variations of V448 Lac are due to low-amplitude pulsations. In this case, we expect variability of Vr from all lines formed in the star’s atmosphere, including low-intensity lines. Actually, Fig. 8 confirms the presence of Vr variations for weak lines in the spectrum of V448 Lac: the mean radial velocity derived for the spectrum taken on JD 2454774.34 from weak lines (R 20) coincides with the systemic velocity of V448 Lac, while the weak-line radial velocity for a spectrum obtained two weeks earlier (JD 2454760.17) is systematically below the systemic velocity. The difference is not large (–2 km/s), but is significant, given the small uncertainties of our velocity measurements. Thus, variations of the star’s radial velocity were also detected for the weakest absorption lines (with depths R 20) in the spectra of V448 Lac, a possible manifestation of low-amplitude pulsations. The presence of pulsations should be no surprise for V448 Lac, which has an extended atmosphere and is located in the instability strip. Hrivnak and Lu [5] also concluded earlier that the Vr and brightness variations of V448 Lac had a pulsational character. In addition to the fact that the brightness and radial velocity vary, these authors noted the irregular character of the variations. Note that, in contrast to our data, which is differentiated according to line groups, the radial velocities of [5] were derived using a spectrometer, without taking into account line intensity differences.
Figure 8 shows that the dynamic state of the atmosphere was different at the different observing epochs considered: three of the panels (b, c, d) show special positions of the cores of the neutral hydrogen and low-excitation BaII, LaII, and YII lines, whose profile peculiarity was already mentioned in Section 3.1. However, the positions of all the stellar lines in the spectrum for JD 24543964.36 (panel a), independent of their depth, corresponds to the systemic velocity of the star, while the observations for JD 2454760.17 reveal differential line shifts up to Vr km/s that depend on the line intensities.
4 Spectra of related objects
Features originating in circumstellar shells have long been known in the spectra of high-mass F and G hypergiants with IR–excesses (see, for example, [41, 42]). It follows from [41] that the yellow hypergiant Cas, whose luminosity is close to the Humphreys–Davidson limit, is characterized by a complex, timevariable radial-velocity pattern due to the radial pulsations. One of the results of [41] is the special temporal behavior of the low-excitation absorption lines, in particular, the resonance BaII 6141 Å line, whose core contains a circumstellar component. The high-excitation lines behave regularly with time, whereas the BaII lines show deviations from such behavior. In a restricted phase range, the spectrum of Cas exhibits split cores of the low-excitation lines, probably due to the presence of a variable-intensity emission component. A detailed study of the spectral variations of Cas and a comparison with long-period R CrB variables and post-AGB supergiants was recently presented by Gorlova et al. [43]. These authors note that current models of atmosphere dynamics cannot explain the absorption-core splitting and the appearance of emission lines in the spectra of cool pulsating supergiants [43]. In addition to taking into account dynamic phenomena, it is necessary to consider non–LTE excitation mechanisms for spectral lines.
In the case of low-mass supergiants in the post–AGB stage, the influence of the circumstellar shell on the profiles of lines with low excitation potentials for their lower levels was long known only for the D–lines of the resonance doublet of sodium, NaI. Parthasarathy et al. [44] were the first to note the abnormal profile of the BaII 6141 Å line in the spectrum of the post–AGB star HD 56126. We recently published spectroscopy of the post-AGB star V354 Lac where we have detected manifestations of the star’s shell in the profiles of the heavy-metal ions BaII, LaII, CeII, and NdII for the first time [45]. Let us consider the properties of these two stars compared to V448 Lac in more detail.
4.1 Analogy to V354 Lac
The semiregular variables V448 Lac and V354 Lac (identified with the IR–source IRAS 22272+5435) have similar main parameters, spectral types and luminosity classes, and large IR–excesses. The IR–spectra of both stars display emission at = 21 . A comparison of the chemical abundances determined for V448 Lac in [16] and for V354 Lac in our recent paper [45] also reveals similar peculiarities: their atmospheres are depleted in iron, and show large excesses of carbon and heavy metals. The combination of these properties makes it certain that both stars are in the transition to planetary nebulae. The IR observations of [46] indicate that the morphology of the nebulae around V354 Lac and V448 Lac are toroidal. The systemic velocities of the two stars are also similar, and the same component of interstellar sodium, at Vr = km/s, is identified in both their spectra. In addition, like that of V448 Lac, the spectrum of V354 Lac displays abnormal profies for lines of heavy-metal ions with low-level excitation potentials eV [45]. The anomaly of the profiles in the spectrum of V354 Lac is more strongly expressed, and is sometimes observed as split absorption cores. The only significant difference between the spectra of V448 Lac and V354 Lac is that all the Swan bands in the spectrum of V354 Lac are in absorption, while we see the C2 (0; 1) 5635 Å band in emission in the spectrum of V448 Lac.
4.2 Analogy to HD 56126
The characteristic peculiarities observed for V448 Lac (its brightness variations, instability of the radial velocities of atmospheric lines, and the spectral peculiarities in the IR and optical, including molecular features and the variable and peculiar H profile), as well as the similarity of the elemental abundances in the atmospheres of the two stars, suggests a similarity between this star and the post-AGB star HD 56126 = IRAS 07134+1005. HD 56126 has been thoroughly studied due to its high visual brightness. Like V448 Lac, HD 56126 is a member of a small subgroup of PPNs that exhibit emission at 21 . The members of this PPN subgroup have central-star atmospheres enriched in carbon and sprocess heavy metals (cf. [16, 20] for details). It is interesting that the shell morphology is also toroidal for this object [47]. In general, HD 56126 can be considered a canonical post-AGB object.
Like for V448 Lac, the H line in the spectrum of HD 56126 has an abnormal profile, whose longterm variations were studied by Oudmaijer and Bakker [48]. Barthes et al. [49] conducted a detailed study of variations of the brightness and atmospheric velocity field of HD 56126. Having analyzed extensive photometric and spectroscopic monitoring data for HD 56126, Barthes et al. [49] determined a radial pulsation period of P = 36.8d, with the brightness and radial-velocity semi-amplitudes being 0.02 m and 2.7 km/s. They emphasize that the passage of pulsation-driven shocks leads to complex dynamics in the upper atmospheric layers where the cores of hydrogen lines are formed. Thus, the peculiarity of provide crucial information that can help reveal the structure of the stellar environs.
In addition to the similar properties of 448 Lac and HD 56126, we also note certain differences between the spectroscopic features of interest. One of the main results of our spectroscopic study of V448 Lac is the discovery of asymmetry and variability of the profiles of strong atmospheric absorption lines of BaII etc. However, the photospheric components of the Na D double in the spectrum of HD 56126 do not reveal such peculiarities [49]. Nevertheless, noting the asymmetry of the BaII profiles in the spectrum of HD 56126, Parthasarathy et al. [44] suggested that there is a contribution from shell component.
5 Conclusions
We have detected asymmetry of strong absorption lines with lower-level excitation potentials 1 eV in optical spectra of the post-AGB star V448 Lac obtained using the echelle spectrograph of the 6-meter SAO telescope with a spectral resolution of R 60 000. This is most notably true of the resonance absorption lines of the BaII, YII, LaII ions. We detected profile variabilities of these lines with time. These profile peculiarities can be explained as superpositions of spectral features: absorption lines formed in the star’s atmosphere and shell emission lines.
The observed profile of the H line, whose core varies with time, disagrees with the theoretical profile computed for the star’s main parameters and a normal (solar) hydrogen abundance. This suggests the presence of a contribution by a shell to the profile and/or deviations of the formation conditions for the H profile from LTE. We found radial-velocity variations in the H core with amplitude Vr km/s. Variations of the mean velocity with a lower amplitude, Vr km/s, were also detected for the weakest absorption lines in the spectra of V448 Lac (with depths of R 20), a possible manifestation of low-amplitude pulsations. At some epochs, we found differential shifts in the positions of lines with different intensities.
The position of the molecular spectrum does not change with time, indicating a stationary shell expansion rate. The expansion velocity of the shell in the formation region of the C2 Swan bands is Vexp = 15.2 km/s.
Finally, we emphasize that explaining the variations of Vr and the line profiles in the spectra of V354 Lac and V448 Lac and the development of models for these systems require further studies of these (and related) objects, including spectroscopic monitoring and spectropolarimetry. Spectropolarimetry with high spectral resolution can provide crucial information that can help reveal the structure of the stellar environment.
Acknowledgments
This study was supported by the Russian Foundation for Basic Research (project code 08–02–00072 a) and the Basic Research Program of the Presidium of the Russian Academy of Sciences “The Origin, Structure, and Evolution of Objects in the Universe”.
References
- [1] 1. B. J. Hrivnak, Astrophys. J. 438 341 (1995).
- [2] 2. V. P. Arkhipova, R. I. Noskova, N. P. Ikonnikova, and G. V. Komissarova, Astron. Lett. 29 480 (2003).
- [3] 3. B. W. Jiang, Ke Zhang, and Aigen Li, Astrophys. J. 630 L77 (2005).
- [4] 4. S. Kwok, B. J. Hrivnak, and T. R. Geballe, Astrophys. J. 454 394 (1995).
- [5] 5. B. J. Hrivnak and W. X. Lu, in The Carbon Star Phenomenon, Ed. by R. F. Wing (Kluwer Academic, Dordrecht, 2000), p. 293.
- [6] 6. T. Blocker, Astrophys. Space Sci. 275 1 (2001).
- [7] 7. M. R. Schmidt, Astrophys. Space Sci. 265 271 (2001).
- [8] 8. C. S. Jeffery and D. Schonberner, Astron. Astrophys. 459 885 (2006).
- [9] 9. V. G. Klochkova, M. V. Yushkin, A. S. Miroshnichenko, et al., Astron. Astrophys. 392 143 (2002).
- [10] 10. V. G. Klochkova, E. L. Chentsov, V. E. Panchuk, and M. V. Yushkin, Inf. Bull. Variable Stars 5584 1 (2004).
- [11] 11. V. P. Arkhipova, V. F. Esipov, N. P. Ikonnikova, et al., Astron. Lett. 33 604 (2007).
- [12] 12. V. G. Klochkova, E. L. Chentsov, and V. E. Panchuk, Astrophys. Bull. 63 112 (2008).
- [13] 13. V. G. Klochkova, V. E. Panchuk, and N. S. Tavolzhanskaya, Astron. Lett. 28 49 (2002).
- [14] 14. V. Panchuk, V. Klochkova, M. Yushkin, and I. Najdenov, in Proc. Joint Discussion No. 4, IAU General Assembly, 2006, Ed. by A. I. Gomez de Castro and M. A. Barstow (Editorial Complutense, Madrid, 2007), p. 179.
- [15] 15. V. E. Panchuk, V. G. Klochkova, M. V. Yushkin, and I. D. Najdenov, Optical Zhurnal 76 42 (2009).
- [16] 16. L. Decin, H. van Winckel, C. Waelkens, and E. J. Bakker, Astron. Astrophys. 332 928 (1998).
- [17] 17. E. J. Bakker, E. F. van Dishoeck, L. B. F. M. Waters, and T. Schoenmaker, Astron. Astrophys. 323 469 (1997).
- [18] 18. M. V. Yushkin and V. G. Klochkova, Preprint Spec. Astrohys. Observ. No. 206 (2005).
- [19] 19. V. G. Klochkova, V. E. Panchuk, M. V. Yushkin, and D. S. Nasonov, Astrophys. Bull. 63 386, (2008).
- [20] 20. V. G. Klochkova, Bull. Spec. Astrophys. Observ. 44 5 (1997).
- [21] 21. M. Schwarzschild, IAU Trans. 8 811 (1952).
- [22] 22. R. Alvarez, A. Jorissen, B. Plez, et al., Astron. Astrophys. 362 655 (2000).
- [23] 23. V. V. Kovtyukh, S. M. Andrievsky, R. E. Luck, and N. I. Gorlova, Astron. Astrophys. 401 661 (2003).
- [24] 24. Yu. A. Fadeev and A. B. Fokin, Astrophys. Space Sci. 111 355 (1985).
- [25] 25. N. Kameswara Rao, D. L. Lambert, and M. T. Adams, et al., Mon. Not. R. Astron. Soc. 310 717 (1999).
- [26] 26. N. Kameswara Rao, B. E. Reddy, and D. L. Lambert, Mon. Not. R. Astron. Soc. 355 855 (2004).
- [27] 27. T. Kipper and V. G. Klochkova, Baltic Astron. 15 521 (2006).
- [28] 28. N. Kameswara Rao, Bull. Astron. Soc. India 33 159 (2005).
- [29] 29. M. Meixner, T. Ueta, A. Dayal, et al., Astrophys. J. Suppl. Ser. 122 221 (1999).
- [30] 30. N. Sliodmiak, M. Meixner, T. Ueta, et al., Astrophys. J. 677 382 (2008).
- [31] 31. V. G. Klochkova, E. L. Chentsov, and V. E. Panchuk, et al., Baltic Astron. 16 155 (2007).
- [32] 32. V. G. Klochkova, E. L. Chentsov, N. S. Tavolganskaya, and M. V. Shapovalov, Astrophys. Bull. 62 162 (2007).
- [33] 33. V. G. Klochkova, Mon. Not. R. Astron. Soc. 272 710 (1995).
- [34] 34. V. E. Panchuk, V. G. Klochkova, I. D. Naidenov, et al., Preprint Spec. Astrophys. Observ. No. 139 (1999).
- [35] 35. A. Omont, C. Loup, T. Forveille, et al., Astron. Astrophys. 267 515 (1993).
- [36] 36. C. Loup, T. Forveille, A. Omont, and J. F. Paul, Astron. Astrophys. Suppl. Ser. 99 291 (1993).
- [37] 37. Y. P. Georgelin and Y. M. Georgelin, Astron. Astrophys. 6 349 (1970).
- [38] 38. J. P. Vallee, Astron. J. 135 1301 (2008).
- [39] 39. D. Shulyak, V. Tsymbal, T. Ryabchikova, et al., Astron. Astrophys. 428 993 (2004).
- [40] 40. V. G. Klochkova and E. L. Chentsov, Astron. Rep. 51, 994 (2007).
- [41] 41. D. L. Lambert, K. H. Hinkle, and D. N. B. Hall, Astrophys. J. 248 638 (1981).
- [42] 42. Y. Sheffer and D. L. Lambert, Publ. Astron. Soc. Pacif. 98 914 (1986).
- [43] 43. N. Gorlova, A. Lobel, A. J. Burgasser, et al., Astrophys. J. 651 1130 (2006).
- [44] 44. M. Parthasarathy, P. Garcia Lario, and S. R. Pottasch, Astron. Astrophys. 264 159 (1992).
- [45] 45. V. G. Klochkova, V. E. Panchuk, and N. S. Tavolganskaya, Astrophys. Bull. 64 155 (2009).
- [46] 46. T. Ueta, M. Meixner, and M. Bobrowsky, Astrophys. J. 528 861 (2000).
- [47] 47. Jun-ichi Nakashima, N. Koning, S. Kwok, and Y. Ziang, Astrophys. J. 692 402 (2009),
- [48] 48. R. D. Oudmaijer and E. J. Bakker, Mon. Not. R. Astron. Soc. 271 615 (1994).
- [49] 49. D. Barthes, A. Lebre, D. Gillet, and N. Mauron, Astron. Astrophys. 359 168 (2000).