Probing Evolutionary Mechanisms in Galaxy Clusters: Neutral Atomic Hydrogen in Abell 1367
Abstract
We present VLA H i imaging data for a field in the NW of the galaxy cluster Abell 1367 (z = 0.02) in an attempt to probe the effect environment has on the interstellar medium of late–type spiral galaxies. Several galaxies, like CGCG 097–087, show pronounced tails and asymmetries, and 7 out of 10 show significant, several kpc offsets between the HI centroid and the optical. We compare our results against a sample of optically bright, late–type galaxies (spirals) across the central 1.5 Mpc of the cluster taken from the Arecibo Galaxy Environment Survey (AGES). We find that these late–type spirals are predominantly found in the northern half of the cluster, especially those that are relatively gas–rich. We calculate the H i deficiency and find that the expected global trend for the H i deficiency of these spirals to increase with projected proximity to the cluster core, seen in clusters like Coma and Virgo, is not observed. We classified the spirals into four evolutionary states, with the galaxies in each state sharing a similar degree of H i deficiency and optical colour. The common characteristics of the spirals in each evolutionary state suggests they have been subject to similar environmental processes. Many of the spirals in the most common evolutionary state (moderate H i deficiency and blue colour) have an H i intensity maximum which is displaced relative to its optical counterpart. The orientation of these offsets and magnitude of their H i deficiencies together with data from other wavelengths provide observational evidence in support of varying degrees of ram pressure stripping and tidal interaction. In general, our results indicate that the H i disks of bright late–type galaxies in the central part of the cluster are subject to both gas loss and morphological disturbance as a result of their interaction with the cluster environment. This provides further observational evidence of a more complex environment in Abell 1367 as compared to Virgo and Coma.
keywords:
galaxies: evolution — galaxies: ISM — galaxies: clusters: individual: (Abell 1367)1 INTRODUCTION
For several decades it has been known that the fraction of spiral galaxies decreases when moving from a field population to a galaxy cluster core, with a corresponding increase in the fraction of early type (E+S0) galaxies; this is known as the morphology–density relation (Dressler, 1980; Oemler, 1974). Whether this relation originates during galaxy formation or is mainly the result of environment remains one of the fundamental questions in observational cosmology. While previous work (Boselli Gavazzi 2006a; Dressler et al., 1999; Poggianti et al., 1999; Dressler, 2004, and references therein) suggests that the environment associated with clusters only plays a secondary role in producing lenticular galaxies from spirals, there is ample evidence for the effect of cluster environment on galaxy evolution, such as the observed increase in the fraction of H i–deficient spiral galaxies toward cluster cores (e.g., Boselli Gavazzi 2006a; van Gorkom, 2004, and references therein), where the Hi deficiency is defined as the log of the difference between the expected and observed H i mass (see Table 3, table footnote ). There is strong evidence that infalling cluster galaxies encountering a hot X–ray emitting intracluster medium (ICM) for the first time experience rapid evolution as a result (Gavazzi et al. 2001b; Sun & Murray, 2002; Kenney et al., 2004; van Gorkom, 2004). In these cases the interaction removes the interstellar medium (ISM) from the galaxies (e.g., Gavazzi et al., 1995; Bravo-Alfaro et al., 2000; Solanes et al., 2001). For infalling spirals the gas motions resulting from the interaction are expected to lead to quenching of star formation. Although modest and short timescale (108 years) increases in star formation are predicted in specific circumstances (Fujita & Nagashima, 1999; Kronberger et al., 2008). However the predicted ram pressure induced star formation was not observed in a study by Iglesias-Páramo et al. (2004).
Different types of mechanisms are proposed to explain how the cluster environment impacts evolution of its constituent galaxies. The first type, which is most evident in spirals, consists of hydrodynamic mechanisms arising from gas–phase interactions between the cluster’s hot ICM and a galaxy’s ISM; these include ram pressure stripping (Gunn & Gott, 1972), viscous stripping (Nulsen, 1982), thermal evaporation (Cowie & Songaila, 1977) and starvation (Bekki et al., 2002; Fujita & Goto, 2004). The second type is caused by gravitational effects produced either by close encounters with neighbouring galaxies (merging or tidal stripping) or by repeated high speed galaxy–galaxy encounters (harassment; Moore et al., 1996; Moore et al., 1999). Also in this category belongs gravitational interaction between a galaxy and the cluster potential as a whole (Bekki, 1999; Natarajan et al., 2002).
H i in spirals provides an excellent tool to investigate these mechanisms as it is sensitive to both gravitational and hydrodynamic interactions (Dickey & Gavazzi, 1991). There is conflicting evidence for and against a correlation between the fraction of H i deficient galaxies and the cluster X–ray luminosity, (Boselli Gavazzi 2006a; Giovanelli & Haynes, 1985; Solanes et al., 2001). However modelling by Tonnesen (2007) favours ICM stripping over gravitational effects as the primary cause of Hi deficiency in nearby cluster spirals. Modelling of a generic spiral infalling to a cluster predicts the removal of almost all of its H i during the first transit of the cluster core as a result of hydrodynamic stripping. During the transit a combination of high ICM density and maximum orbital velocity hugely increases ram pressure stripping efficiency (Vollmer et al 2001a; Roediger & Brüggen, 2007). The few individually modelled spirals in Virgo, e.g., NGC 4522 (Kenney et al., 2004; Vollmer et al., 2008), NGC 4569 (Boselli et al.2006b; Vollmer et al., 2004) and in Coma, NGC4848 (Vollmer et al. 2001b), confirm that the ram pressure mechanism is operating. There are cases in Virgo, e.g., NGC4654 (Vollmer, 2003), NGC 4438 (Boselli et al., 2005), NGC 4254 (Chyży, 2008) and (Chung et al., 2007) as well as examples in other clusters (Sun & Vikhlinin, 2005; Moran et al., 2007) indicating that tidal mechanisms are operating in addition to hydrodynamic mechanisms.
The issue of galaxy evolution near clusters has become richer and more complex in recent years, since modelling suggests that under the hierarchical large–scale structure formation scenario, clusters are expected to grow predominantly by accretion of groups of galaxies rather than individual galaxies(Blummenthal et al. 1984; Springel et al. 2001, although for an alternative model see Berrier et al. 2009) . Infalling groups, having lower velocity dispersions than the clusters, provide opportunities for tidal interactions which may represent an important preprocessing stage in cluster galaxy evolution (Mihos, 2004; Fujita & Goto, 2004; Dressler, 2004). Wilman et al. (2009) report strong evidence that transformation of spirals to S0s in clusters occurs preferentially in such groups as a result of tidal interactions at z 0.4. Their results are based on analysis of HST-ACS images of 179 spectroscopically confirmed group and 111 field galaxies from the Canadian Network for Cosmology (CNOC2) sample. This raises the question of what processes have perpetuated the transformation of late–type galaxies to S0s since then (Fasano et al., 2000), given in the current epoch hydrodynamic mechanisms appear to be the predominant interaction type, but the most likely mechanisms for conversion of spirals to S0s are widely thought to be tidal (Dressler, 1980; Bicker et al., 2002; Wilman et al., 2009).
In this paper we consider A 1367 which together with A 1656 (the Coma cluster) comprises the Coma supercluster. A 1367 (=0.022) lies at the intersection of two filaments; the first extending 100 Mpc eastwards in the direction of the Virgo cluster and the second running NE toward Coma (West & Blakeslee, 2000). A 1367, with a mean velocity 6,240 km s-1 and 822 km s-1, is an unrelaxed Bautz–Morgan type II–III, spiral rich, 6.9 x M⊙ cluster (Boselli Gavazzi 2006a) . Based on a redshift to the cluster of 0.022 and , and = 72 km s-1 Mpc-1 the angular scale is 1 arcmin = 24.8 kpc.
A 1367 is, for several reasons, the perfect target to study environmental effects on spirals. It has a much higher fraction of spirals than its more massive neighbour Coma. X–ray observations of A 1367 carried out with ASCA, XMM–Newton (XMM) and Chandra indicate a dynamically young system with two principal sub–clusters (e.g., Donnelly et al., 1998). These two sub–clusters are themselves in the process of assembling from several smaller groups (Cortese et al., 2004). This suggests that A 1367 may be more like the unrelaxed clusters at earlier epochs than the more relaxed systems typical of low redshift (Oemler et al., 1997). Being a lower mass cluster of the kind in which Poggianti et al. (2009) report enhanced rates of morphological transformation from spirals to S0s it is potentially a location in which to test the mechanism leading to galaxy transformation suggested by Wilman et al. (2009). Furthermore, extensive optical and radio continuum studies have been carried out for A 1367. Gavazzi, in a series of papers (Gavazzi et al. 2001a; Gavazzi & Boselli, 1999; Gavazzi et al., 1995; Gavazzi & Jaffe, 1987) reported several galaxies with radio continuum and H tails and exceptionally high star formation rates NW of the cluster centre, interpreted as arising from the interaction of galaxies with the cluster ICM. Also the recently discovered Blue Infalling Group (BIG), projected near the centre of A 1367 with a high relative velocity (Sakai et al. 2002; Gavazzi et al. 2003a; Cortese et al. 2006) , may constitute a unique laboratory for testing preprocessing theories in cluster assembly.
This paper is the first stage of an investigation into the mechanisms transforming late–type galaxies in Abell 1367 which is focused on their H i content and position within the cluster. It is based on both Arecibo111 The Arecibo Observatory is part of the National Astronomy and Ionosphere Centre, which is operated by Cornell University under a cooperative agreement with the National Science Foundation single dish and NRAO222The National Radio Astronomy Observatory is a facility of the National Science Foundation operated under cooperative agreement by Associated Universities, Inc.-VLA synthesis H i imaging. Despite Arecibo’s modest spatial resolution of 3.5 arcmin, its homogeneous (in H i sensitivity) sky coverage, good sensitivity and high velocity resolution are well suited to study the global H i distribution throughout nearby clusters. But interferometers, like the VLA, provide an order of magnitude better spatial resolution, and for nearby clusters the VLA’s spatial resolution is sufficient to allow the effects of environment on the H i distribution in individual galaxies to be studied.
In this paper we present the results of a VLA low/medium resolution H i spectral line study of two adjacent fields in the central and NW parts of A 1367. The H i imaging from these two fields covers a small fraction of the virial volume of the cluster.
In section 2 we give details of the VLA H i observations including data reduction. Special attention is given to the method we developed to optimise the continuum subtraction, leading to improved signal-to-noise for low brightness H i features. We report our main observational results from the VLA H i imaging of individual galaxies in section 3 and, in section 4 the distribution of H i throughout the cluster volume from the AGES data. In section 5 we discuss the implications of our data for evolutionary mechanisms in the cluster, based on the H i content and colour distributions at both large and small scales as well as on the peculiar H i morphologies shown by several galaxies. Our concluding remarks are given in section 6.
2 OBSERVATIONS
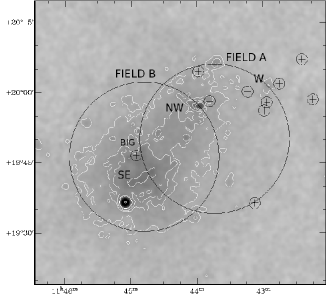
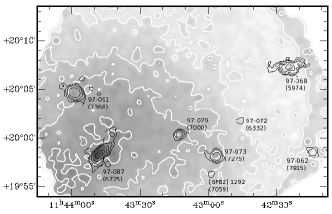
We used two sets of VLA H i observations both of which are well within the 104 arcmin (2.58 Mpc) virial radius of the cluster (Moss, 2006) and completely within the A 1367 AGES surveyed volume (Cortese et al., 2008). Figure 1 indicates the FWHM primary beams for both VLA pointings (large circles). The figure also shows the intensity of the X–ray emission (ROSAT) from the cluster’s ICM (white contours) and the positions of the VLA H i detections (small black circles enclosing crosses). Observational parameters for both fields are listed in Table 1, including the velocity resolution, central velocities, and the rms noise per field.
The sensitivity is non-uniform between the two VLA fields because of their differing array configurations and integration times. Additionally, for both fields, there is a sharp drop in sensitivity beyond the primary beam FWHM radius, significantly impacting the three detections in Field A furthest from the pointing centre.
| Field 333Field A = VLA Project ID: AB900; Field B = VLA project ID AH801 | Array | Integration | Beam | Velocity | Central | rms noise | mJy | ||
| config | time | size | resolution | velocity | conversion | ||||
| [h m s] | [∘ ′ ′′ ] | [hours] | [′′] | [ km s-1] | [ km s-1] | [mJy beam-1 ] | [K] | ||
| A | 11 43 45.6 | 19 50 21 | D | 15.0 | 44 x 45 | 21 | 6800 | 0.27 | 0.3 |
| B | 11 44 50.0 | 19 47 00 | C | 3.6 | 15 x 15 | 11 | 8200 | 0.65 | 2.7 |
2.1 VLA Field A - NW sub–cluster
Field A is centred near the NW sub-cluster (Cortese et al., 2004), 10 arcmin NW of the cluster centre (position from NED between the NE and SE sub–clusters). Field A’s position was chosen based on two considerations. First, the peculiar Zwicky infalling starburst galaxies CGCG 097-073, CGCG 097-079, and CGCG 097-087 were imaged within the 32 arcmin FWHM of Field A’s primary beam. Second, the first null of the beam was placed near 3C264 (a strong continuum source, with a flux density of 5 Jy at 1.4 GHz) to minimise the effects of its sidelobes.
This field was observed using the VLA in D configuration on the 26th and 30th of March 1999. Total observing time for the field was 15 hours. We used correlator mode 4 which gives two independent Intermediate Frequencies (IFs), each with dual polarization (right and left-hand circular). The IFs for the first day were set so that each IF generated a position–position–velocity subcube (velocity) with a velocity range of 500 km s-1, with a small overlap between the velocity ranges. Combining the subcubes from both IFs produced a cube for the field with a velocity range of 1000 km s-1. The field was re–observed on the second day using the same procedure but for a range of velocities adjacent to that observed on the first day. When combined, the subcubes from both days produced a single cube of 96 channels with a continuous velocity range from 5762 to 7810 km s-1 and a velocity width, using on–line Hanning smoothing, of 21 km s-1 per channel. The final cube’s velocity range is more than twice the velocity dispersion of A 1367 (822 km s-1).
The data were calibrated and imaged following standard procedures using the AIPS software package. For Field A, self–calibration with a single iteration was carried out to improve upon the standard complex gain calibration. This was necessary to mitigate the effects of sidelobes from 3C264. We applied different robust weighting functions in the Fourier transform (AIPS task imagr), looking for a compromise between sensitivity and resolution. Our final data cubes were produced with robust weighting (using robust = 0) and have a resolution of about 45 arcsec. The robust option corrects the weights of the visibilities in the Fourier transform for the fact that there is a much higher density of measured visibilities in the inner part of the uv–plane compared to the outer regions (Briggs, 1995). This comes at a cost of a slightly increased noise compared to using what is known as ’natural weights’. For this data set the H i mass detection threshold is 7107 M⊙ (corresponding to 3 over 2 consecutive 21 km sec-1 channels). The equivalent column density sensitivity for emission filling the beam is then 1.91019 cm-2.
It was found that continuum subtraction was a critical step in the data reduction. Ordinarily one would search for line–free channels in each subcube and then use, e.g. uvlin to subtract the continuum. The problem with our observations was that there was some H i emission at some position in almost every channel. This required a more elaborate approach consisting of deriving a continuum map made up of those areas on each channel map with no line emission and averaging them. This map was subsequently subtracted from the line + continuum data to produce cubes containing only line emission. In practice this required the following procedure. First, continuum sources with peak flux density 10 mJy were modelled and removed in the uv–plane. This resulted in subcubes containing line and residual continuum sources of 10 mJy. In the second stage AIPS tasks sqash and comb were used to create an average of all channels from the line plus residual continuum cube in the image plane, which was subtracted from the line plus residual continuum cube. This enabled us to find line–free channels in the subcubes, although in most cases there were very few (just 1 or 2). Continuum subtraction was then improved by repeating the subtraction but only using the average of these few line free channels to produce subcubes with H i line emission only. The rms noise in these cubes was quite high because the continuum subtracted was based on very few channels.
In the final stage these H i cubes were smoothed and blanked using AIPS tasks convl and blank, blanking out all areas in each channel containing line emission. These masks were in turn applied to the line + residual continuum subcubes to create, after again applying sqash, residual continuum–only maps for each of the subcubes. These residual continuum maps were then subtracted from the original line + residual continuum subcubes, resulting in subcubes with only H i emission, but with a much reduced rms noise. The continuum subtracted subcubes were subsequently combined with mcube. The final cube produced in this way had a noise of 0.27 mJy beam-1 which increased the number of H i detections by 50 percent compared to the equivalent cube produced using uvlin.
2.2 VLA Field B - BIG
The second set of VLA H i observations was centred on the Blue Infalling Group (Figure 1), overlapping slightly and located to the SE of Field A, with a central velocity of 8200 km s-1, i.e. the mean velocity of the BIG galaxies. Archival C–array observations (correlator mode 2 with on–line Hanning smoothing) from 8 December 2002 were used to produce an image cube with 48 channels (after discarding the noisy edge channels) with a velocity width of 11 km s-1 per channel. The velocity coverage was 7913–8587 km s-1. Our final data cube has a resolution of 15 arcsec. In the spatial overlap region between the two observed VLA fields, the velocity range extends from 5762 to 8587 km s-1 (except for a narrow gap at 7900 km s-1). For Field B, the equivalent H i mass detection threshold is 8 107 M⊙ (corresponding to 3 in 2 consecutive 11 km s-1 channels). This is equivalent to column density sensitivity for emission filling the beam of 2.1 1020 cm-2.
3 OBSERVATIONAL RESULTS
3.1 The H i in individual galaxies: VLA observations
Nine objects were detected in Field A (NW and W sub–clusters, Cortese et al., 2004) and two more within Field B (BIG). Channel maps for each detected object are available in Appendix C online material. Figure 2 shows the VLA H i detections in the NW area of the cluster, and their locations relative to X–ray emission (from XMM–Newton). The XMM-Newton archive data were derived from an observation taken on 2001 Nov 22. After standard flare filtering, the exposure time was 20.6 ks for the pn and 29.9 ks for the two MOS cameras. Images in the 0.5-5.0 keV energy band were derived by combining the exposure-corrected images from all three cameras and convolving with a Gaussian.
The morphological type, EW(H), VLA H i velocity including uncertainty, VHI including uncertainty, H i mass, and offset (of the H i compared to the optical position) for the VLA detections are given in Table 2.
The uncertainty in position for sources in the VLA fields is 4 arcsec (1.6 kpc) and 2 arcsec (0.8 kpc) for Field A and B respectively, i.e, uncertainties are 1/10th of the synthesized beam. Within a velocity integrated intensity map of an individual spiral, positional uncertainly varies depending on S/N. This means positional uncertainty within a map of a spiral is lowest in the region of velocity integrated intensity maximum. But we caution that the distribution beyond the H i intensity maximum region in spirals beyond the FWHM of the primary beam is more uncertain.
Four galaxies, CGCG 097-062, CGCG 097-068, CGCG 097-072 and CGCG 097-125, imaged with the VLA have their H i intensity maximum offset relative to their optical counterpart (final column of Table 2) in directions which are not radial with respect to the cluster centre, i.e. these cases are inconsistent with a simple ram pressure scenario. The direction of these offsets may arise from a tidal interaction or a more complex ram pressure scenario such as gas fall–back (see subsection 3.3 for CGCG 097-072 below).
| ID444Zwicky catalogue, except GP1277 = Abell 1367[GP82]1227 and GP1292 = Abell 1367[GP82]1292 | 555Optical galaxy position from NED | Type666Hubble classification from NED, * = our classification | EW(H)777 EW(H) is from GOLDMine, except GP1227 which is our measurement | VHI888Velocity = the mean of the upper and lower velocity defined by the line width (see note g) | (VHI) 999 Uncertaintiy for VHI = 1.5 (W20–W50)(S/N)-1 (Schneider et al., 1990), except where W20 = W50 in which case (VHI) = 1.5 (2 channel width )(S/N)-1. | W20 | V2σ101010The velocity width based on the number of contiguous channels with 2 detections. | (V2σ)111111Uncertainty in the line width = 2(VHI) | MHI121212MHI = 2.36 102 D2SHI where MHI is in M⊙, D in Mpc and SHI is the VLA flux in mJy km s-1. Mass based on a distance of 91.6 Mpc ( = 6595 km s-1 from NED and = 72 km s-1 Mpc-1.) | Offset 131313The offset direction is the projected position of the H i intensity maximum relative to its optical counterpart, except for CGCG 097-087 where the direction and distance are taken from the NIR counterpart. The projected distance between the two intensity maxima is given in arcsec with a positional uncertainty of 4 arcsec. | ||
| VLA | VLA | VLA | ||||||||||
| [ h m s ] | [∘′ ′′] | [Å] | [ km s-1] | [ km s-1] | [ km s-1] | [ km s-1] | [ km s-1] | [ M⊙] | ||||
| 97-068 | 11 42 24.5 | 20 07 10 | Sbc | 41 | 5958 | 5 | 346 | 346 | 10 | 6.9 | 15′′ | N |
| GP1227 | 11 43 13.0 | 19 36 47 | Dw* | 30 | 6239 | 11 | 86 | 86 | 22 | 0.9 | none | |
| 97-072 | 11 42 45.2 | 20 01 57 | Sa | 9 | 6207 | 4 | 64 | 64 | 9 | 0.4 | 12′′ | SE |
| 97-087 | 11 43 49.1 | 19 58 06 | Im | 77 | 6738 | 27 | 563 | 649 | 54 | 8.0 | 30′′ | NW |
| 97-079 | 11 43 13.4 | 20 00 17 | Irr | 129 | 7019 | 21 | 216 | 216 | 41 | 1.3 | 10′′ | NW |
| GP1292 | 11 42 58.9 | 19 56 12 | Dw* | - | 7203 | 23 | 64 | 64 | 46 | 0.3 | none | |
| 97-073 | 11 42 56.4 | 19 57 58 | SA:pec | 111 | 7301 | 11 | 173 | 216 | 22 | 2.0 | 8′′ | N |
| 97-091 | 11 43 59.0 | 20 04 37 | Sa | 23 | 7377 | 2 | 259 | 281 | 4 | 5.3 | none | |
| 97-062 | 11 42 14.8 | 19 58 35 | Sa:pec | 37 | 7723 | 13 | 64 | 64 | 26 | 0.7 | 15′′ | SW |
| 97-125 | 11 44 54.8 | 19 46 35 | S0a | 23 | 8158 | 18 | 206 | 206 | 35 | 1.3 | 12′′ | SW |
| K2 | 11 44 50.6 | 19 46 02 | H ii | - | 8158 | 12 | 162 | 162 | 24 | - | - | - |
Most of the galaxies have previously been detected in H i with Arecibo (Chincarini et al., 1983; Giovanelli & Haynes, 1985; Gavazzi, 1989; Springob et al., 2005) and/or with the VLA (Dickey & Gavazzi, 1991; Hota & Saikia, 2007). None of the authors showed H i maps of their detected galaxies because of insufficient resolution or sensitivity, except Hota & Saikia (2007) who presented H i maps of the three most active starburst galaxies.
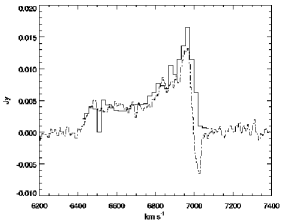
All objects in Table 2 were also detected in AGES (Table 3 and Cortese et al., 2008), with total fluxes and velocities generally in good agreement with ours. As an example we show, in Figure 3, a comparison of the AGES and VLA Field A spectra for a detection well within the VLA FWHM beam. Important exceptions to this agreement include CGCG 097-073 and A 1367 [GP82]1292, which are confused in the AGES beam but are resolved by the VLA.
While the determination of velocity for each channels is accurate to within a few km s-1 the range of velocities detected for each galaxy depends on sensitivity. The VLA detections of CGCG 097-068, CGCG 097-072 and CGCG 097-062 are beyond the Field A primary beam, where not only is the sensitivity lower than in AGES, but the fluxes are more uncertain due to the limited knowledge of the VLA primary beam beyond the half–power radius. For example the noise at the position of CGCG 097-068 is 5 times greater than at the centre of the primary beam.
In the following subsections we describe the most notable features of the VLA detections. The images displayed here were produced after applying a primary beam correction. The and axes of all maps are in J2000 coordinates.
3.2 The star-forming galaxies (CGCG 097-087, CGCG 097-073 and CGCG 097-079)
These three starburst galaxies have been extensively studied in the past (Gavazzi et al. 2001a,b; Nulsen, 1982; Gavazzi et al., 1984; Gavazzi & Jaffe, 1987; Gavazzi, 1989; Gavazzi et al., 1995; Dickey & Gavazzi, 1991; Boselli et al., 1994; Hota & Saikia, 2007). They all have exceptionally high star formation rates, EW(H + [NII]) 75Å (Table 2) and display spectacular radio continuum and H tails pointing away from the cluster centre (Gavazzi et al. 2001b; Gavazzi & Jaffe, 1987) . Some observational features of these three objects have been interpreted as effects of ram pressure stripping produced by the ICM, in particular the enhanced star formation activity and the displacement of atomic hydrogen relative to their stellar disks, although in the case of CGCG 097-087 much of the enhanced star formation rate is probably attributable to a merger (Gavazzi et al. 2001a; Martig & Bournaud, 2008) The H i in the central parts of these starbursts has been recently mapped by Hota & Saikia (2007). The maps presented here, though, show additional large scale H i features as a result of our improved continuum subtraction (see Sect. 2.1).
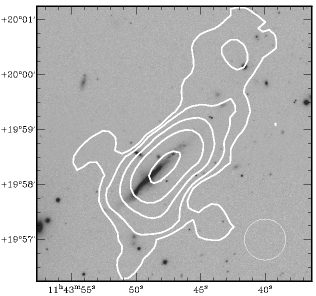
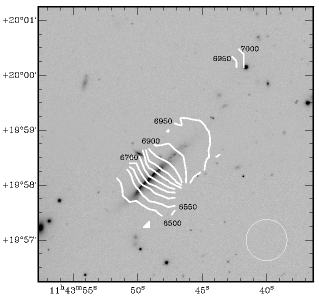
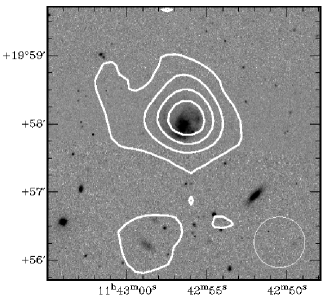
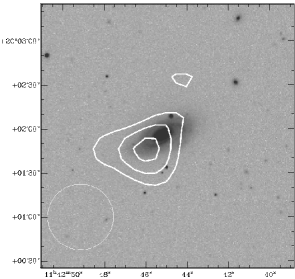
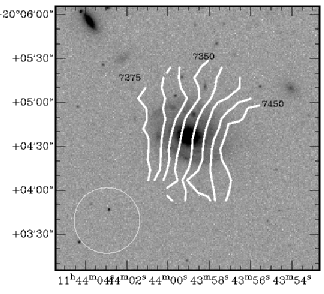
CGCG 097-087: The integrated H i map (Figure 5) shows the H i intensity maximum is offset by 30 arcsec (12 kpc) to the NW of the nucleus, confirming the H i is asymmetrically distributed, as earlier reported by Gavazzi (1989) and Dickey & Gavazzi (1991). Higher spatial resultion and lower sensitivity H i maps have previously been presented for the inner parts of this galaxy by Hota & Saikia (2007). The main body of the galaxy displays rotation in the velocity range 6500–6900 km s-1 (Fig. 5). We do not see the jump in velocities observed in H and CO (Gavazzi et al. 2001a; Boselli et al., 1994), but this may be due to our low spatial resolution. We are not able to confirm the merger hypothesis suggested by the H kinematics (Gavazzi et al. 2001a et al. ; Amram et al., 2002), but the H i velocity field has a much steeper velocity gradient SE of the nucleus, coinciding with the disturbed optical disk. We also see that the H i disk is sharply truncated, with its SE edge approximately coinciding with the edge of the optical disk. An impressive H i tail, coinciding with the radio continuum tail (Gavazzi et al., 1995), extends at least 70 kpc to the NW of the nucleus, with an increasing offset from the plane of the optical galaxy. At the end of this tail the H i map shows a clump without an optical counterpart. The clump has a velocity width of 100 km s-1.
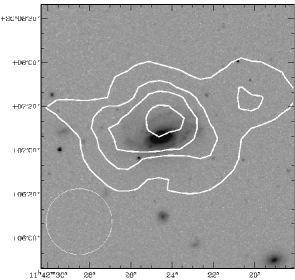
CGCG 097-073 and A 1367 [GP82]1292: Figure 6 shows the H i in CGCG 097-073 having a slightly asymmetric distribution, the intensity maximum being displaced 8 arcsec (3 kpc) to the north of the optical disk, confirming the earlier report of H i asymmetry (Dickey & Gavazzi, 1991). The H i displacement is in the same direction as the H and radio continuum tails (Gavazzi et al. 1995, 2001b). H i does not appear truncated, which is consistent with the normal H i content (Hi deficiency = 0.02). Also shown in the same figure is an H i detection at the position of the blue dwarf galaxy Abell [GP82]1292 which appears undisturbed. Given the projected distance of 1.9 arcmin (47 kpc) and the 11 km s-1 velocity separation between the two (perturbation141414 where and are the masses of the galaxy and companion respectively, d is the separation and r is the galaxy disk radius (Byrd & Valtonen, 1990). parameter pgg 0.004), a gravitational interaction cannot be ruled out.
CGCG 097-079: H i has been previously detected in this galaxy (Gavazzi, 1989; Dickey & Gavazzi, 1991). Figure 7 shows the H i to be symmetrically distributed but with the intensity maximum displaced by 10 arcsec (4 kpc) to the NW of the optical disk, as previously reported by Gavazzi (1989) and Hota & Saikia (2007). The H i offset is in the same direction as the H and radio continuum tails (Gavazzi et al. 1995, 2001b) .
3.3 Giant late–type galaxies (CGCG 097-062, CGCG 097-068, CGCG 097-072 and CGCG 097-091)
In addition to the three starbursts we were able to map four more spirals in the NW and W sub–clusters (Figure 2).
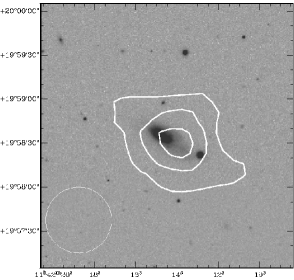
CGCG 097-062: This optically asymmetric Sbc (NED) or Pec Galaxy OnLine Database Milano Network (GOLDMine151515http://goldmine.mib.infn.it/), galaxy is well beyond Field A’s FWHP beam, but our weak H i detection is consistent with the Hi deficiency (AGES) of 0.35. Figure 8 shows the H i intensity maximum displaced 15 arcsec (6 kpc) to the SW of its optical counterpart, in the direction of the optical tail. CGCG 097-062, like CGCG 097-087 has a pronounced asymmetric H i spectrum (Gavazzi, 1989).
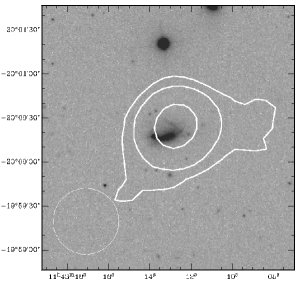
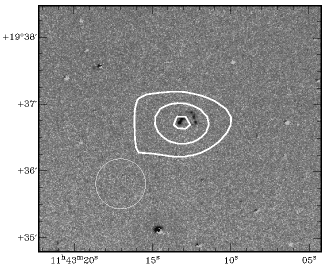
CGCG 097-068: Despite its position well beyond the FWHP region of the VLA’s primary beam, CGCG 097-068’s H i signal was sufficient to show a double–peaked VLA spectrum which approximately matches its AGES counterpart, strongly suggesting that this massive Sbc galaxy is inclined and H i rich (Hi deficiency of -0.28, Table 3). This galaxy was tentatively reported as having its H i intensity maximum displaced north of the optical disk (Dickey & Gavazzi, 1991). The position of the VLA H i intensity maximum 15 arcsec (6 kpc) in projection north of the optical nucleus confirms this (Figure 9).
CGCG 097-072: This Sa galaxy lies, in projection, close to the W sub–cluster galaxy density maximum (Cortese et al., 2004). Our H i detection is weak, consistent with its high Hi deficiency of 0.55 (AGES). Figure 10 shows an H i intensity maximum offset 12 arcsec (5 kpc) to the SE of the optical nucleus, and suggests a truncated H i disk. However, this requires further confirmation as the galaxy is beyond the FWHP beam of Field A. The high Hi deficiency and anomalous direction of its H i displacement relative to that seen in nearby spirals is similar to NGC 4848 in Coma where a truncated H i disk was reported by Bravo-Alfaro et al. (2001) and further CO-imaging and numerical simulations by Vollmer et al. (2001b) revealed a case of gas fallback.
CGCG 097-091: H i has been previously detected in this galaxy with Arecibo and the VLA (Dickey & Gavazzi, 1991), but was not spatially resolved. The AGES Hi deficiency of -0.23 shows the galaxy to be H i rich. CGCG 097-091 has the most symmetric H i morphology of our VLA detections, with a near perfect coincidence of position and velocity between the optical nucleus and the H i intensity maximum, (Tables 3 and 2). These characteristics together with the velocity field (Figure 11), which shows normal rotation, combine to suggest CGCG 097-91 is a normal spiral which is not interacting with its environment in any significant way.
3.4 The H i around the Blue In-falling Group (BIG)
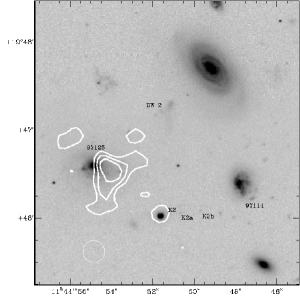
Our VLA H i observation of the BIG (Field B) has a higher spatial resolution (15 arcsec ), compared to Field A (45 arcsec), but at significantly lower sensitivity because of the shorter integration time. The strongest detection in Field B is near the disturbed S0a galaxy CGCG 097-125 and we confirm that the H i intensity maximum is offset 12 arcsec (5 kpc) westward from the optical centre (Figure 12). The high column density H i to which Field B is sensitive is asymmetrically distributed with its major axis running approximately SE - NW. Comparing our H i images to the earlier more sensitivity observations by Sakai et al. (2002) with the Westerbork Synthesis Radio Telescope (WSRT) indicates that BIG contains extensive diffuse H i, which our observation was not sensitive enough to detect. Comparison between our H i spectrum and AGES confirms the presence of this diffuse H i in the velocity range from 8000 to 8500 km s-1. Further details of our observation of BIG can be found in Appendix A.
3.5 Dwarf galaxy A 1367 [GP82]1227
This isolated irregular dwarf galaxy is detected in H i, both by the VLA and in AGES, to the SW of the cluster centre in a region otherwise devoid of H i detections (Figure 13). The VLA and AGES H i spectra are in good agreement and display a single narrow peak (W50 = 56 8 km s-1; Cortese et al. 2008), typical of a dwarf irregular galaxy. The VLA observations show the H i intensity maximum is offset 3 arcsec (1 kpc) to the south of its optical counterpart. Details of a low–resolution optical spectrum obtained for this galaxy can be found in Appendix B.
ROSAT X–ray intensities (black contours) are overlaid on an SDSS i–band image. Details for the galaxy identifiers are given in note (a) of Table 3.
| ID 161616Zwicky catalogue, except [BO85]074 from Butcher & Oemler (1985), with the suffixes indicating the NED pair identifier. | 171717Optical galaxy positions ex SDSS DR6 | Optical181818from NED | i–band191919ex SDSS DR6 | 202020ex SDSS DR6 | Major212121ex GOLDMine except CGCG 097-111 and [BO85]074 which are taken from NED | Type222222ex GOLDMine except [BO85]074 which is taken from NED | H i def 232323Hi deficiency is calculated using the method of Haynes & Giovanelli (1984) and the parameters from Solanes et al. (1996), using total H i flux measurements from AGES and galaxy diameters equal to the major axis diameter from GOLDMine (except [BO85]074 which is taken from NED). For 97-079 the mass was calculated from our VLA total flux because the AGES flux was affected by RFI. For AGES non-detections, the Hi deficiency lower limit was calculated using the AGES detection limit of 6 x 10⁸ M⊙. No Hi deficiency could be calculated for CGCG 097-119 because flux from this galaxy was confused in the AGES beam with 3C264. The calculated H i deficiencies are highly uncertain because of the intrinsic spread in H i properties of individual spirals and we adopt an uncertainty of 0.3 dex throughout this paper. | Companion242424A galaxy is considered to be a likely companion if its separation is 2 arcmin, the velocity difference is 500 km s-1 and the companion has a diameter 0.5 arcmin. | State252525Evolutionary state described in section 5.3 | ||
| velocity | [mag] | [mag] | axis | separation | |||||||
| [h m s] | [∘ ′ ′′ ] | [ km s-1] | [′] | [ km s-1] | [′′ ] | ||||||
| 97-064 | 11 42 14.61 | 20 05 52.18 | 5976 | 14.18 | 1.06 | 0.65 | S (dS) | 0.48 | - | - | B |
| 97-062 | 11 42 14.78 | 19 58 35.5 | 7815 | 14.78 | 0.62 | 1.01 | Pec | 0.35 | - | - | A |
| 97-063 | 11 42 15.62 | 20 02 55.24 | 6102 | 15.27 | 0.63 | 0.58 | Pec | 0.01 | - | - | A |
| 97-068 | 11 42 24.49 | 20 07 09.55 | 5974 | 13.24 | 0.99 | 1.23 | Sbc | -0.28 | - | - | B |
| 97-072 | 11 42 45.16 | 20 01 56.35 | 6332 | 13.61 | 1.07 | 1.21 | Sa | 0.55 | - | - | B |
| 97-073 | 11 42 56.45 | 19 57 58.39 | 7275 | 15.08 | 0.55 | 0.76 | Pec | 0.02 | - | - | A |
| 97-076 | 11 43 02.14 | 19 38 59.02 | 6987 | 13.56 | 1.17 | 1.20 | Sb | 0.88 | - | - | D |
| 97-079 | 11 43 13.08 | 20 00 17.46 | 7000 | 14.37 | 0.47 | 0.75 | Pec | 0.25 | - | - | A |
| 97-078 | 11 43 16.22 | 19 44 55.46 | 7542 | 13.55 | 1.21 | 1.88 | Sa | 0.96 | - | - | D |
| 97-082 | 11 43 24.55 | 19 44 59.35 | 6100 | 13.00 | 1.20 | 1.30 | Sa | 0.77 | - | - | D |
| 97-087 | 11 43 49.07 | 19 58 06.49 | 6725 | 13.19 | 0.64 | 2.00 | Pec | 0.39 | - | - | A |
| 97-092-NED1 | 11 43 58.2 | 20 11 08 | 6487 | 14.95 | 0.99 | 0.76 | Sbc | 0.62 | - | - | B |
| 97-091 | 11 43 58.96 | 20 04 37.34 | 7368 | 13.26 | 0.99 | 1.12 | Sa | -0.23 | - | - | B |
| 97-093 | 11 44 01.95 | 19 47 03.94 | 4909 | 15.05 | 0.42 | 0.96 | Pec | 0.78 | - | - | D |
| 97-102-NED2 | 11 44 16.49 | 20 13 00.73 | 6364 | 13.67 | 1.24 | 1.08 | Sa | 0.41 | 4 | 24 | C |
| 97-111 NED1 | 11 44 25.93 | 20 06 09.64 | 7436 | 14.92 | 1.14 | 0.45 | Irr | 0.21 | 194 | 24 | C |
| 97-121 | 11 44 47.04 | 20 07 30.32 | 6571 | 12.86 | 1.18 | 1.20 | Sab | 0.38 | - | - | C |
| 97-114 | 11 44 47.8 | 19 46 24.31 | 8293 | 15.12 | 0.57 | 0.54 | Pec | 0.34 | 22 | 102 | - |
| 97-119 | 11 44 47.95 | 19 41 18.56 | 4895 | 14.18 | 0.98 | 0.60 | Sa | 0.37 | - | - | - |
| 97-120 | 11 44 49.16 | 19 47 42.14 | 5595 | 12.53 | 1.12 | 1.32 | Sa | 0.78 | - | - | D |
| 97-122 | 11 44 52.23 | 19 27 15.12 | 5468 | 13.65 | 0.93 | 1.45 | Pec | 0.47 | - | - | B |
| 97-125 | 11 44 54.85 | 19 46 35.18 | 8271 | 13.81 | 1.20 | 0.84 | S0a | -0.14 | 22 | 102 | - |
| 97-129-NED1 | 11 45 03.88 | 19 58 25.24 | 5085 | 12.29 | 1.21 | 2.36 | Sb | -0.07 | - | - | C |
| 97-138 | 11 45 44.6 | 20 01 50.8 | 5313 | 13.99 | 0.42 | 0.75 | Pec | -0.12 | - | - | A |
| BO85 074 | 11 45 06.57 | 20 09 23.21 | 6151 | 14.69 | 1.03 | 0.38 | S | 0.08 | - | - | B |
| 97-129 NED2 | 11 45 06.95 | 19 58 0.66 | 7546 | 14.66 | 1.12 | 1.07 | Sbc | 0.8 | - | - | D |
4 H i (AGES) and colour distribution in A 1367
To place our VLA observations in context we used the AGES H i survey together with SDSS data to analyse the H i content and colour of bright late–type galaxies throughout the central volume of the cluster (including the VLA fields).
As part of the AGES project the 305-m Arecibo Telescope was used to survey H i in a volume centred on A 1367 covering about 5 square degrees, between
11h34m00s 11h54m15s, 19d15m 20d20m, in a velocity range 1100–19000 km s-1 (Cortese
et al., 2008). The survey has an angular resolution of 3.3 3.8
arcmin and a velocity resolution of 10 km s-1 with a mass sensitivity limit of M⊙ of H i over a velocity W50 = 200 km s-1. Positional uncertainties for the detections are estimated to be 18 arcsec (7 kpc). The observations were made in drift scan mode providing a
consistent flux limited H i detection threshold throughout the AGES volume. The observations and data reduction
process is described in Auld
et al. (2006). More details on this survey are given
in Cortese
et al. (2008).
In the field, significant amounts of H i are expected to be present in the disks of both spiral and dwarf galaxies. In the case of spirals the amount of H i can be approximately related to the optical disk diameter and the galaxy’s morphological type (Haynes & Giovanelli, 1984; Solanes et al., 1996), but for dwarfs the H i mass fraction is both larger and more uncertain. The AGES detection limit implies that spiral galaxies in A 1367 with an optical disk diameter 0.37 arcmin (9 kpc) would not be detected in AGES (Solanes et al., 1996; Cortese et al., 2008). Galaxies with disk diameters below this limit are almost certainly dwarfs, so that AGES is essentially only sensitive to H i in late–type spiral galaxies of A 1367. However two dwarf galaxies were detected within our sampled volume, showing that AGES includes galaxies from the high end of the dwarf H i mass function.
AGES allows us to investigate the H i deficiency of A 1367’s spirals, down to its sensitivity limit, by comparing their expected H i content with actual AGES determined H i content. To do this a catalogue of A 1367’s brightest spiral members was compiled, with the following criteria. We intially selected late–type galaxies with an SDSS –band magnitude 15.5 within the sampled volume, i.e., 1 square degree surrounding the NW sub–cluster core in the velocity range 4000–9000 km s-1, (approximately six times the velocity dispersion of the cluster). Only those objects with an optical disk diameter 0.37 arcsec from GOLDMine (Gavazzi et al. 2003b) or, if unavailable, from the NASA Extragalactic Database (NED), were selected. For the selected late–type galaxies we determined their Hi deficiency by comparing expected and observed H i content using the method of Haynes & Giovanelli (1984). Hubble type was taken from GOLDMine or, if unavailable, from NED. We selected all galaxies with Hubble type later than S0. The only exception, CGCG 097-125, an S0a, was included because of its unusually large H i mass.
Applying these criteria we found the 26 bright late–type galaxies listed in Table 3 which gives details of their SDSS g band magnitude and – colour, optical diameter from GOLDMine/NED, H i–mass based on AGES flux, Hi deficiency (or lower limit for AGES non–detections) based on AGES flux calculated using the method from Haynes & Giovanelli (1984) and parameters from Solanes et al. (1996), and separation parameters for galaxies with a close companion. A – colour of 1.1 approximately coincides with the red sequence threshold displayed in the colour-magnitude plot in Figure 12 of Cortese et al. (2008). For our sample, those galaxies with – colour are referred to throughout the paper as blue galaxies and the rest referred to as red galaxies.
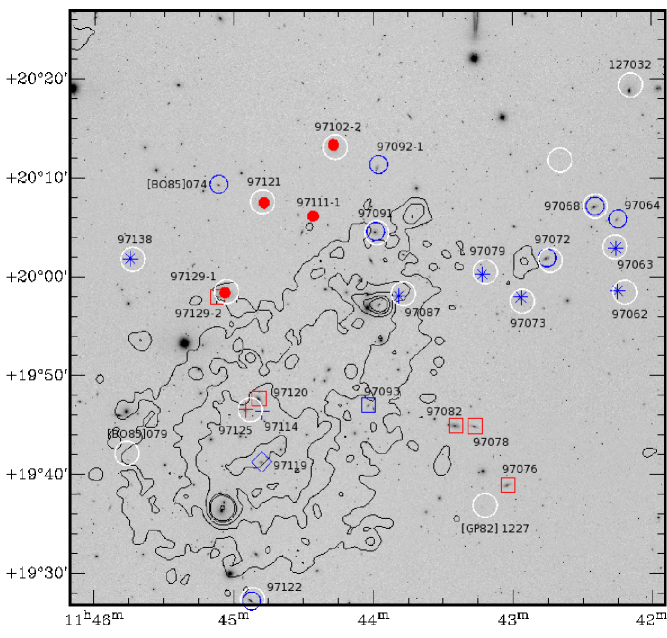
Figure 14 shows the optical positions of the 26 spirals (red and blue symbols) and the positions of the 18 AGES H i detections (white circles). In the figure the positions of the 16 selected galaxies with blue SDSS g–i colours are indicated with blue symbols and the 10 with red SDSS g–i colours with red symbols. Figure 14 also indicates the distribution of ICM gas in the cluster based on ROSAT X–ray observations (black contours).
A shift in position in Fig. 14 between an AGES H i detection (white circle) relative to its respective optical position (red and blue symbols) is an indication of a real displacement when the offset exceeds 18 arcsec (7 kpc), the uncertainty in the AGES positions. This is only the case for CGCG 097-087 and CGCG 127–032. However the much higher pointing accuracy of the VLA, 4 arcsec (1.6 kpc), reveals that CGCG 097-062, CGCG 097-068, CGCG 097-072, CGCG 097-073, CGCG 097-079, CGCG 097-087 and CGCG 097-125 all have H i intensity maxima offsets relative to their optical counterparts larger than 3 . In all cases the offset direction is consistent with that from the higher uncertainty AGES data. The projected magnitude and direction of the VLA offsets given in Table 2 is consistent with that expected for spirals on radial orbits experiencing ram pressure stripping, except CGCG 097-062, CGCG 097-068, CGCG 097-072 where the offset direction is not radially with respect to the cluster centre.
The four AGES detections in Figure 14 without a selected late–type galaxy counterpart are the S0 galaxy CGCG 127-032, the two dwarfs, [GP82] 1227 and [BO85] 079, and an AGES detection to the NE of CGCG 097-068. CGCG 097-119 was not detected in the AGES survey because of its proximity to 3C264 and is therefore not included in our analysis.
5 Discussion
The projected distribution, colour, H i content and velocities of the selected spirals
throughout the sampled volume on large and small scales provides information
on the recent history of the cluster as well as clues to the
mechanisms impacting the galaxies’ ISM. In the following subsections we
consider the global H i properties, the role of ram pressure stripping attributable to the NW subcluster ICM and the evolutionary state of the spirals.
5.1 Global H i properties
Considered on a scale of several megaparsecs the pattern of H i deficiencies projected in RA for Coma and A 1367 in Figure 2 of Gavazzi (1989) show striking differences. From their figure it is clear that with few exceptions the Coma spirals across the central 5∘ of cluster are significantly H i deficient ( 0.3). In contrast for A 1367 the significantly H i deficient spirals are found in a more narrow range of projected RA (1∘) and even at its centre a majority of the spirals are not deficient (H i deficiencies 0.3)
Within our sampled volume for A 1367 ( central 1.5 Mpc) the bright spirals, irrespective of H i content, are found preferentially projected onto the northern half (Figure 14), with the AGES detections (white circles in Figure 14) highly concentrated in a band running
roughly E–W between declinations of 19∘55′ to
20∘15′.
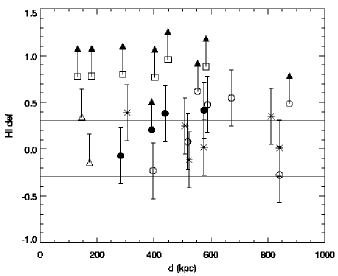
As an initial step to understand the global H i properties in the sampled volume we plotted, in Figure 15, the Hi deficiency of all the selected late–type galaxies as a function of projected distance from the cluster centre, with lower limits for H i non–detections, and BIG members confused in the AGES beam. The plot shows that the mean Hi deficiency of the selected galaxies is appreciably greater than in the field indicating that the cluster environment has impacted the ISM of a significant fraction of them. However, unlike Coma where a clear increase in Hi deficiency is seen within a radius of 1 Mpc of the core (Bravo-Alfaro et al., 2000), there is no obvious correlation between Hi deficiency and projected proximity to the cluster core. It should be noted, though, that the two interacting major sub–clusters revealed by the X–ray observations (see Fig. 1) complicate the investigation of any correlation between the cluster’s ICM density and Hi deficiency and in section 5.2 we try to address the effects which are specific to the NW sub–cluster.
5.2 Ram pressure stripping by the NW subcluster ICM
We are interested to know if the observed H i deficiencies can be explained in terms of ram pressure stripping. In order to quantify the role of this mechanism around the NW sub–cluster, we carried out a simple estimate of the strength of ram pressure as a function of radius from the NW sub–cluster ICM core. The ICM density () distribution was estimated using the hydrostatic-isothermal -model of Cavaliere & Fusco-Femiano (1976) with the gas profile parameters from Donnelly et al. (1998). Ram pressure values were derived from Gunn & Gott’s (1972) equation: , where is the density of the ICM at the galaxy position and is the galaxy’s velocity relative to the ICM. We have no information about for the selected galaxies, although we consider a galaxy’s radial velocity, relative to the cluster systemic velocity, as a lower limit for .
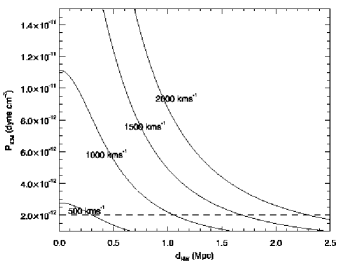
The results of this modelling of as a function of proximity to the NW core for four different values of , up to 2000 km s-1 (approximately the radial velocity difference of the BIG), are shown in Figure 16. A spiral near the NW sub–cluster is expected to suffer ram pressure stripping if values exceed the restoring force of the galaxy’s stellar and gas disks, at the gas disk’s periphery, defined as The threshold ram pressure required to remove H i from the outer edge of the disk can be estimated from the typical value for the restoring force per unit area of dyn cm-2, obtained by Cayatte et al. (1994) for spiral galaxies in Virgo (dashed line in Figure 16). The crossing time for the cluster is 1.7 Gyr (Boselli Gavazzii 2006a) making it likely that spirals within the central Mpc have been subject to ram pressure over periods of several times yrs. Modelling by Roediger & Brüggen (2007) indicates that for a mid–size spiral ( = 200 km s-1) sustained exposure to ram pressures over periods of the order of yrs of dyn cm-2 will result in only minor stripping of H i, pressures of dyn cm-2 will cause significant stripping, while dyn cm-2 will almost completely remove the H i. Massive galaxies are expected to suffer proportionately less H i removal, and less massive galaxies proportionately more.
The implication of Figure 16 and the Roediger & Brüggen (2007) models is that any galaxy with 1000 km s-1 anywhere within a radius of 1 Mpc of the NW sub–cluster will undergo weak to moderate ram pressure stripping. But removal of large fractions of H i, i.e. dyn cm-2, would require a transit of the high density ICM within 0.75 Mpc of the cluster centre at a velocity in excess of 1500 km s-1 or transit within 0.25 Mpc of the core at 1000 km s-1.
Galaxies with only upper error bars (arrowheads) are AGES non-detections so the value is the lower limit for Hi deficiency. The region between the horizontal lines approximates the range expected in the field population.
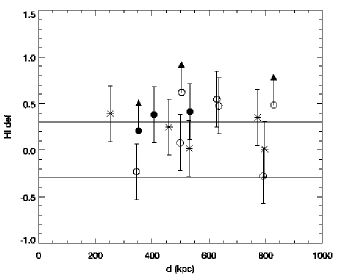
To test the model predictions we selected the 14 spirals from our sample which were potentially suffering ram pressure stripping solely attributable to the ICM of the NW sub–cluster. Virtually all of these galaxies have radial velocities relative to the cluster of 500 km s-1 and it seems reasonable to assume that most, if not all, are suffering ram pressure stripping of varying strengths given they are at projected radii of 0.8 Mpc. Figure 17 shows a plot of Hi deficiency against distance for these galaxies and, interestingly, only a modest increase in Hi deficiency is seen when compared with the field. Furthermore, no correlation is seen with proximity to the NW sub–cluster ICM core. This observational result suggests that ram pressure stripping associated with the NW sub–cluster ICM core is relatively weak. The presence of undisrurbed H i in CGCG 097-073’s dwarf companion projected close to the NW-ICM core provides additional support to this statement.
Although the limited evidence for ram pressure stripping is broadly consistent with the expected ram pressure at the projected distances to the the NW sub–cluster core (Figure 16), the lack of correlation with radial distance from the core may imply that galaxies seen in projection to be located close to the core are in reality spread over a considerable distance. In the case of CGCG 097-068, a tidal interaction cannot be ruled out as an explanation of the observed H i characteristics.
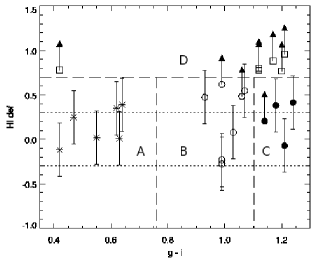
| Plot | H i | g-i colour | ||||
|---|---|---|---|---|---|---|
| State | H i | Colour | symbol | number | def | |
| deficiency | SDSS g–i | galaxies | median | median | ||
| A | 0.7 | 0.76 | 6 | 0.14 | 0.59 | |
| B | 0.7 | 0.76 and 1.1 | 7 | 0.47 | 0.99 | |
| C | 0.7 | 1.1 | • | 4 | 0.30 | 1.20 |
| D | 0.7 | any | 6 | 0.79 | 1.15 |
5.3 Evolutionary states of the spirals
The colour and H i deficiency of a spiral are both properties indicative of its evolutionary state. In Figure 18 we distinguish four broad evolutionary states (A–D). We classify the highly H i deficient galaxies (Hi deficiency lower limit of 0.7 ) as state D spirals. The spirals with moderate or no Hi deficiency (i.e., Hi deficiency 0.7) are classified into three states (A, B and C) based on their SDSS g-i colour. C state spirals are red as defined in section 4 (i.e., 1.1). The remaining blue spirals with moderate or no Hi deficiency were classified as state A if their SDSS g-i colour was 0.76 (the colour of the bluest type of late–type field spirals from Durbala et al. (2008), their Table 3) and state B for those with 0.76 g-i 1.1. Table 4 summarises the parameters used to determine the evolutionary state of each spiral and the symbols used for them throughout the paper. The evolutionary state determined for each spiral is shown for convenience in the final column of Table 3. CGCG 097-125 and CGCG 097-114 have been excluded from the analysis because their evolution is likely to have been dominated by membership of the BIG compact group rather than the cluster.
While the choice of boundaries of our states could be debated, it is clear that the cluster contains spirals at significantly different stages of evolution, with the spirals in each state appearing to have reached a broadly similar evolutionary stage, probably as a result of sharing or passing through a common environment.
The discussion below is focused on the more evolved State C and D spirals where the impacts of the cluster environment are more pronounced. In contrast spirals with less evolved states A and B are probably at earlier stages of their interactions and consequently show milder impacts, although a key question remains to be addressed, i.e. the mechanism(s) triggering the starbusts (state A).
The H i deficiencies of AGES detected state C spirals are modest compared to lower limits for the state D spirals, suggesting that they have not passed through the cluster’s highest density ICM. The state C spirals include 2 of the 3 potentially interacting pairs, where the companion is projected within 2 arcmin (50 kpc), has a velocity within 500 km s-1 and both galaxies are 0.5 arcmin (12 kpc) in diameter (Table 3). The perturbation parameters, , for the state C pairs are 8.7 (CGCG 097-102), and 1.8 (CGCG 097-111) significantly above the value where the ISM is expected to be impacted. The interaction time scales for the pairs is of the order of 108 years, in agreement with the value from Boselli Gavazzi 2006a. It is important to note that H i emission from close pairs could potentially be confused within Arecibo’s 3.5 arcmin beam underestimating the Hi deficiency (AGES) for each member of the pair. But in both cases the spiral’s companion is an early type making it unlikely the companion’s H i makes a significant contribution. Moreover three state C spirals (CGCG 097-102, CGCG 097-111 and CGCG 097-121) have optically disturbed morphologies in SDSS i–band images consistent with gravitational interactions. Signs of optical disturbance are also observed in three adjacent state A spirals, CGCG 097-092-1, CGCG 097-138 and [BO85]074 showing that tidal interactions, if important, could be affecting spirals in more than one evolutionary state. The high rate of disturbance in the optical morphology in this region suggests the spirals are subject to strong interactions possibly related to their location at the intersection of the NW sub–cluster and the filament oriented toward the Coma cluster.
The state D spirals all have a red colour, except CGCG 097-093 which is exceptionally blue (–) and has a disturbed stellar disk. The observed red colours and high Hi deficiency are both expected results of a spiral making a transit through a high density ICM core. An example of this is found in Virgo, i.e. the galaxy NGC4568 (Boselli Gavazzi 2006a). The calculations for the NW sub–cluster (section 5.2) suggests that a core transit would be required to cause the H i deficiencies observed in the state D spirals under the ram pressure stripping scenario, although the ICM core transited may have been the SE subcluster. The tendency for the state D spirals further from the cluster centre to be redder and have higher velocities may be indicating that these spirals are a population of backsplash galaxies (Ellingson, 2004), which were ram pressure stripped as they passed through the SE sub–cluster ICM core with a significant velocity component directed to the west.
6 concluding remarks
We have presented medium–resolution VLA data for a field located to the NW of A 1367’s centre, and some higher–resolution, but less sensitive, VLA data for a field containing BIG. By using a catalogue of the brightest late-type members of the cluster, combining AGES and SDSS data, we have identified four evolutionary states with shared characteristics in terms of their combination of H i content and colour.
The overall picture from the HI deficiencies as a function of radial distance and calculations of ram pressure for the NW cluster (section 5.2) are both consistent with moderate levels of ram pressure stripping. However the presence of spirals with a range of evolutionary states in projected and velocity space, particularly the spirals with more advanced evolutionary states (state C and D spirals), suggests an evolutionary process or processes operating on relatively local scales.
Consideration of the membership of the evolutionary states and individual spirals presents mixed, and some times contradictory, indicators of varying reliability for the dominant ISM removal process(es). The lack of correlation between Hi deficiency and proximity to the NW sub–cluster core for the spirals likely to be affected by it, the presence of starbusts, the presence of galaxies with H i offset directions inconsistent with ram pressure, together with the elevated number of morphologically disturbed red and moderately H i deficient spirals (state C) possibly linked to interactions during infall, all suggest tidal effects. On the other hand the presence of the highly H i deficient (state D) spirals and the possible case of gas falling back into the galaxy’s potential following an ISM core transit (CGCG 097-072) support the ram pressure stripping model.
While the analysis above hints that different ISM removal mechanisms may be active in this cluster further observations are required to discriminate between the hydrodynamic and tidal mechanisms. If anything, this paper shows that the picture in Abell 1367 is somewhat confusing, probably the result of it being less evolved than Coma and Virgo.
Acknowledgments
We thank the referee for comments to an earlier version of the manuscript which have led to a much improved presentation.
HBA thanks CONACyT for grant No. 50794, the Royal Astronomical Society and the Academia Mexicana de Ciencias for financial support to carry out this work. CAC acknowledges the University of Guanjuato (DINPO) for grant 0131/07. MJH thanks the Royal Society for a Research Fellowship.
This research has made use of the NASA/IPAC Extragalactic Database (NED) which is operated by the Jet Propulsion Laboratory, California Institute of Technology, under contract with the National Aeronautics and Space Administration.
This research has made use of the Sloan Digital Sky Survey (SDSS). Funding for the SDSS and SDSS-II has been provided by the Alfred P. Sloan Foundation, the Participating Institutions, the National Science Foundation, the U.S. Department of Energy, the National Aeronautics and Space Administration, the Japanese Monbukagakusho, the Max Planck Society, and the Higher Education Funding Council for England. The SDSS Web Site is http://www.sdss.org/.
This work is partly based on observations obtained with XMM-Newton, an ESA science mission with instruments and contributions directly funded by ESA Member States and the USA (NASA).
References
- Amram et al. (2002) Amram P., Gavazzi G., Marcelin M., Boselli A., Vílchez J. M., Iglesias-Paramo J., Tarenghi M., 2002, Ap&SS, 281, 401
- Auld et al. (2006) Auld R., Minchin R. F., Davies J. I., Catinella B., van Driel W., Henning P. A., Linder S., Momjian E., Spekkens K., 2006, MNRAS, 371, 1617
- Baldwin et al. (1981) Baldwin J. A., Phillips M. M., Terlevich R., 1981, PASP, 93, 5
- Bekki (1999) Bekki K., 1999, ApJL, 510, L15
- Bekki et al. (2002) Bekki K., Couch W. J., Shioya Y., 2002, ApJ, 577, 651
- Berrier et al. (2009) Berrier J. C., Stewart K. R., Bullock J. S., Purcell C. W., Barton E. J., Wechsler R. H., 2009, ApJ, 690, 1292
- Bicker et al. (2002) Bicker J., Fritze-v. Alvensleben U., Fricke K. J., 2002, A&A, 387, 412
- Blumenthal et al. (1984) Blumenthal G. R., Faber S. M., Primack J. R., Rees M. J., 1984, Nature, 311, 517
- Boselli et al. (2005) Boselli A., Boissier S., Cortese L., Gil de Paz A., Buat V., Iglesias-Paramo J., Madore B. F., Barlow T., Bianchi L., Byun Y.-I., Donas J., Forster K., Friedman P. G., Heckman 2005, ApJL, 623, L13
- Boselli et al. (006b) Boselli A., Boissier S., Cortese L., Gil de Paz A., Seibert M., Madore B. F., Buat V., Martin D. C., 2006b, ApJ, 651, 811
- Boselli & Gavazzi (006a) Boselli A., Gavazzi G., 2006a, PASP, 118, 517
- Boselli et al. (1994) Boselli A., Gavazzi G., Combes F., Lequeux J., Casoli F., 1994, A&A, 285, 69
- Bravo-Alfaro et al. (2000) Bravo-Alfaro H., Cayatte V., van Gorkom J. H., Balkowski C., 2000, AJ, 119, 580
- Bravo-Alfaro et al. (2001) Bravo-Alfaro H., Cayatte V., van Gorkom J. H., Balkowski C., 2001, A&A, 379, 347
- Briggs (1995) Briggs D. S., 1995, in Bulletin of the American Astronomical Society Vol. 27 of Bulletin of the American Astronomical Society, High Fidelity Interferometric Imaging: Robust Weighting and NNLS Deconvolution. pp 1444–+
- Butcher & Oemler (1985) Butcher H. R., Oemler Jr. A., 1985, ApJS, 57, 665
- Byrd & Valtonen (1990) Byrd G., Valtonen M., 1990, ApJ, 350, 89
- Cavaliere & Fusco-Femiano (1976) Cavaliere A., Fusco-Femiano R., 1976, A&A, 49, 137
- Cayatte et al. (1994) Cayatte V., Kotanyi C., Balkowski C., van Gorkom J. H., 1994, AJ, 107, 1003
- Chincarini et al. (1983) Chincarini G. L., Giovanelli R., Haynes M., Fontanelli P., 1983, ApJ, 267, 511
- Chung et al. (2007) Chung A., van Gorkom J. H., Kenney J. D. P., Vollmer B., 2007, ApJL, 659, L115
- Chyży (2008) Chyży K. T., 2008, A&A, 482, 755
- Cortese et al. (2006) Cortese L., Gavazzi G., Boselli A., Franzetti P., Kennicutt R. C., O’Neil K., Sakai S., 2006, A&A, 453, 847
- Cortese et al. (2004) Cortese L., Gavazzi G., Boselli A., Iglesias-Paramo J., Carrasco L., 2004, A&A, 425, 429
- Cortese et al. (2008) Cortese L., Minchin R. F., Auld R. R., Davies J. I., Catinella B., Momjian E., Rosenberg J. L., Taylor R., Gavazzi G., O’Neil K., Baes M., Boselli A., Bothun G., Koribalski B., Schneider S., van Driel W., 2008, MNRAS, 383, 1519
- Cowie & Songaila (1977) Cowie L. L., Songaila A., 1977, Nature, 266, 501
- Dickey & Gavazzi (1991) Dickey J. M., Gavazzi G., 1991, ApJ, 373, 347
- Donnelly et al. (1998) Donnelly R. H., Markevitch M., Forman W., Jones C., David L. P., Churazov E., Gilfanov M., 1998, ApJ, 500, 138
- Dressler (1980) Dressler A., 1980, ApJ, 236, 351
- Dressler (2004) Dressler A., 2004, in Mulchaey J. S., Dressler A., Oemler A., eds, Clusters of Galaxies: Probes of Cosmological Structure and Galaxy Evolution Star-forming Galaxies in Clusters. p. 206
- Dressler et al. (1999) Dressler A., Smail I., Poggianti B. M., Butcher H., Couch W. J., Ellis R. S., Oemler A. J., 1999, ApJS, 122, 51
- Durbala et al. (2008) Durbala A., Sulentic J. W., Buta R., Verdes-Montenegro L., 2008, MNRAS, 390, 881
- Ellingson (2004) Ellingson E., 2004, in Diaferio A., ed., IAU Colloq. 195: Outskirts of Galaxy Clusters: Intense Life in the Suburbs The properties of galaxies on the outskirts of clusters. p. 327
- Fasano et al. (2000) Fasano G., Poggianti B. M., Couch W. J., Bettoni D., Kjærgaard P., Moles M., 2000, ApJ, 542, 673
- Fujita & Goto (2004) Fujita Y., Goto T., 2004, PASJ, 56, 621
- Fujita & Nagashima (1999) Fujita Y., Nagashima M., 1999, ApJ, 516, 619
- Gavazzi (1989) Gavazzi G., 1989, ApJ, 346, 59
- Gavazzi & Boselli (1999) Gavazzi G., Boselli A., 1999, A&A, 343, 93
- Gavazzi et al. (003b) Gavazzi G., Boselli A., Donati A., Franzetti P., Scodeggio M., 2003b, A&A, 400, 451
- Gavazzi et al. (001b) Gavazzi G., Boselli A., Mayer L., Iglesias-Paramo J., Vílchez J. M., Carrasco L., 2001b, ApJL, 563, L23
- Gavazzi et al. (1995) Gavazzi G., Contursi A., Carrasco L., Boselli A., Kennicutt R., Scodeggio M., Jaffe W., 1995, A&A, 304, 325
- Gavazzi et al. (003a) Gavazzi G., Cortese L., Boselli A., Iglesias-Paramo J., Vílchez J. M., Carrasco L., 2003a, ApJ, 597, 210
- Gavazzi & Jaffe (1987) Gavazzi G., Jaffe W., 1987, A&A, 186, L1
- Gavazzi et al. (001a) Gavazzi G., Marcelin M., Boselli A., Amram P., Vílchez J. M., Iglesias-Paramo J., Tarenghi M., 2001a, A&A, 377, 745
- Gavazzi et al. (1984) Gavazzi G., Tarenghi M., Jaffe W., Boksenberg A., Butcher H., 1984, A&A, 137, 235
- Giovanelli & Haynes (1985) Giovanelli R., Haynes M. P., 1985, ApJ, 292, 404
- Gunn & Gott (1972) Gunn J. E., Gott J. R. I., 1972, ApJ, 176, 1
- Haynes & Giovanelli (1984) Haynes M. P., Giovanelli R., 1984, AJ, 89, 758
- Hota & Saikia (2007) Hota A., Saikia D. J., 2007, Bulletin of the Astronomical Society of India, 35, 121
- Iglesias-Páramo et al. (2004) Iglesias-Páramo J., Boselli A., Gavazzi G., Zaccardo A., 2004, A&A, 421, 887
- Kenney et al. (2004) Kenney J. D. P., van Gorkom J. H., Vollmer B., 2004, AJ, 127, 3361
- Kronberger et al. (2008) Kronberger T., Kapferer W., Ferrari C., Unterguggenberger S., Schindler S., 2008, A&A, 481, 337
- Martig & Bournaud (2008) Martig M., Bournaud F., 2008, MNRAS, 385, L38
- Mihos (2004) Mihos J. C., 2004, in Mulchaey J. S., Dressler A., Oemler A., eds, Clusters of Galaxies: Probes of Cosmological Structure and Galaxy Evolution Interactions and Mergers of Cluster Galaxies. p. 277
- Moore et al. (1996) Moore B., Katz N., Lake G., Dressler A., Oemler A., 1996, Nature, 379, 613
- Moore et al. (1999) Moore B., Lake G., Quinn T., Stadel J., 1999, MNRAS, 304, 465
- Moran et al. (2007) Moran S. M., Ellis R. S., Treu T., Smith G. P., Rich R. M., Smail I., 2007, ApJ, 671, 1503
- Moss (2006) Moss C., 2006, MNRAS, 373, 167
- Natarajan et al. (2002) Natarajan P., Kneib J.-P., Smail I., 2002, ApJL, 580, L11
- Nulsen (1982) Nulsen P. E. J., 1982, MNRAS, 198, 1007
- Oemler (1974) Oemler A. J., 1974, ApJ, 194, 1
- Oemler et al. (1997) Oemler A. J., Dressler A., Butcher H. R., 1997, ApJ, 474, 561
- Poggianti et al. (2009) Poggianti B. M., Fasano G., Bettoni D., Cava A., Dressler A., Vanzella E., Varela J., Couch W. J., D’Onofrio M., Fritz J., Kjaergaard P., Moles M., Valentinuzzi T., 2009, ArXiv e-prints
- Poggianti et al. (1999) Poggianti B. M., Smail I., Dressler A., Couch W. J., Barger A. J., Butcher H., Ellis R. S., Oemler A. J., 1999, ApJ, 518, 576
- Roediger & Brüggen (2007) Roediger E., Brüggen M., 2007, MNRAS, p. 765
- Sakai et al. (2002) Sakai S., Kennicutt Jr. R. C., van der Hulst J. M., Moss C., 2002, ApJ, 578, 842
- Schneider et al. (1990) Schneider S. E., Thuan T. X., Magri C., Wadiak J. E., 1990, ApJS, 72, 245
- Solanes et al. (1996) Solanes J. M., Giovanelli R., Haynes M. P., 1996, ApJ, 461, 609
- Solanes et al. (2001) Solanes J. M., Manrique A., García-Gómez C., González-Casado G., Giovanelli R., Haynes M. P., 2001, ApJ, 548, 97
- Springel et al. (2001) Springel V., White S. D. M., Tormen G., Kauffmann G., 2001, MNRAS, 328, 726
- Springob et al. (2005) Springob C. M., Haynes M. P., Giovanelli R., 2005, ApJ, 621, 215
- Sun & Murray (2002) Sun M., Murray S. S., 2002, ApJ, 577, 139
- Sun & Vikhlinin (2005) Sun M., Vikhlinin A., 2005, ApJ, 621, 718
- Tonnesen (2007) Tonnesen S., 2007, New Astronomy Review, 51, 80
- van Gorkom (2004) van Gorkom J. H., 2004, in Mulchaey J. S., Dressler A., Oemler A., eds, Clusters of Galaxies: Probes of Cosmological Structure and Galaxy Evolution Interaction of Galaxies with the Intracluster Medium. p. 305
- Vollmer (2003) Vollmer B., 2003, A&A, 398, 525
- Vollmer et al. (2004) Vollmer B., Balkowski C., Cayatte V., van Driel W., Huchtmeier W., 2004, A&A, 419, 35
- Vollmer et al. (001b) Vollmer B., Braine J., Balkowski C., Cayatte V., Duschl W. J., 2001b, A&A, 374, 824
- Vollmer et al. (2008) Vollmer B., Braine J., Pappalardo C., Hily-Blant P., 2008, A&A, 491, 455
- Vollmer et al. (001a) Vollmer B., Cayatte V., Balkowski C., Duschl W. J., 2001a, ApJ, 561, 708
- West & Blakeslee (2000) West M. J., Blakeslee J. P., 2000, ApJL, 543, L27
- Wilman et al. (2009) Wilman D. J., Oemler A., Mulchaey J. S., McGee S. L., Balogh M. L., Bower R. G., 2009, ApJ, 692, 298
Appendix A BIG
The Blue Infalling Group is an interesting case of a compact group that has been suggested to be infalling toward the core of the SE sub–cluster with a relative velocity of 2000 km s-1 (Cortese et al., 2006). As well as the two principal galaxies CGCG 097-114 and CGCG 097-125, BIG contains an extraordinarily high concentration of dwarf galaxies with high star formation rates and extragalactic H ii regions (Sakai et al., 2002, Gavazzi et al. 2003a). Deep H imaging has revealed extensive gas streamers interpreted as resulting from a strong tidal interaction between members of the group (Cortese et al., 2006). H i in BIG has previously been imaged using the Westerbork Synthesis Radio Telescope (WSRT) by Sakai et al. (2002).
Our observations have higher spatial resolution that clearly show the offset between the highest density H i and the optical galaxy (Figure 12). Weak H i emission was detected by us at the position of a knot 15 arcsec (6 kpc) east of knot K2a, with peak H i emission at 8190 km s-1 or 70 km s-1 greater than K2a’s optical velocity (Figure 12). However, we did not pick up the large continuous region of low density H i extending west of CGCG 097-125 and running from below K2a north to DW2 seen with the WSRT (Sakai et al., 2002), which is probably due to our lower sensitivity. We were also unable to confirm in our robust 0 cube the H i to the west of the optical position of the irregular blue galaxy CGCG 097-114, observed with the WSRT, although weak emission was found after applying natural weighting. The weak detection of CGCG 097-114 implies a large H i deficiency which is confirmed by the Arecibo determined H i mass of 3 x 10⁸ M⊙ (Cortese et al., 2006).
Regarding the relative location of BIG with respect to the clus- ter centre, this is still matter of debate (Sakai et al. 2002; Gavazzi et al. 2003a; Cortese et al. 2006) . The calculation discussed in section 5.2 indicates that, if the group is within 0.5 Mpc from the cluster centre, we should expect evidence of strong ram pressure stripping. This, however, would seem to be contradicted by the presence of substantial amounts of extended H I in the velocity range from 8000 to 8500 km s-1, suggesting either that BIG lies in the background of A1367 or it has just started its infall into the cluster center.
Appendix B ABELL 1367[GP82]1227
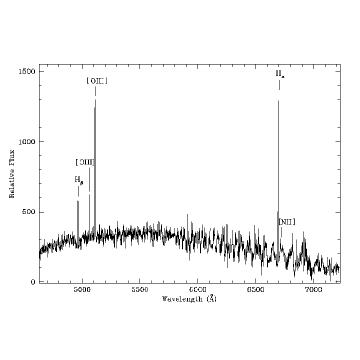
We obtained a low resolution (4.8 Å) spectrum of A 1367 [GP82]1227, covering the wavelength range 4630-7225 Å, in May 2007 (Figure 19). The observation was carried out with the 2.12–m telescope at the San Pedro Mártir Observatory (SPM) in Mexico, using a Boller & Chivens spectrograph, a 600 l/mm grating and a 2K Thomson CCD. This configuration gave a dispersion of 1.3 Å per pixel. The slit was placed in an East-West direction passing through the central region of the galaxy. Four 20 minute exposures were taken and the spectra were averaged after cosmic ray cleaning, extraction and wavelength calibration. A wavelength solution using about 30 He+Ar+Ne lamp lines, gave an uncertainly of 0.18 Å rms. Sky transparency was good, with the seeing slightly above 1 arcsec. Due to the faintness of the galaxy, the signal to noise obtained was only about 5 in the range 5500 - 6500 Å.
The spectrum of A 1367 [GP82]1227 shows the emission lines of Hβ ( = 4861.3), [OIII] (4958.9), [OIII] (5006.8) and Hα (6562.8) at 4963.8, 5063.2, 5112.3 and 6700.4 Å, respectively. This gives an emission–line radial velocity of 6307 km s-1, which is in good agreement with our H i velocity of 6239 km s-1 (see Table 2). These emission lines indicate active star formation in A 1367 [GP82]1227. The [OIII]( 5007)/Hβ and [NII]( 6584)/Hα ratios are 2.64 and 0.03, respectively (note that [NII] is barely visible in the spectrum) putting this galaxy completely in the locus of star forming galaxies in a BPT diagram (Baldwin et al., 1981). It was not possible to resolve the H regions individually with the SPM 2.12m.
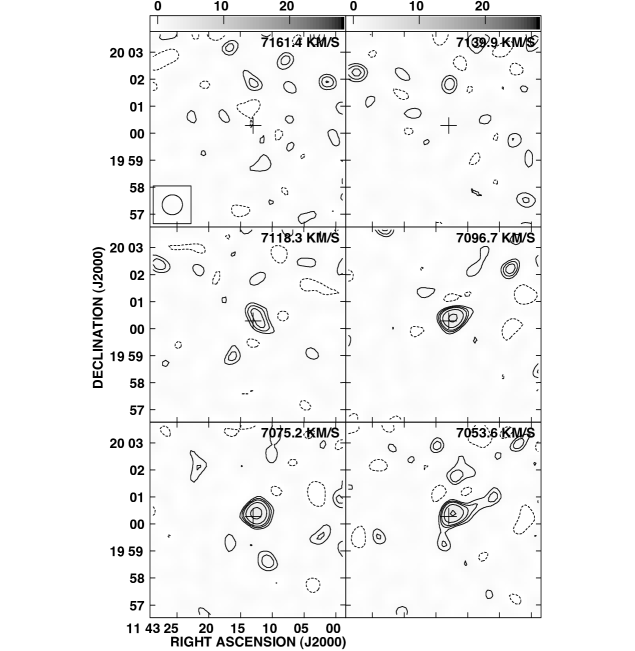
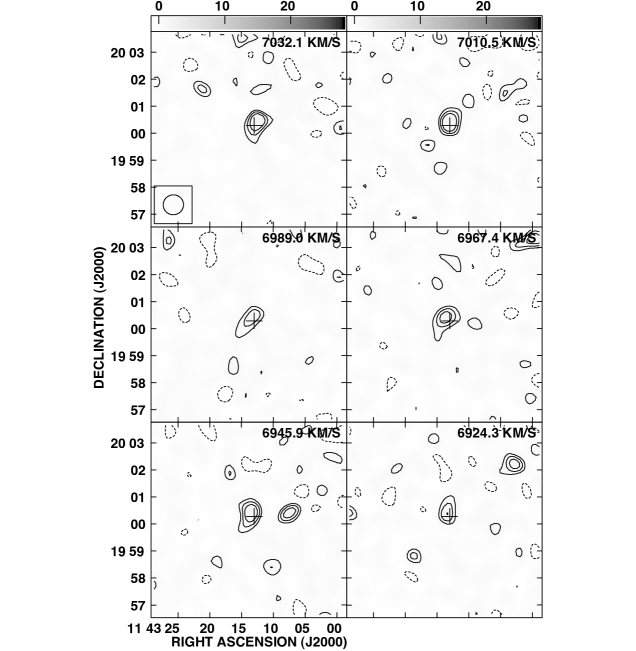
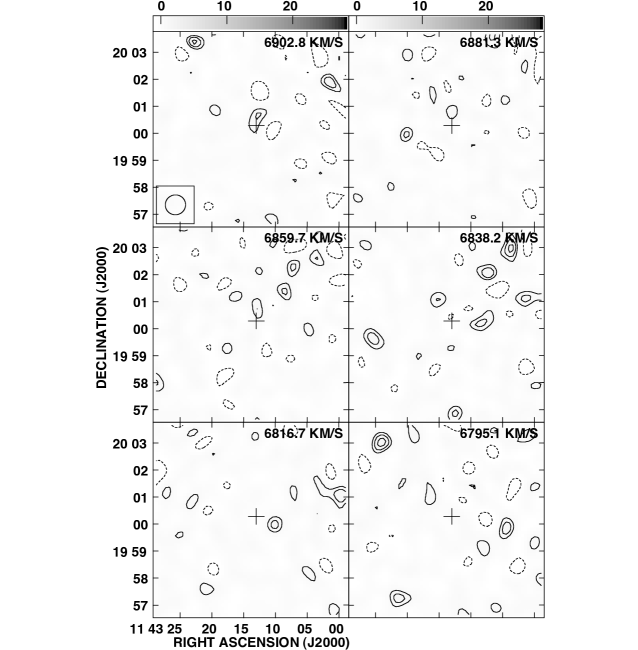
Appendix C CHANNEL MAPS OF THE VLA DETECTIONS
The channel maps for all VLA detections are available as supplementary online material. Below as an example of the online material are the channel maps for CGCG 097-079.