Institut Jean Nicod (CNRS) - École Normale Supérieure, 29 rue d’Ulm, F-75005 Paris, France
CREATE-NET Research Consortium - via alla Cascata 56D, 38123 Povo di Trento, Italy
Computer science and technology Social and economic systems World Wide Web, Internet
The effect of discrete vs. continuous-valued ratings on reputation and ranking systems
Abstract
When users rate objects, a sophisticated algorithm that takes into account ability or reputation may produce a fairer or more accurate aggregation of ratings than the straightforward arithmetic average. Recently a number of authors have proposed different co-determination algorithms where estimates of user and object reputation are refined iteratively together, permitting accurate measures of both to be derived directly from the rating data. However, simulations demonstrating these methods’ efficacy assumed a continuum of rating values, consistent with typical physical modelling practice, whereas in most actual rating systems only a limited range of discrete values (such as a 5-star system) is employed. We perform a comparative test of several co-determination algorithms with different scales of discrete ratings and show that this seemingly minor modification in fact has a significant impact on algorithms’ performance. Paradoxically, where rating resolution is low, increased noise in users’ ratings may even improve the overall performance of the system.
pacs:
89.20.Ffpacs:
89.65.-spacs:
89.20.Hh1 Introduction
With the growth of the internet and e-commerce [1], an increasing number of our social and commercial interactions are now one-shot exchanges with strangers identifiable only by easily-replaced pseudonyms [2]. Similarly, most items on sale from e-commerce websites must be purchased without an opportunity to try them first, creating an information asymmetry that encourages the provision of low-quality goods [3, *resnick2002, *resnick2006, *akerlof1970]. To offset this risk of fraud or deception, many online services implement reputation systems [7, *bolton2004, *masum2004, *josang2007] that collect ratings and feedback from users so as to provide a measure of trustworthiness for goods or individuals.
A key challenge is how to aggregate this feedback effectively given that not all ratings are equal. Some users’ judgement may be poor or malicious: for example, many eBay users forgo issuing deserved negative feedback to cheaters because the negative feedback they will receive in reprisal will devastate their own carefully cultivated good reputation [11]. An effective reputation system thus needs to distinguish between good and bad raters and ratings.
One approach to this has been the development of co-determination algorithms of reputation, where aggregate reputation (or quality) of rated objects111 We use ‘object’ simply as a generic term: the object of the rating. This might be an actual object, such as a book or CD, or it might be a person or organization, such as an eBay auctioneer, a website, or an Amazon Marketplace seller. is used to estimate a corresponding reputation (or ability) for the system’s users, and this latter measure is then used to re-weight the aggregation of ratings for objects [12, 13, *laureti2006, 15, *dekerchove2008, *dekerchove2009, *dekerchove2010]. By iterating this procedure over time, ratings from malicious or unskilled users can be weeded out, providing both a better estimation of object quality and an enhanced overall reputation-based ranking of objects.
Simulations to evaluate the effectiveness of these methods followed typical modelling practices in physics and applied mathematics, assuming a continuum of rating values (reflecting what may be presumed to be fine-grained shades of opinion). However, a near-universal feature of real user feedback and rating systems is that they permit ratings to take only a limited range of discrete values—most commonly the 5-star system employed by Amazon, YouTube, etc. The influence of this constraint has never been tested on the aforementioned algorithms, and the main purpose of the present letter is to explore how this quantization of ratings affects the co-determination procedure and the resulting ranking and reputation values.
Our simulations show that if the number of available rating choices is too few, this has a strong negative impact on the algorithms’ performance. Paradoxically, in such circumstances, having a community of users more prone to individual rating errors may actually increase the overall performance of the system. We compare these results with psychometric research on the measurement of attitudes, and discuss the implications for the construction of effective online reputation, ranking and rating systems.
2 Algorithms
The reputation and ranking algorithms explored in this paper all operate upon the same basic type of data. Suppose we have a set of users who have each rated some subset of the complete set of objects. For notational clarity we use Latin letters () for user-related indices and Greek letters () for object-related indices. The set of users who rated a given object is denoted by , while the set of objects rated by a user is denoted by , and the value of the rating of object by user is denoted by .
We assume that each object has an intrinsic quality from which the received ratings differ to a greater or lesser degree depending on the ability of the user. While in some online reputation systems there is an opportunity for users to ‘rate the ratings’, providing an extra measure of user reputation, we do not rely on the availability of such information: all the algorithms described here calculate user ability solely on the basis of the rating data. On the basis of such measures of user ability we can then estimate object quality using a weighted average of the ratings,
| (1) |
where the user weights are constructed by one of the following algorithms.
(i) Arithmetic average (AA). The baseline for comparison of reputation and ranking methods is simply to treat all user ratings equally, setting , or
| (2) |
which is of course the actual aggregation method used on most websites.
(ii) Mizzaro’s algorithm (Mizz). Mizzaro [12] has introduced a co-determination algorithm for the assessment of scholarly articles, with reputation scores for authors, articles and readers that co-evolve over time according to the ratings readers give to papers. The algorithm can readily be applied to the more general user-object case we consider here, with author scores omitted since their evolution is decoupled from the evolution of article and reader scores and they are irrelevant in the present context. For consistency with the rest of the paper we refer henceforth to objects and users instead of articles and readers.
The algorithm can be implemented in two versions, an incremental one where ratings are added one by one and an iterative one that can be applied to a pre-existing dataset. We have implemented both versions (which in any case, given the same data, produce the same result), but for ease of comparison to the other algorithms we describe here the simpler, iterative version.
Given a set of user weights , object quality values are calculated according to Eq. (1). User weights are then recalculated according to,
| (3) |
where
| (4) |
is a measure of steadiness of object quality , and
| (5) |
is a measure of disagreement between the given rating and the object score. represents the width of the rating range, i.e. the difference between the smallest and largest possible rating values, and this normalization guarantees that the value of will fall within the range .
The algorithm is initialized by setting equal weights for all users and then iterating repeatedly over the equations (1, 3) until the change in the vector of quality estimates between successive iteration steps,
| (6) |
falls below a certain threshold value222 Note that the algorithm may fail to converge if the threshold is set too low [15]. Conversely, too large a threshold may disrupt the iterative process. It may therefore take a few trials to choose an appropriate value. (in our simulations, we use ).
(iii) The Yu-Zhang-Laureti-Moret algorithm (YZLM). Yu and colleagues [13, *laureti2006] have introduced an algorithm that is essentially a generalized version of maximum likelihood estimation (MLE) [19], using a control parameter to determine how divergence from the community consensus affects user weight . Their own implementation considers only the case where all users have rated all objects, but it is trivial to generalize it to operate on sparse data.
Estimated object quality values are again calculated according to Eq. 1. We then calculate the divergence between the ratings of each user and the estimated object quality values,
| (7) |
and the updated weight of user is then given by
| (8) |
where the exponent determines the strength of the penalty applied to users with larger rating divergence (note that corresponds simply to the arithmetic average) and is a small positive constant so as to prevent user weights diverging (in our simulations, we use ). Yu et al. [13] noted that while provides better numerical stability of the algorithm as well as translational and scale invariance, is the optimal algorithm from the point of view of mathematical statistics [20]. We have used because it yields superior performance, but choosing does not alter the fundamental character of the results obtained here.
The algorithm is initialized like Mizz, by setting the weights for all users and then iterating repeatedly over the equations (1, 7, 8) until the vector of quality estimates changes less than the threshold value .
(iv) de Kerchove and Van Dooren’s algorithm (dKVD). De Kerchove and Van Dooren [15, *dekerchove2008, *dekerchove2009, *dekerchove2010] have introduced an algorithm similar to YZLM, but where the weight update function is given instead by
| (9) |
where is chosen such that . This has the advantage of guaranteeing convergence to a unique solution independent of starting weights (though in practice this is not a particular problem with any of the algorithms). In our simulations we adopt the strongest possible punishment of noisy raters by setting , where ensures non-zero weights if the are all identical. The algorithm is initialized in a similar manner to Mizz and YZLM by setting for all users and then iterating over Eqs. (1, 7, 9) until the vector of quality estimates changes less than the threshold value .
3 Artificial datasets
To test the methods described above, we create artificial datasets in the following way. For each object we randomly generate a real-valued true quality value from the uniform distribution333 It is possible to use non-uniform distributions, but given the limited rating scale this makes little practical difference. A more pertinent question is whether there can actually be such a thing as a ‘true’, objective quality value. The reasonableness of this assumption will vary depending on what kind of objects are being considered, probably with particular reference to whether an object will be assessed more on the basis of taste or functionality. , where is an integer . Similarly, for each user we randomly generate a personal error level from the distribution , where and scale with the width of the rating scale. For a given sparsity of the dataset , we randomly select unique user-object pairs444 In the extremely rare case that an object or user ends up without any such links, we discount them from further consideration, e.g. when assessing algorithms’ performance. and generate corresponding individual user estimates of object quality according to,
| (10) |
where the quality estimation error is drawn from the uniform distribution . The actual ratings are derived from these quality estimates depending on the degree of quantization desired: for continuous-valued ratings we simply take , while discrete rating values are obtained by rounding to the nearest integer, that is, . In both cases, values lying outside the prescribed range are truncated: those smaller than are changed to and those greater than are changed to . This follows the real-life constraint that, no matter how much a user may adore or detest a particular object, they still cannot rate it higher or lower than the given rating bounds. While changing does not produce a qualitative difference in outcome for continuous-valued ratings, the constraint of discrete integer values means that determines the resolution of rating precision, that is, the number of distinct discrete rating values. Note that since we assume and scale with this is equivalent to increasing the resolution by taking a higher number of equally-spaced discrete rating values within a fixed range: increasing the width of the rating scale and taking integer values is simply easier to implement.
4 Performance metrics
A simple and easy test of algorithm performance is to compare the algorithm’s estimated quality values and the ‘true’ quality , and calculate the root-mean-square error [13, *laureti2006],
| (11) |
using the normalization to compare performance on datasets with different rating resolution . Since user weight is not expected to be equal to the true user ability, we use Kendall’s rank correlation coefficient [21] to compare the true ability ranking of users according to with the estimated ranking given by . A result of indicates that the true and estimated rankings are identical, that they are completely inverted, and that the rankings are entirely uncorrelated.
While well defined for artificial numerical simulations, neither of these measures can easily be applied to real data, where objective measures of object quality or user ranking difficult or impossible to obtain. In the absence of reliable per-item or per-user measures of accuracy, an effective approach is to specify a group of ‘relevant’ objects or users and inspect their position in the ranking [22]. To do this we employ the receiver operating characteristic (ROC) curve [23, *hanley1982, *fawcett2006], constructed by plotting for each place in the ranking a point in whose values correspond respectively to the proportion of irrelevant and relevant objects recovered so far. The ranking accuracy can then be estimated by the area under the curve (AUC), which equals when every relevant object/user is ranked higher than every irrelevant object/user, when the distribution of relevant objects/users is random, and when every irrelevant object/user is ranked higher than every relevant object/user. In the simulations presented here, we denote as ‘relevant’ the of objects/users with respectively the highest true quality values or lowest error .
5 Results
For the results presented here we generated artificial datasets of users and objects, with sparsity . For each simulation we used the same datasets to test each reputation algorithm. Our first simulations keep a constant rating resolution and a constant lower bound for the distribution of user’s personal error levels, while the upper bound was varied in the range . This range was chosen so that, at its most extreme, the least skilled users (i.e. those with ) could potentially rate a ‘perfect’ 5-star object with the lowest rating value 1, and vice versa.
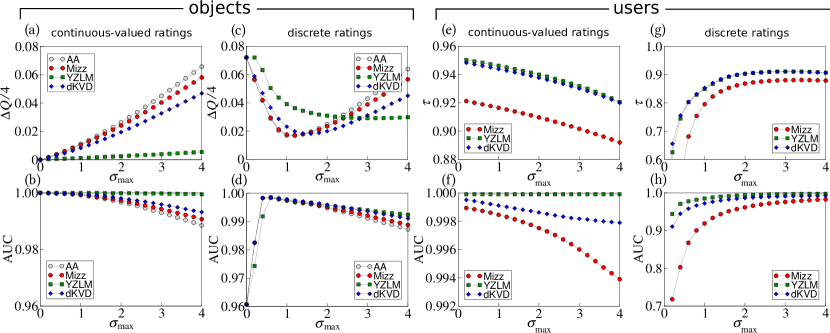
Figure 1a,b,e,f presents the performance of the algorithms when we use continuous-valued ratings, i.e. when exactly, and vary the upper error bound . We observe immediately that YZLM is by far the least sensitive to the increasing error level, maintaining the lowest object quality error and the best user ranking (Kendall’s ), and the highest AUC () for both objects and users. This is because of all the methods YZLM places the harshest sanction against ‘noisy’ raters who diverge from the aggregate estimated quality, a feature that can be observed in the ranking of users, where we observe near-identical values of for both YZLM and dKVD (their weights and hence ranking stem from the same measure of user rating divergence) but consistently higher AUC for YZLM (the very best users are more consistently pushed to the top of the ranking due to the harsher sanction). The superiority of YZLM is maintained across different sizes of dataset and different data sparsity values, and is found to be dependent primarily on : if this lower error bound is increased, results from all four algorithms become similar as, in the absence of objectively good raters, there is much less advantage to be had in discriminating between better and worse555 The degree of superiority shown by YZLM actually depends both on the value of and the difference . We do not provide a detailed illustration of this for reasons of space, but the effect can be observed in the differences in asymptotic values of AUC between the upper and lower panels of Fig. 2. .
To assess the difference between continuous- and discrete-valued ratings, we took the same sets of artificial data and repeated the analysis with ratings now constrained to integer values (1–5). As shown in Fig. 1c,d,g,h, this quantization has a substantial negative effect on performance, with in particular being disastrous for all reputation algorithms. As increases, , and object and user AUC improve—and then, in some cases, and object AUC worsen again. We also notice that the relative performance of the methods with respect to and object AUC is inverted for , with YZLM the worst-performing of the algorithms, regaining its superiority only when the upper error bound is large.
The apparent paradox of better performance resulting from increasing error can be explained as follows. Imagine an object with ‘true’ quality being assessed by two distinct groups of users, the first whose quality assessment is always error-free (), the second whose error levels are set at (i.e. the average error level of a user from a group with error levels drawn from ). Users from the first group will of course make correct quality judgements , but the discrete rating system forces them to adopt the nearest integer value of . The resulting average (also ) will thus differ from the true quality by . By contrast the ‘noisy’ users’ quality estimates will be distributed uniformly in the range and so on average 60% of them will give a discrete rating of 3 and 40% will give 4, leaving an average of 3.4—that is, on average a perfect match to the original quality value. Effectively, the constraint of discrete ratings produces a systematic quantization error, which ‘noisy’ users can offset in the same way that dither can reduce quantization error in signal processing [26, *gray1993, *carbone1994].
A slightly more subtle argument is needed to explain the bad performance of YZLM when faced with any but the largest levels of error. Here we note that, while the aggregate error of low- agents may be greater, their individual error will still on average be less. YZLM, with its strong bias towards users with low observed error rates, will thus favour these users, suppressing noisy agents and consequently harming aggregate performance. This is confirmed by Fig. 1g,h, where we observe that while overall accuracy of user ranking (Kendall’s ) suffers with low , the high AUC values indicate that the lowest- users are still being pushed towards the top of the ranking. As increases, aggregate error of the wider population grows and YZLM’s suppression of high individual error rates acts to suppress this, sustaining its performance while the other algorithms suffer.
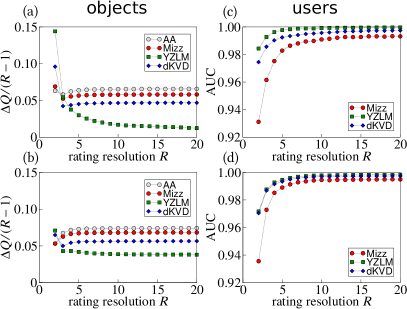
To better understand the effects of changing the rating resolution, we performed simulations where user error was fixed in proportion to the width of the rating scale, and varied the value of while taking discrete ratings. Fig. 2 shows the results for two sets of simulations, the first with , the second with , using and AUC to measure performance in assessing objects (a, b) and users (c, d) respectively. In both cases , so that the maximum possible user error covers the full range of the rating scale.
As we increase the rating resolution , we observe a gradual approach to asymptotic values of object () and user (AUC) performance comparable to those obtained with continuous-valued ratings. Similar to Fig. 1c, there is a marked difference between YZLM and the other algorithms with respect to . Whereas AA, Mizz and dKVD have only a limited response to increasing resolution, YZLM is able to reap a significant benefit, with its performance sustaining continuous improvement even as approaches . The reason is made clear by Fig. 2c, where we observe that unlike the other algorithms, increasing permits YZLM to push the lowest- users consistently to the very top of the ranking ().
YZLM’s dependency on low- raters is further emphasized by Fig. 2b, where the performance of AA, Mizz and dKVD are little affected by the higher value of but where now YZLM performs better for binary ratings (again, the ‘increased noise=better performance’ paradox) while no longer sustaining any significant improvements in for . When observing AUC for user ranking (Fig. 2d), we observe that now YZLM too is unable to consistently push the lowest- users to the top, with asymptotic AUC values now near-identical to dKVD.
6 Discussion
Psychometric research has put considerable effort into understanding the effectiveness and reliability of different rating scales, particularly with respect to the scale resolution [29, *cox1980, *alwin1992, 32, *benson1971, 34, 35, *svensson2000]. Factors to take into account include both the information-carrying capacity of the scale and the information-processing capacity of respondents [37], as well as psychological influences such as the descriptive labels associated with responses [38].
The relevance of these factors depends on exactly what kind of information one wants to extract from the scale. If the aim is to aggregate or average over respondents, three or even two discrete response options may suffice [32, *benson1971]. Conversely, if the focus is on individual difference, finer-grained scales become necessary [34].
Co-determination algorithms are prima facie aggregation mechanisms, but they also employ measures of individual difference to improve the aggregation process [12, 13, *laureti2006, 15, *dekerchove2008, *dekerchove2009, *dekerchove2010]. The effect of rating resolution on their performance will therefore depend on several factors, including the degree to which there are meaningful and reliable differences in user rating ability, whether the scale is fine-grained enough to accurately reflect those differences, and the algorithm’s ability to measure and exploit this information if it exists.
In this letter we have investigated the influence of low rating resolution on the performance of several co-determination reputation and ranking algorithms. While the presence of an non-zero optimal noise level (Fig. 1c,d) may be seen as a mere mathematical curiosity—in effect an example of quantization error being reduced by the application of dither [26, *gray1993, *carbone1994]—the worsened performance of these methods is an important finding. Psychometric studies have in general suggested that there is little benefit to be had from using more than 7 discrete rating categories [29, *cox1980, *alwin1992]. Our results suggest that in fact this may prevent the maximum exploitation of rating data, precluding the fine-grained observation of individual difference necessary to improve the aggregation process. A comparison can be drawn to models of opinion dynamics inspired by the Potts model, where if the number of spin/opinion values is too few, opinions become homogenized across the population, while as , diverse regions of different opinion can be preserved [39, *sire1995, *axelrod1997, *castellano2009].
We have also shown that, where the rating resolution is high enough, co-determination algorithms—particularly YZLM—are able to achieve significantly better results than a mere arithmetic average. Given that psychometric studies have not shown any major disadvantages of using higher-resolution scales [35, *svensson2000], it may thus be preferable for modern rating and reputation systems to employ continuous-valued scales such as the graphic rating scale or the visual analogue scale [43, *freyd1923a, *freyd1923b, *aitken1969, *ahearn1997]. In an online world such scales can be implemented easily through the use of percentage scores or slider bars [48, *ladd2009]. Empirical studies employing these and other rating methods should be able to determine if and when respondents are in practice able to achieve the required precision of judgement, and so help to identify the situations where a sophisticated method may yield superior performance.
Acknowledgements.
We thank Yi-Cheng Zhang, Yi-Kuo Yu, Hassan Masum, Tao Zhou and Luo-luo Jiang for many inspiring conversations, and two anonymous referees for their valuable feedback. Special thanks to Judith Simon and Ethan Munson for suggesting connections to the psychometrics and signal processing literature. This work is part of the Liquid Publications Project (http://project.liquidpub.org/) under EU FET-Open grant no. 213360.References
- [1] \NameLyman P., Varian H. R. et al. \BookHow much information? http://www2.sims.berkeley.edu/research/projects/how-much-info-2003/ (2003)
- [2] \NameFriedman E. J. Resnick P. \REVIEWJ. Econ. Management Strategy102001173
- [3] \NameMelnik M. I. Alm J. \REVIEWJ. Indust. Econ.502002337
- [4] \NameResnick P. Zeckhauser R. \REVIEWAdv. Appl. Microecon.112002127
- [5] \NameResnick P., Zeckhauser R., Swanson J. Lockwood K. \REVIEWExper. Econ.9200679
- [6] \NameAkerlof G. A. \REVIEWQ. J. Econ.841970488
- [7] \NameResnick P., Zeckhauser R., Friedman E. Kuwabara K. \REVIEWCommun. ACM43200045
- [8] \NameBolton G. E., Katok E. Ockenfels A. \REVIEWManagement Sci.5020041587
- [9] \NameMasum H. Zhang Y.-C. \REVIEWFirst Monday920047
- [10] \NameJøsang A., Ismail R. Boyd C. \REVIEWDecision Support Syst.432007618
- [11] \NameKollock P. \BookThe production of trust in online markets in \BookAdvances in Group Processes, edited by \NameLawler E. J., Macy M., Thyne S. Walker H. A. Vol. 16 (JAI Press, Greenwich, CT) 1999
- [12] \NameMizzaro S. \REVIEWJ. Am. Soc. Info. Sci. Tech.542003989
- [13] \NameYu Y.-K., Zhang Y.-C., Laureti P. Moret L. \REVIEWPhysica A3712006732
- [14] \NameLaureti P., Moret L., Zhang Y.-C. Yu Y.-K. \REVIEWEurophys. Lett.7520061006
- [15] \Namede Kerchove C. Van Dooren P. arXiv:0711.3964 (2007)
- [16] \Namede Kerchove C. Van Dooren P. \REVIEWSIAM News4320081314
- [17] \Namede Kerchove C. Van Dooren P. \REVIEWLect. Notes Comput. Sci.38920093
- [18] \Namede Kerchove C. Van Dooren P. \REVIEWSIAM J. Matrix Anal. Appl.3120101812
- [19] \NameFisher R. A. \REVIEWProc. Camb. Phil. Soc.221925700
- [20] \NameHoel P. G. \BookIntroduction to Mathematical Statistics 5th Edition (Wiley, New York) 1984
- [21] \NameKendall M. G. \REVIEWBiometrika30193881
- [22] \NameHerlocker J. L., Konstan J. A., Terveen L. G. Riedl J. T. \REVIEWACM Trans. Info. Syst.2220045
- [23] \NameSwets J. A. \REVIEWScience1411963245
- [24] \NameHanley J. A. McNeil B. J. \REVIEWRadiol.143198229
- [25] \NameFawcett T. \REVIEWPattern Recogn. Lett.272006861
- [26] \NameRoberts L. G. \REVIEWIRE Trans. Info. Th.81962145
- [27] \NameGray R. M. Stockham T. G. \REVIEWIEEE Trans. Info. Th.391993805
- [28] \NameCarbone P. Petri D. \REVIEWIEEE Trans. Instr. Meas.431994389
- [29] \NameGreen P. E. Rao V. R. \REVIEWJ. Marketing34197033
- [30] \NameCox E. P. \REVIEWJ. Marketing Res.171980407
- [31] \NameAlwin D. F. \REVIEWSociol. Meth.22199283
- [32] \NameJacoby J. Matell M. S. \REVIEWJ. Marketing Res.81971495
- [33] \NameBenson P. H. \REVIEWJ. Marketing35197159
- [34] \NameLehman D. R. Hulbert J. \REVIEWJ. Marketing Res.91972444
- [35] \NamePreston C. C. Colman A. M. \REVIEWActa Psychol.10420001
- [36] \NameSvensson E. \REVIEWBiometr. J.422000417
- [37] \NameHulbert J. \REVIEWJ. Marketing Res.121975104
- [38] \NameAlwin D. F. Krosnick J. A. \REVIEWSociol. Meth. Res.201991139
- [39] \NameWu F. Y. \REVIEWRev. Mod. Phys.541982235
- [40] \NameSire C. Majumdar S. N. \REVIEWPhys. Rev. E521995244
- [41] \NameAxelrod R. \REVIEWJ. Conflict Resolut.411997203
- [42] \NameCastellano C., Fortunato S. Loreto V. \REVIEWRev. Mod. Phys.812009591
- [43] \NameHayes M. H. S. Patterson D. G. \REVIEWPsychol. Bull.18192198
- [44] \NameFreyd M. \REVIEWJ. Educ. Psychol.14192383
- [45] \NameFreyd M. \REVIEWJ. Educ. Res.81923433
- [46] \NameAitken R. C. B. \REVIEWProc. R. Soc. Med.621969989
- [47] \NameAhearn E. P. \REVIEWJ. Psychiatr. Res.311997569
- [48] \NameMarsh-Richard D. M., Hatzis E. S., Mathias C. W., Venditti N. Dougherty D. M. \REVIEWBehav. Res. Meth.41200999
- [49] \NameLadd D. A. \BookEverybody likes Likert: using a variable-interval slider to collect interval-level individual opinions in \BookProc. 30th Int. Conf. on Information Systems [ICIS] (AIS, Atlanta, GA) 2009