Unveiling the Nature of Submillimeter Galaxy SXDF 850.6
Abstract
We present an 880 Submillimeter Array (SMA) detection of the submillimeter galaxy SXDF 850.6. SXDF 850.6 is a bright source ( mJy) detected in the SCUBA Half Degree Extragalactic Survey (SHADES), and has multiple possible radio counterparts in its deep radio image obtained at the VLA. Our new SMA detection finds that the submm emission coincides with the brightest radio emission that is found north of the coordinates determined from SCUBA. Despite the lack of detectable counterparts in deep UV/optical images, we find a source at the SMA position in near-infrared and longer wavelength images. We perform SED model fits to UV–optical–IR photometry (, 3.6 , 4.5 , 5.8 , and 8.0 ) and to submm–radio photometry (850 , 880 , 1100 , and 21 cm) independently, and we find both are well described by starburst templates at a redshift of . The best-fit parameters from the UV–optical–IR SED fit are a redshift of , a stellar mass of , an extinction of mag, and an age of Myr. The submm–radio SED fit provides a consistent redshift of –2.5, an IR luminosity of = (7–26) , and a star formation rate of 1300–4500 . These results suggest that SXDF 850.6 is a mature system already having a massive amount of old stellar population constructed before its submm bright phase and is experiencing a dusty starburst, possibly induced by major mergers.
Subject headings:
galaxies: formation, galaxies: starburst, cosmology: observations, galaxies: high redshift, submillimeter1. Introduction
Millimeter/submillimeter surveys have revolutionized observational cosmology by uncovering a substantial new population of mm/submm-bright dusty starburst galaxies at high redshifts (SMGs) (e.g., Smail, Ivison & Blain, 1997; Barger et al., 1998; Hughes et al., 1998; Scott et al., 2002; Coppin et al., 2006; Greve et al., 2004; Laurent et al., 2005; Scott et al., 2008; Perera et al., 2008; Austermann et al., 2009; Tamura et al., 2009, and see also Blain et al. 2002 for a review). The energy source of mm/submm emission is primarily from intense star formation activity, with star formation rates (SFRs) of 100 to several 1000 , and possibly partially from an active galactic nucleus (AGN) (e.g., Alexander et al., 2005). While spectroscopic observations of radio-identified SMGs find a median redshift of 2.2 (Chapman et al., 2005), several SMGs have now been found up to and beyond (e.g., Capak et al., 2008; Coppin et al., 2009; Daddi et al., 2009). There is a hypothesis that SMGs are progenitors of present-day massive ellipticals (e.g., Lilly et al., 1999; Smail et al., 2004), however, little is known about their evolution process.
While multi-wavelength analysis is essential in order to understand the nature of SMGs, the coarse angular resolution of single dish telescopes prevents a precise determination of the exact optical/NIR counterparts. One of the most successful ways to pinpoint the location of the submm emission is to obtain high resolution, deep radio imaging (e.g, Ivison et al., 1998, 2000, 2002; Smail et al., 2000; Barger et al., 2000). Although this technique reveals robust radio counterparts of 50%–80% of submm sources (e.g., Ivison et al., 2005, 2007; Wagg et al., 2009), sometimes multiple radio counterpart candidates are found for a source.
The most accurate means of achieving high precision astrometry on the submillimeter emission is clearly to observe with high angular resolution at the wavelength of the original detection. In this respect, the Submillimeter Array (SMA; Ho et al., 2004) has proved to be a powerful instrument (Iono et al., 2006a, b; Wang et al., 2007; Younger et al., 2007, 2008; Ivison et al., 2008).
Here we present the results from the SMA observations toward an 8 mJy submm source, SXDF 850.6, detected in the SCUBA Half Degree Extragalactic Survey (SHADES). SHADES has observed a large area of the sky (720 arcmin2) with high sensitivity ( 2 mJy) with the purpose of obtaining a statistically significant unbiased sample of submillimeter sources (Mortier et al., 2005; Coppin et al., 2006). The regions covered by SHADES are divided between two fields, the Lockman Hole and the Subaru/XMM-Newton Deep Field (SXDF). SXDF 850.6 is a source in the SXDF with multiple optical, IR, and radio counterparts (Ivison et al., 2007; Clements et al., 2008), but no established submm source identification. The strongest radio emission has no confirmed optical counterpart, but the two secondary radio peaks both have apparent optical associations.
§ 2 outlines the observational and calibration details, and the results are presented in § 3. In § 4, multi-wavelength data are described. The results of SED model fitting using the photometry are presented in § 5. In § 6, we discuss the nature of SXDF 850.6. A summary is presented in § 7. Throughout the paper, magnitudes are in the AB system, and we adopt a cosmology with km s-1 Mpc-1, , and .
2. Observations and Data Reduction
SXDF 850.6 was observed on September 21 and October 7, 2004, and on October 9 and 14, 2005, using a compact configuration with 7 – 8 antennas of the SMA. The phase center was positioned at the submm source centroid which is (J2000) = and (J2000) = . The unprojected baseline length ranged from 23 m to 139m. The SMA correlator was equipped with 2 GHz total bandwidth in each sideband, yielding a total of 4 GHz bandwidth for continuum observations. A continuum channel was generated by vector averaging all of the channels after calibration. The SIS receivers were tuned to 345 GHz for the USB, yielding 335 GHz for the LSB. Interferometric pointing was checked at the beginning of the track and the pointing offsets were usually within (15% of the primary beam) for all antennas. We used an integration time of 30 seconds.
The raw SMA data was calibrated using the MIR package (Scoville et al., 1993). Passband calibration was done using bright QSOs and planets observed during the track. Antenna based phase calibration was done using J0238+166 (1.02 Jy), J0423-013 (1.67 Jy) and J0132-169 (0.84 Jy). The flux levels of all sources were normalized using the the quasar flux estimates derived from the primary flux standard Uranus. Imaging was carried out in MIRIAD (Sault et al., 1995). Maximum sensitivity was achieved by adopting natural weighting, which gave a final synthesized beam size of (P.A. = ) and an RMS noise of 1.2 mJy. Because the source is close to zero in declination, the uv coverage is undersampled in the north-south direction and the resultant synthesized beam has multiple sidelobes at the 30% level along the north-south direction about away from the synthesized beam. The final map was made after adding the data from all four days and two sidebands, and corrected for the attenuation by the primary beam of the SMA. The astrometric accuracy is likely dominated by the low S/N of the image, and we assess .
3. Results
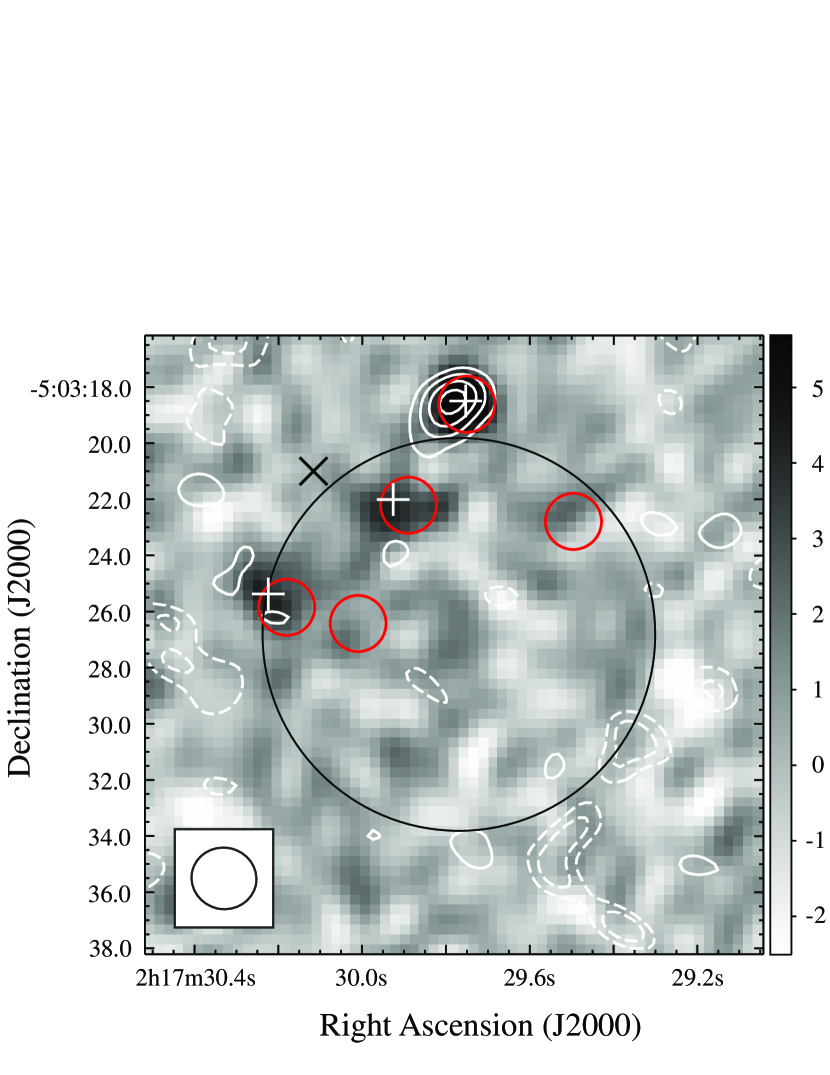
The synthesized map is shown in Figure 1. A source was detected at about 6 sigma significance north of the SCUBA coordinates. The source appears slightly elongated in the northeast-southwest direction but this is likely caused by the low S/N, and the source is entirely unresolved with the SMA beam. Based on a point source fit to the visibilities, the derived flux is mJy, and the coordinates are (J2000) = and (J2000) = . The derived flux is consistent with the SCUBA 850 flux of mJy (Coppin et al., 2006) within the uncertainties of both measurements.
4. Multi-wavelength Data
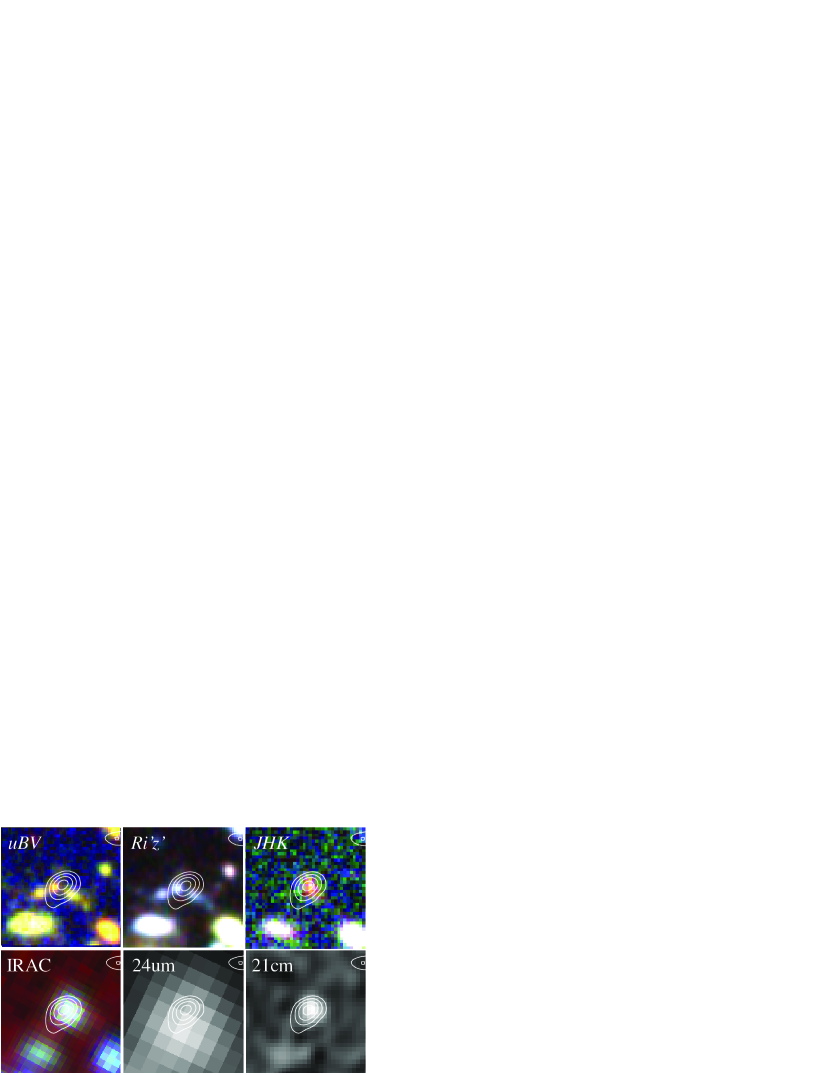
Multi-wavelength images around SXDF 850.6 are shown in Figure 2. While an obvious optical counterpart is not seen in the images from to bands, the NIR images represented in and longer wavelength images show a presence of a counterpart. The photometry of the counterpart and upper limits at the SMA position are presented in Table 4.4.
4.1. Radio and Millimeter
Ivison et al. (2007) identify three radio counterpart candidates for SXDF 850.6 in their deep VLA 21 cm map based on the probability analysis method of Downes et al. (1986). All three radio sources have corresponding MIPS 24 sources (Clements et al., 2008), as shown in Figure 1. The SMA observation reveals that the correct radio counterpart is the most distant source from the SCUBA centroid, and the brightest in 24 emission. This demonstrates the effectiveness of the SMA in identifying SMG counterparts, especially in situations with multiple counterpart candidates.
The radio coordinates derived from reanalysis of the VLA image (Arumugam et al. in prep.) are (J2000) = () and (J2000) = (), with peak and integrated flux of Jy and Jy respectively. The close similarity of the peak and integrated flux suggests that the radio emission is unresolved with the beam (P.A. = ).
4.2. Mid-IR
Spitzer/IRAC and MIPS data are taken from the SpUDS archive. The 3 detection limits are 0.58, 0.89, 5.7, and 5.3 Jy in IRAC bands (3.6, 4.5, 5.8, and 8.0 ), and 36 Jy in MIPS 24 band. The photometry was performed using the SExtractor package (Bertin & Arnouts, 1996). The photometry in IRAC bands is conducted with diameter aperture, and the photometric zero-points of the images are determined using colors of early-type stars between -band and IRAC bands following Lacy et al. (2005). In order to derive total flux, the aperture photometry are corrected by assuming IRAC PSFs by a factor of 1.36, 1.40, 1.65, and 1.84, respectively, The photometry in the 24 band is conducted using 12′′ diameter aperture. The aperture magnitude is corrected by a factor of 1.70.
4.3.
J, H, and K band images are obtained from UKIDSS (UKIRT InfraRed Deep Sky Surveys) Ultra Deep Survey Third Data Release (Laurent et al., 2005). The 3 detection limits are 24.28, 24.08, and 24.18 mag, respectively.
A faint source is detected at the SMA position in all bands. We perform photometry using the SExtractor. Aperture photometry with diameter aperture in the , , and bands are corrected by difference between the aperture and the total (MAG_AUTO) magnitudes in the -band.
4.4.
We present a -band image of MOSAIC II on CTIO 4-m telescope (Fujishiro et al. in prep.), , and images of SuprimeCam on Subaru telescope in Figure 2. , , , , and band images are obtained from Subaru/XMM-Newton Deep Survey database (SXDS; Furusawa et al., 2008). No galaxy is detected at the SMA position in these bands. The 3 detection limits are 26.00, 27.94, 27.68, 27.43, 27.45, and 26.43 mag, respectively.
Near the SMA position, three galaxies are seen; south-east, south-east, and south-west to the SMA position. We derive photometric redshifts for the sources and find that they are likely to be at , and it is unlikely that they are related to the SMA source (see § 5).
| Band | Flux | Instrument | Ref. |
|---|---|---|---|
| Jy | MOSAIC II | 1 | |
| Jy | SuprimeCam | 1 | |
| Jy | SuprimeCam | 1 | |
| Jy | SuprimeCam | 1 | |
| Jy | SuprimeCam | 1 | |
| Jy | SuprimeCam | 1 | |
| Jy | WFCAM | 1 | |
| Jy | WFCAM | 1 | |
| Jy | WFCAM | 1 | |
| 3.6 | Jy | IRAC | 1 |
| 4.5 | Jy | IRAC | 1 |
| 5.8 | Jy | IRAC | 1 |
| 8.0 | Jy | IRAC | 1 |
| 24 | Jy | MIPS | 1 |
| 70 | 30 mJy | MIPS | 2 |
| 160 | 200 mJy | MIPS | 2 |
| 450 | 81 mJy | SCUBA | 3 |
| 850 | mJy | SCUBA | 3 |
| 880 | mJy | SMA | 1 |
| 1100 | mJy | AzTEC | 4 |
| 21 cm | Jy | VLA | 5 |
| 0.2–12 keV | erg cm-2 s-1 | XMM-Newton | 6 |
Note. — Limits are 3.
References. — (1) This work; (2) Flux limits in the SWIRE catalog (Surace et al. in prep.); (3) Coppin et al. 2006; (4) Ikarashi et al. in prep.; (5) Arumugam et al. in prep. (6) FLIX: upper limit server for XMM-Newton data provided by the XMM-Newton Survey Science Centre
5. SED Fitting
We perform SED model fitting to the photometry data from UV to radio to estimate photometric redshifts and other physical properties (stellar mass, -band extinction, star formation timescale, and metallicity). The photometric data are divided into two wavelength ranges: (1) from UV to 8.0 , where stellar emission is dominant, (2) from submm to radio, where thermal dust and synchrotron emission is dominant.
5.1. UV – Optical – IR
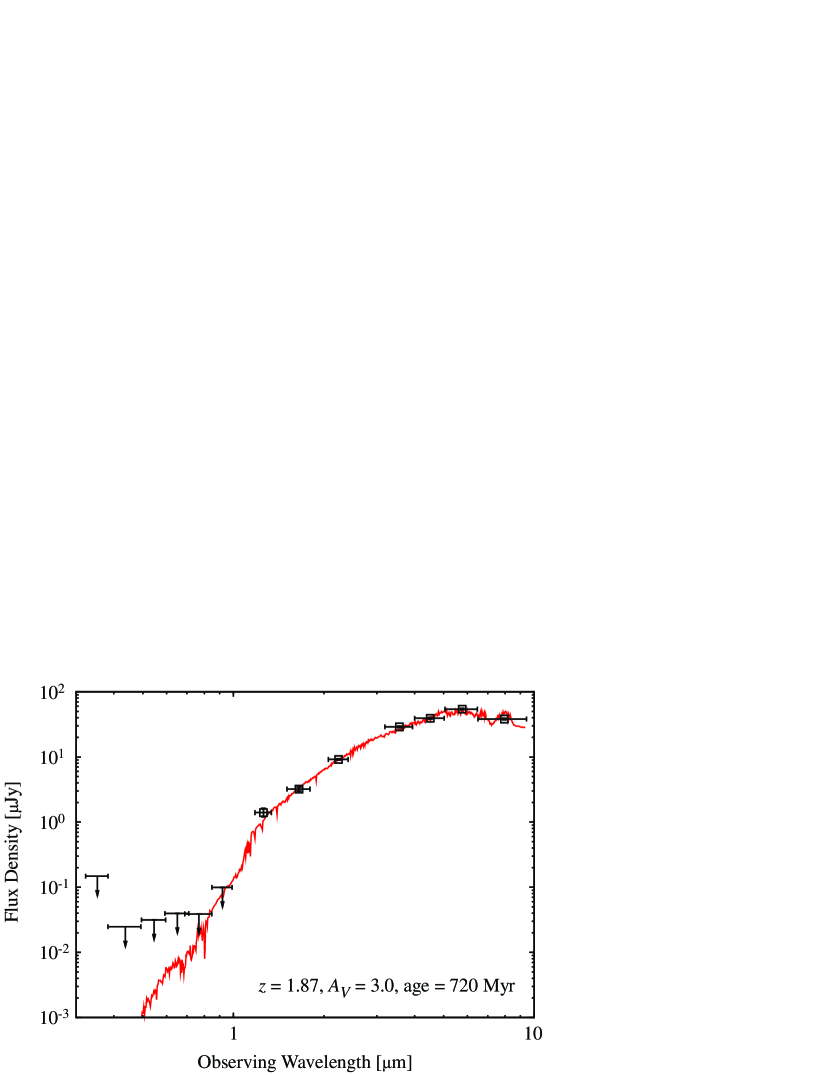
SED fits are performed to the photometry ranging from UV to 8.0 (, 3.6 , 4.5 , 5.8 , and 8.0 ) using the Hyperz code (Bolzonella et al., 2000). We use a synthetic spectral library of GALAXEV (Bruzual & Charlot, 2003) for SED templates. We adopt the Calzetti extinction law (Calzetti et al., 2000) and the Chabrier (2003) initial mass function with lower and upper cutoff mass of 0.1 and 100 . Two star formation histories are assumed: (i) exponentially decaying SFR with a timescale of (i.e., ), (ii) constant SFR. We calculate values for each SED template with free parameters of redshift (–6), stellar mass (), -band attenuation (–6.0), star formation timescale (–5 Gyr), and metallicity ( ). The best-fit results are obtained with the exponentially decaying SFR, , , mag, and age = Myr (Table 2 and Figure 3). The results suggest that SXDF 850.6 has a large population of old stars, with large amount of dust obscuring the stellar emission. The stellar mass is comparable to those of massive star-forming galaxies at (e.g., Shapley et al., 2005; Erb et al., 2006a) and consistent with stellar masses recently derived for other SMGs (– ) (e.g., Dye et al., 2008; Michałowski et al., 2009).
| Age | ||||||
|---|---|---|---|---|---|---|
| () | (mag) | (Myr) | (Myr) | () | ||
| (1) | (2) | (3) | (4) | (5) | (6) | (7) |
| 20 | 1 | 13.4 |
Note. — The errors are 68% confidence intervals. (1) photometric redshift; (2) stellar mass; (3) -band attenuation; (4) age; (5) star formation timescale; (6) metallicity; (7) value
5.2. Submm – Radio
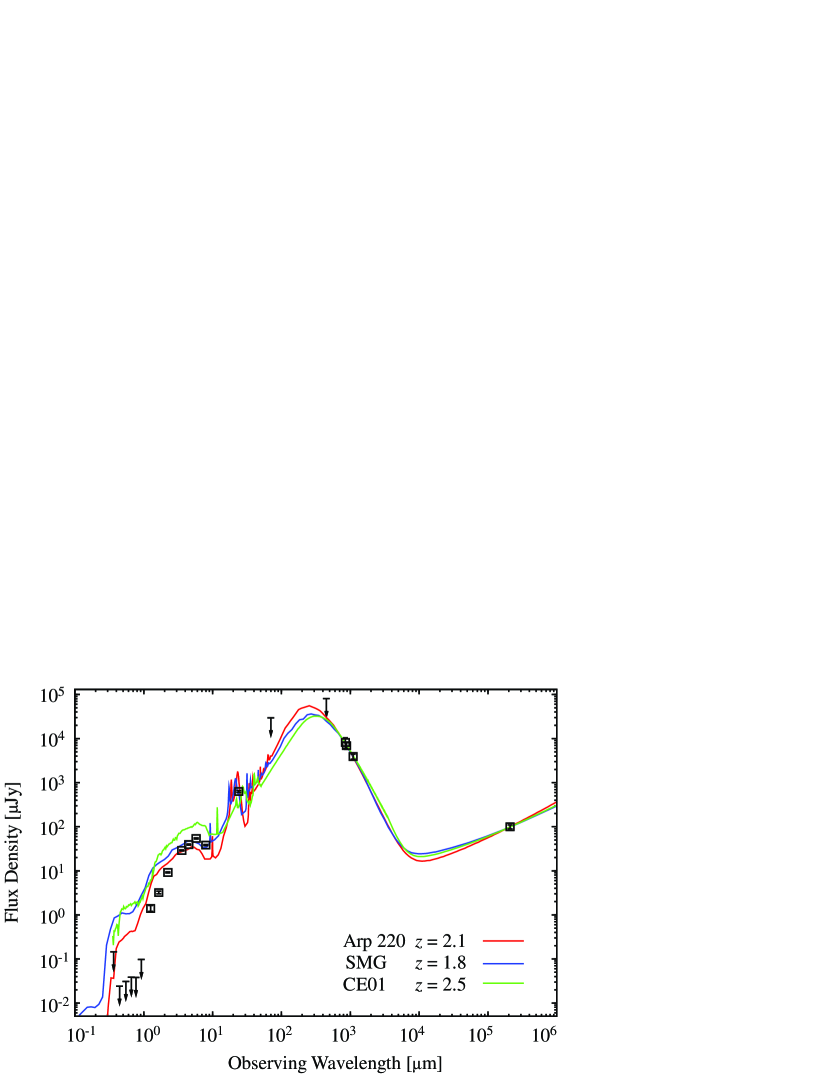
Photometry at 850 , 880 , 1100 , and 21 cm is used for submm-radio SED fits. The MIPS photometry is also used to check for consistency. We use the following starburst SED models: Arp 220 (Silva et al., 1998), the average SED of 76 SMGs with spectroscopic redshifts (Michałowski et al., 2009), and 105 SED models of Chary & Elbaz (2001). We perform minimized fits with free parameters of redshifts and flux scaling factors. We find the best-fit redshifts of for Arp 220 (), for the average SMG (), and for an SED of Chary & Elbaz (2001) (). The errors are 99% confidence intervals. Note that there are other templates in the library of Chary & Elbaz (2001) that fit the photometry data with similar values in the redshift range of –3. The derived redshifts are consistent with the result in the UV-optical-IR SED fit in the previous section. The IR luminosities are estimated to be – from the intrinsic IR luminosities of SED templates multiplied by scaling factors for the best-fit SEDs. The best-fit SED models are shown in Figure 4 with photometry data from UV to radio. All of the SEDs overestimate the UV–NIR photometry, suggesting that stellar emission is heavily attenuated by dust. This is consistent with the large extinction () derived from the UV–optical–IR SED fit. Finally, we note that the SMG sample in Michałowski et al. (2009) is biased against optically faint objects. It is clearly important to take into account a heavily obscured SMG like SXDF 850.6 (or e.g., GOODS 850-5 in Wang et al. 2009, AzTEC1 in Tamura et al. in prep.) to properly understand the overall picture of SMGs.
6. Discussion
6.1. AGN Contribution
The rest-frame 1.6 bump is clearly seen at 5.8 (Figure 3), suggesting that the NIR emission detected in the IRAC bands is star-formation dominated (e.g., Weedman et al., 2006; Farrah et al., 2008). The flatter spectral slope in the IRAC emission compared to AGN populations favours a star formation as a dominant heating source (Yun et al., 2008; Ivison et al., 2004). This is also supported by the fact that SXDF 850.6 appears close to the starburst model tracks in the vs. color-color diagram of Ivison et al. (2004). These facts suggest that SXDF 850.6 favours star formation as a dominant heating source and the physical quantities derived in the SED fit are less affected by the AGN.
The 3 upper limit on the rest-frame X-ray luminosity derived from 0.2–12 keV flux is erg s-1 (assuming and an effective photon index of ). Since this value is not properly corrected for hydrogen attenuation, we do not constrain the AGN contribution from the X-ray luminosity.
6.2. Dust Mass and Molecular Gas Mass
Assuming the observed 880 flux is dominated by thermal dust emission, the dust mass can be derived as (e.g., Hughes et al., 1997), where is the observed flux density, is the rest-frame frequency, is the dust mass absorption coefficient, is the dust temperature, and is the Planck blackbody function. We assume that the absorption coefficient varies as and lies between 1 and 2 (e.g, Hildebrand, 1983). We adopt m2 kg-1, the average value of various studies (Dunne et al., 2003), –50 K, and , the typical values for SMGs (e.g., Kovács et al., 2006; Pope et al., 2006; Coppin et al., 2008; Michałowski et al., 2009). The dust mass is estimated to be = (4–9) for SXDF 850.6 at . This is consistent with previous work on SMGs (e.g., Kovács et al., 2006; Coppin et al., 2008; Michałowski et al., 2009).
By adopting a gas-to-dust mass ratio of 54, which is an average value for SMGs in Kovács et al. (2006), the molecular gas mass is = (2–5) .
6.3. Star Formation Activity and Nature of SXDF 850.6
The UV–IR SED exhibits quiescent star forming activity dominated by old stellar components. The current SFR estimated from the SED fit is approximately zero. This is because the large part of the stellar mass was formed at the early phase of star formation and SFR decreased with time following exponential decay ( Myr for the best-fit SED). On the other hand, the IR luminosity of the best-fit submm–radio SED provides = 1300–4500 (Kennicutt, 1998). The SFR derived from 1.4 GHz radio emission is 1400 following the equation of Bell (2003), and 1100 following Yun & Carilli (2002) (with a spectral index of and a radio–FIR normalization factor of 1).
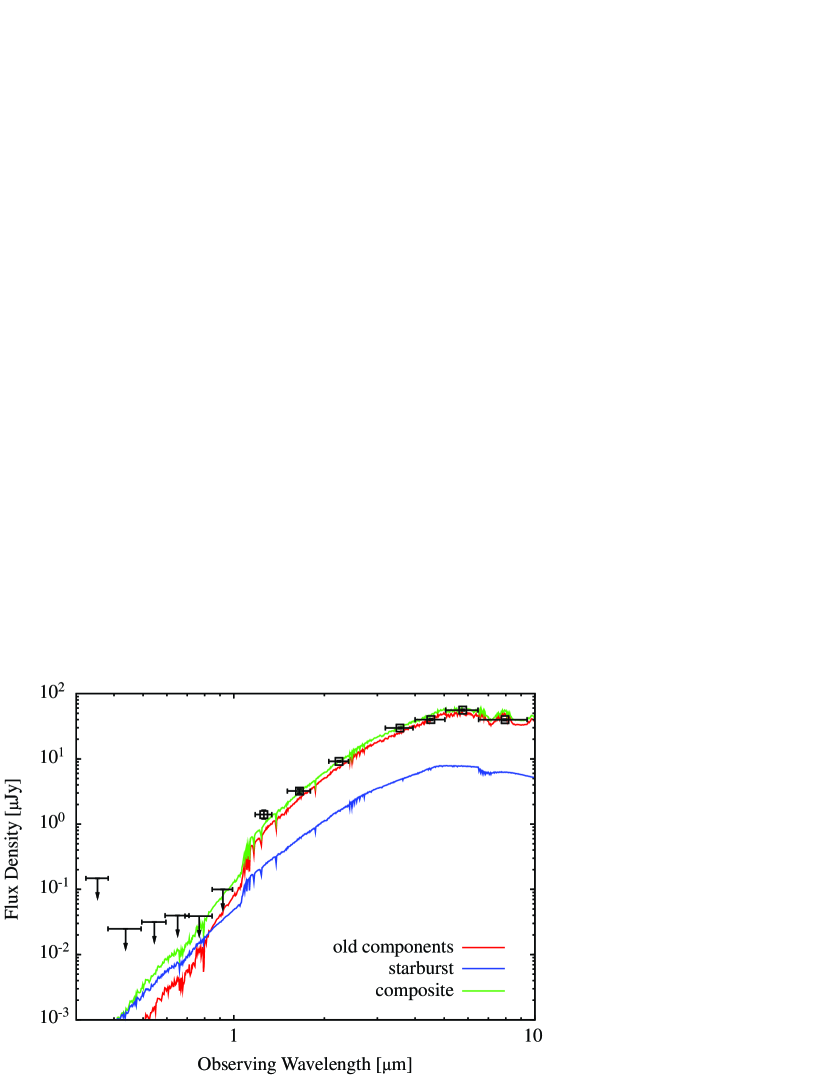
To see whether the observational data allow the coexistence of the old stellar SED with quiescent star formation and the dusty starburst SED, we create synthetic SEDs at UV–IR wavelength using the GALAXEV library. The synthetic SEDs are composites of an SED with the same parameters as the best-fit SED which is dominated by old stellar population and starburst SEDs with different parameters. We find that the composite SEDs with plausible parameters for starburst SEDs (e.g., SFR 2000 , , and age = 1 Myr) are consistent with the photometry data (Figure 5). Note that combining the SEDs increases the total stellar mass by only 1%.
Combining these results allows us to infer the nature of SXDF 850.6: it is a mature system with a large fraction of old stellar components, and currently experiencing a vigorous dusty starburst. The coexistence of old stars and a current starburst in an SMG is suggested by Wang et al. (2009) from a detailed SED analysis. SXDF 850.6 has enough molecular gas mass as estimated in § 6.2 to maintain intense star formation. Such significant star formation is likely caused by major mergers (e.g., Greve et al., 2005; Tacconi et al., 2006, 2008; Narayanan et al., 2009). If the star formation continues with SFR a few , the gas consumption time is a few 10 Myr. This scenario is well described by hydrodynamic simulations of Narayanan et al. (2009) in which a major merger with a dark matter halo produces a peak flux of 7–8 mJy at 850 for a short duration (50 Myr). We are observing the short-lived glow of SXDF 850.6 as a bright SMG. Even if all the molecular gas converts into stars, the total stellar mass will increase by at most 30%. This supports an idea that the large fraction of stellar mass in SMGs is constructed before the current submm bright phase (e.g., Borys et al., 2005; Dye et al., 2008; Michałowski et al., 2009).
The specific star formation rate (SSFR; SFR per unit stellar mass, an estimator of current star-forming activity) of 5–20 Gyr-1 places SXDF 850.6 on the high mass end of the correlation between stellar mass and SFR for star-forming galaxies or above the correlation (e.g., Erb et al., 2006b; Reddy et al., 2006; Daddi et al., 2007). If the large population of stars were constructed before the current starburst phase, the enhancement of star formation could be due to merging of massive star forming galaxies (e.g., merging BzKs; Takagi et al., 2008), and it is possible that this galaxy evolves into a massive present-day elliptical through major merger events (e.g., Lilly et al., 1999; Smail et al., 2004).
7. Summary
We conducted SMA 880 observations of a submillimeter galaxy, SXDF 850.6, detected with SCUBA in the Subaru/XMM-Newton Deep Field, which has multiple radio and IR counterpart candidates. The precise astrometry with the SMA shows that the correct counterpart is the most distant radio source from the SCUBA coordinates. Although there is a lack of a corresponding source at the SMA position in deep images of , , , , , bands, we find a counterpart at , , , 3.6 , 4.5 , 5.8 , 8.0 , 24 , 1100 , and 21 cm. A detailed analysis of fitting a library of synthetic SEDs to the photometry from the -band to 8.0 gives the best-fit parameters of , , mag, and age = Myr. The SED fit to the submm–radio photometry using the three different starburst SED models provides the consistent redshift of –2.5 and – . The IR color diagnostic suggests that the AGN contribution to the SED is small. The SFR derived from the IR luminosity is 1300–4500 , and the SSFR is Gyr-1. If the intense starburst continues, the estimated molecular gas mass of (2–5) will last for a few Myr. Given these facts, it is suggested that SXDF 850.6 is a mature system that already contains a dominant fraction of its expected final stellar mass in an old stellar population, and which is also experiencing a significant starburst. The enhancement of star formation could be due to major mergers.
References
- Alexander et al. (2005) Alexander, D. M., Bauer, F. E., Chapman, S. C., Smail, I., Blain, A. W., Brandt, W. N., & Ivison, R. J. 2005, ApJ, 632, 736
- Austermann et al. (2009) Austermann, J. E., et al. 2009, MNRAS, 393, 1573
- Barger et al. (2000) Barger, A. J., Cowie, L. L., & Richards, E. A. 2000, AJ, 119, 2092
- Barger et al. (1998) Barger, A. J., Cowie, L. L., Sanders, D. B., Fulton, E., Taniguchi, Y., Sato, Y., Kawara, K., & Okuda, H. 1998, Nature, 394, 248
- Bell (2003) Bell, E. F. 2003, ApJ, 586, 794
- Bertin & Arnouts (1996) Bertin, E., & Arnouts, S. 1996, A&AS, 117, 393
- Blain et al. (2002) Blain, A. W., Smail, I., Ivison, R. J., Kneib, J.-P., & Frayer, D. T. 2002, Phys. Rep., 369
- Bolzonella et al. (2000) Bolzonella, M., Miralles, J.-M., & Pelló, R. 2000, A&A, 363, 476
- Borys et al. (2005) Borys, C., Smail, I., Chapman, S. C., Blain, A. W., Alexander, D. M., & Ivison, R. J. 2005, ApJ, 635, 853
- Bruzual & Charlot (2003) Bruzual, G., & Charlot, S. 2003, MNRAS, 344, 1000
- Calzetti et al. (2000) Calzetti, D., Armus, L., Bohlin, R. C., Kinney, A. L., Koornneef, J., & Storchi-Bergmann, T. 2000, ApJ, 533, 682
- Capak et al. (2008) Capak, P., et al. 2008, ApJ, 681, L53
- Chabrier (2003) Chabrier, G. 2003, ApJ, 586, L133
- Chapman et al. (2005) Chapman, S. C., Blain, A. W., Smail, I., & Ivison, R. J. 2005, ApJ, 622, 772
- Chary & Elbaz (2001) Chary, R., & Elbaz, D. 2001, ApJ, 556, 562
- Clements et al. (2008) Clements, D. L., et al. 2008, MNRAS, 387, 247
- Coppin et al. (2006) Coppin, K., et al. 2006, MNRAS, 372, 1621
- Coppin et al. (2008) Coppin, K., et al. 2008, MNRAS, 384, 1597
- Coppin et al. (2009) Coppin, K., et al. 2009, arXiv:0902.4464
- Daddi et al. (2007) Daddi, E., et al. 2007, ApJ, 670, 156
- Daddi et al. (2009) Daddi, E., et al. 2009, ApJ, 694, 1517
- Downes et al. (1986) Downes, A. J. B., Peacock, J. A., Savage, A., & Carrie, D. R. 1986, MNRAS, 218, 31
- Dunne et al. (2003) Dunne, L., Eales, S. A., & Edmunds, M. G. 2003, MNRAS, 341, 589
- Dye et al. (2008) Dye, S., et al. 2008, MNRAS, 386, 1107
- Erb et al. (2006a) Erb, D. K., Steidel, C. C., Shapley, A. E., Pettini, M., Reddy, N. A., & Adelberger, K. L. 2006, ApJ, 646, 107
- Erb et al. (2006b) Erb, D. K., Steidel, C. C., Shapley, A. E., Pettini, M., Reddy, N. A., & Adelberger, K. L. 2006, ApJ, 647, 128
- Ezawa et al. (2008) Ezawa, H., et al. 2008, Proc. SPIE, 7012,
- Ezawa et al. (2004) Ezawa, H., Kawabe, R., Kohno, K., & Yamamoto, S. 2004, Proc. SPIE, 5489, 763
- Farrah et al. (2008) Farrah, D., et al. 2008, ApJ, 677, 957
- Furusawa et al. (2008) Furusawa, H., et al. 2008, ApJS, 176, 1
- Greve et al. (2005) Greve, T. R., et al. 2005, MNRAS, 359, 1165
- Greve et al. (2004) Greve, T. R., Ivison, R. J., Bertoldi, F., Stevens, J. A., Dunlop, J. S., Lutz, D., & Carilli, C. L. 2004, MNRAS, 354, 779
- Hildebrand (1983) Hildebrand, R. H. 1983, QJRAS, 24, 267
- Ho et al. (2004) Ho, P. T. P., Moran, J. M., & Lo, K. Y. 2004, ApJ, 616, L1
- Hughes et al. (1997) Hughes, D. H., Dunlop, J. S., & Rawlings, S. 1997, MNRAS, 289, 766
- Hughes et al. (1998) Hughes, D. H. et al. 1998, Nature, 394, 241
- Iono et al. (2006a) Iono, D., et al. 2006, ApJ, 640, 1
- Iono et al. (2006b) Iono, D., et al. 2006, ApJ, 645, 97
- Ivison et al. (2002) Ivison, R. J., et al. 2002, MNRAS, 337, 1
- Ivison et al. (2004) Ivison, R. J., et al. 2004, ApJS, 154, 124
- Ivison et al. (2005) Ivison, R. J., et al. 2005, MNRAS, 364, 1025
- Ivison et al. (2007) Ivison, R. J., et al. 2007, MNRAS, 380, 199
- Ivison et al. (2008) Ivison, R. J., et al. 2008, MNRAS, 390, 1117
- Ivison et al. (2000) Ivison, R. J., Smail, I., Barger, A. J., Kneib, J.-P., Blain, A. W., Owen, F. N., Kerr, T. H., & Cowie, L. L. 2000, MNRAS, 315, 209
- Ivison et al. (1998) Ivison, R. J., Smail, I., Le Borgne, J.-F., Blain, A. W., Kneib, J.-P., Bezecourt, J., Kerr, T. H., & Davies, J. K. 1998, MNRAS, 298, 583
- Kennicutt (1998) Kennicutt, R. C., Jr. 1998, ARA&A, 36, 189
- Kovács et al. (2006) Kovács, A., Chapman, S. C., Dowell, C. D., Blain, A. W., Ivison, R. J., Smail, I., & Phillips, T. G. 2006, ApJ, 650, 592
- Lacy et al. (2005) Lacy, M., et al. 2005, ApJS, 161, 41
- Lawrence et al. (2007) Lawrence, A., et al. 2007, MNRAS, 379, 1599
- Laurent et al. (2005) Laurent, G. T., et al. 2005, ApJ, 623, 742
- Lilly et al. (1999) Lilly, S. J., Eales, S. A., Gear, W. K. P., Hammer, F., Le Fèvre, O., Crampton, D., Bond, J. R., & Dunne, L. 1999, ApJ, 518, 641
- Michałowski et al. (2009) Michałowski, M. J., Hjorth, J., & Watson, D. 2009, arXiv:0905.4499
- Mortier et al. (2005) Mortier, A. M., et al. 2005, MNRAS, 363, 563
- Narayanan et al. (2009) Narayanan, D., Hayward, C. C., Cox, T. J., Hernquist, L., Jonsson, P., Younger, J. D., & Groves, B. 2009, arXiv:0904.0004
- Neri et al. (2003) Neri, R., et al. 2003, ApJ, 597, L113
- Perera et al. (2008) Perera, T. A., et al. 2008, MNRAS, 391, 1227
- Pope et al. (2006) Pope, A., et al. 2006, MNRAS, 370, 1185
- Reddy et al. (2006) Reddy, N. A., Steidel, C. C., Fadda, D., Yan, L., Pettini, M., Shapley, A. E., Erb, D. K., & Adelberger, K. L. 2006, ApJ, 644, 792
- Sault et al. (1995) Sault, R. J., Teuben, P. J., & Wright, M. C. H. 1995, Astronomical Data Analysis Software and Systems IV, 77, 433
- Scott et al. (2002) Scott et al. 2002, MNRAS, 331, 817
- Scott et al. (2008) Scott, K. S., et al. 2008, MNRAS, 385, 2225
- Scoville et al. (1993) Scoville, N. Z., Carlstrom, J. E., Chandler, C. J., Phillips, J. A., Scott, S. L., Tilanus, R. P. J., & Wang, Z. 1993, PASP, 105, 1482
- Shapley et al. (2005) Shapley, A. E., Steidel, C. C., Erb, D. K., Reddy, N. A., Adelberger, K. L., Pettini, M., Barmby, P., & Huang, J. 2005, ApJ, 626, 698
- Silva et al. (1998) Silva, L., Granato, G. L., Bressan, A., & Danese, L. 1998, ApJ, 509, 103
- Smail et al. (2004) Smail, I., Chapman, S. C., Blain, A. W., & Ivison, R. J. 2004, ApJ, 616, 71
- Smail et al. (2000) Smail, I., Ivison, R. J., Owen, F. N., Blain, A. W., & Kneib, J.-P. 2000, ApJ, 528, 612
- Smail, Ivison & Blain (1997) Smail, I., Ivison, R. J. & Blain, A. W. 1997, ApJ, 490, 5 & Keel, W. C. 2004, ApJ, 617, 64
- Tacconi et al. (2006) Tacconi, L. J., et al. 2006, ApJ, 640, 228
- Tacconi et al. (2008) Tacconi, L. J., et al. 2008, ApJ, 680, 246
- Takagi et al. (2008) Takagi, T., Ono, Y., Shimasaku, K., & Hanami, H. 2008, MNRAS, 389, 775
- Tamura et al. (2009) Tamura, Y., et al. 2009, Nature, 459, 61
- Wagg et al. (2009) Wagg, J., Owen, F., Bertoldi, F., Sawitzki, M., Carilli, C. L., Menten, K. M., & Voss, H. 2009, ApJ, 699, 1843
- Wang et al. (2007) Wang, W.-H., Cowie, L. L., van Saders, J., Barger, A. J., & Williams, J. P. 2007, ApJ, 670, L89
- Wang et al. (2009) Wang, W.-H., Barger, A. J., & Cowie, L. L. 2009, ApJ, 690, 319
- Weedman et al. (2006) Weedman, D., et al. 2006, ApJ, 653, 101
- Wilson et al. (2008) Wilson, G. W., et al. 2008a, MNRAS, 386, 807
- Younger et al. (2007) Younger, J. D., et al. 2007, ApJ, 671, 1531
- Younger et al. (2008) Younger, J. D., et al. 2008, MNRAS, 387, 707
- Yun & Carilli (2002) Yun, M. S., & Carilli, C. L. 2002, ApJ, 568, 88
- Yun et al. (2008) Yun, M. S., et al. 2008, MNRAS, 389, 333