Census of Self-Obscured Massive Stars in Nearby Galaxies with Spitzer:
Implications for Understanding the Progenitors of SN 2008S-Like Transients
Abstract
A new link in the causal mapping between massive stars and potentially fatal explosive transients opened with the 2008 discovery of the dust-obscured progenitors of the luminous outbursts in NGC 6946 and NGC 300. Here we carry out a systematic mid-IR photometric search for massive, luminous, self-obscured stars in four nearby galaxies: M33, NGC 300, M81, and NGC 6946. For detection, we use only the 3.6 m and 4.5 m IRAC bands, as these can still be used for multi-epoch Spitzer surveys of nearby galaxies ( Mpc). We combine familiar PSF and aperture-photometry with an innovative application of image subtraction to catalog the self-obscured massive stars in these galaxies. In particular, we verify that stars analogous to the progenitors of the NGC 6946 (SN 2008S) and NGC 300 transients are truly rare in all four galaxies: their number may be as low as per galaxy at any given moment. This result empirically supports the idea that the dust-enshrouded phase is a very short-lived phenomenon in the lives of many massive stars and that these objects constitute a natural extension of the AGB sequence. We also provide mid-IR catalogs of sources in NGC 300, M81, and NGC 6946.
Subject headings:
supernovae: general, individual (SN 2008S) — galaxies: individual (M33, NGC 300, M81, NGC 6946) — catalogs1. Introduction
The conventionally-understood fate of massive () stars is death by a core collapse that produces a neutron star or black hole, and an outgoing shock wave that successfully ejects the overlying stellar envelope to create a bright Type II or Ib/c supernova (SN). Given the detection of a SN-like optical event, the next challenge is to characterize the progenitor star in order to understand the last years of the life of a massive star. A more direct method for understanding the relation between massive stars and their transients is to simply catalog all the massive stars in the local universe ( Mpc) and then determine their individual fates. This is particularly important because we lack observational constraints on the number of failed SN that form a black hole without a SN-like optical transient (e.g., Kochanek et al. 2008; Smartt et al. 2009), and because the boundary between SN and other luminous transients of massive stars is uncertain (e.g., Chiosi & Maeder 1986; Woosley et al. 2002). While surveys for bright optical transients in the local universe are well-developed (e.g., Li et al. 2001), a complete census of massive stars in nearby galaxies are relatively recent (Massey et al. 2006) and efforts to study their fates have just started (Kochanek et al. 2008). Despite the technical challenges required by the depth, area, and cadence of the observations, these surveys are critical for our understanding of the correspondences between massive stars and their end states. The long-term promise of these surveys is to produce a catalog where the characteristics (luminosity, mass, binarity, winds, etc.) of the progenitors of future SN are listed.
A new link in this causal mapping between massive stars and their explosions opened with the discovery of the dust-obscured progenitors of the luminous outbursts in NGC 6946 (SN 2008S; Arbour & Boles 2008; Prieto et al. 2008) and NGC 300 (hereafter NGC 300-2008OT; Monard 2008; Bond et al. 2009; Botticella et al. 2009) in the mid-IR with Spitzer. In both cases, the progenitor was not detected in the optical, but as a K mid-IR source with luminosity of (Prieto et al. 2008; Prieto 2008) and an implied mass range of (Prieto et al. 2008; Botticella et al. 2009; Berger et al. 2009; Gogarten et al. 2009). The dust temperature and the stringent upper limits on the optical fluxes (Prieto 2008; Botticella et al. 2009; Berger et al. 2009) demonstrated that both objects were enshrouded by a dusty wind. Whether progenitors of some massive star outburst or SN, the fact that these progenitors are completely self-obscured by dust implies that any complete census of the progenitors of luminous transients now requires mid-IR data as well.
In essence, we need a comprehensive survey for bright mid-IR sources in all nearby galaxies ( Mpc) with (warm) Spitzer, analogous to the survey proposed by Kochanek et al. (2008) in the optical. For a first look, Thompson et al. (2009) searched in M33 for deeply-embedded point sources that had similar properties to the progenitors of the transients in terms mid-IR colors, luminosities, and variability in archival Spitzer observations of M33, and detected only 18 sources with any similarity, and even fewer (one or two) as extreme in color and luminosity. They argued that transients such as SN 2008S and NGC 300-2008OT constitute a class of their own and are relatively common (of order % of the SN rate), although the progenitors of this class are extremely rare among a galaxy’s massive stars at a given time. Thus, Thompson et al. (2009) argued that a significant fraction of all massive stars must undergo a dust-enshrouded phase within years prior to some kind of explosion.
Our understanding of the role of dust and variability in the final stages of the evolution of massive stars is surprisingly limited, despite it being a powerful probe of the physics of their last days. The goal of our project is to expand the Thompson et al. (2009) survey to catalog the population of obscured massive stars and to identify the sub-population of massive stars from which these progenitors emerge. We use only the 3.6 m and 4.5 m IRAC bands, as they can be used in a future multi-epoch Spitzer survey of all nearby galaxies ( Mpc) lacking the necessary archival data. We conduct our search in four galaxies: M33 (D Mpc, Bonanos et al. 2006), NGC 300 (D Mpc, Gieren et al. 2005), M81 (D Mpc, Saha et al. 2006), and NGC 6946 (D Mpc, Sahu et al. 2006), so that we can compare our results with Thompson et al. (2009) and test our search method in relatively distant and crowded galaxies, where a novel application of image subtraction helps us overcome the poor spatial resolution of Spitzer compared to the stellar crowding. We will also examine these populations in the LMC and SMC using the published catalogs of Blum et al. (2006) and Bolatto et al. (2007), respectively. These galaxies span a broad range in distance, luminosity, star formation rate (SFR) and metallicity.
The paper is organized as follows. Section 2 describes our methodology for identifying obscured massive stars in nearby galaxies in detail. Section 3 discusses the nature of this stellar population using the color-magnitude diagrams (CMDs) for the galaxies and spectral energy distributions (SEDs) for the individual obscured stars. Section 4 considers the implications of the findings for our understanding of the nature of progenitors of SN 2008S-like transients and the arguments for conducting a multi-epoch survey of all nearby galaxies ( Mpc) with (warm) Spitzer. Also, we provide lists of the obscured massive stars that we identified in the four galaxies, and the mid-IR catalogs of sources in NGC 300, M81, and NGC 6946. The mid-IR catalog of sources in M33 was published in Thompson et al. (2009) (also see McQuinn et al. (2007)).
2. Search for Obscured Massive Stars
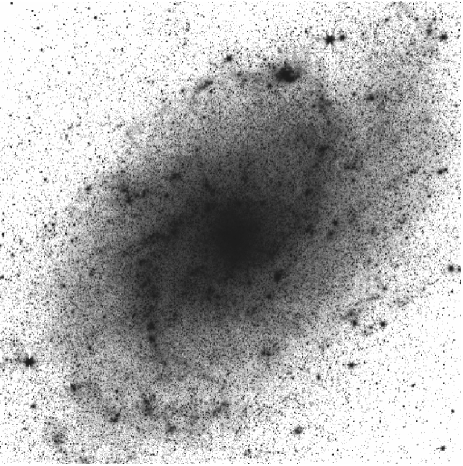
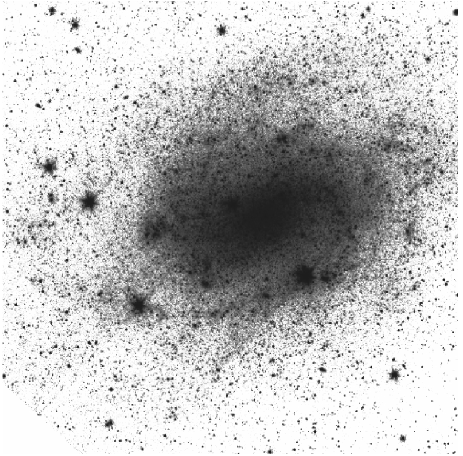
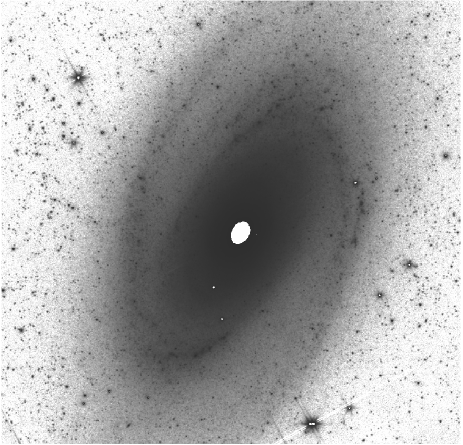
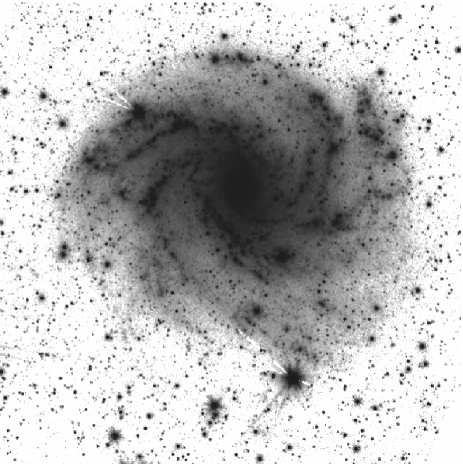
In this section, we describe the methodology of our search for self-obscured massive stars in archival Spitzer IRAC (Fazio et al. 2004) data. Our goal is to carry out this inventory and demonstrate how it can be done despite the crowding problems created by the limited spatial resolution of Spitzer at greater distances. For M33, we used the six co-added epochs of data from McQuinn et al. (2007) that were used by Thompson et al. (2009). For NGC 300, we used the data collected by the Local Volume Legacy (LVL) Survey (Dale et al. 2009). For NGC 6946 and M81 we used the data collected by the SINGS Legacy Survey (Kennicutt et al. 2003). Our images of the galaxies are selected regions of the full mosaics available for each galaxy. The M33 image covers an area of ( pixels, with /pixel), the NGC 300 image covers an area of ( pixels with /pixel), the M81 image covers an area of ( pixels with /pixel), and the NGC 6946 image covers an area of ( pixels with /pixel). Figures show the 4.5 m images of the four galaxies.
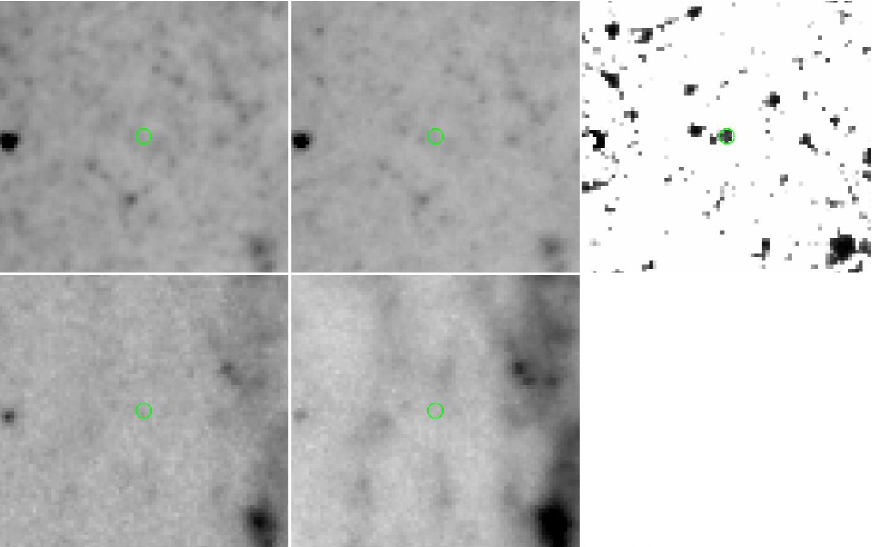
We searched for obscured stars in three stages and order the identified objects by the stage at which we can fully measure the source properties. We use the same criteria of magnitude and magnitude used by Thompson et al. (2009) to select extremely red and bright objects (Extreme Asymptotic Giant Branch or EAGB objects) similar to the SN 2008S and NGC 300-2008OT progenitors. First, we searched for objects directly identifiable in both the 3.6 m and 4.5 m images. Second, we searched for objects detectable at 4.5 m but not at 3.6 m. Finally, in a novel application of difference imaging methods, we searched for obscured stars not directly detectable in either the 3.6 m or 4.5 m IRAC bands. For nearer galaxies, we expect most red sources to be detectable in either or both of the IRAC bands. But for the more distant galaxies, the difference imaging method helps us identify confused sources in crowded images.
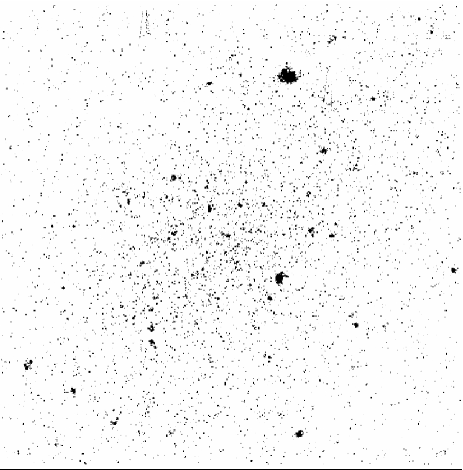
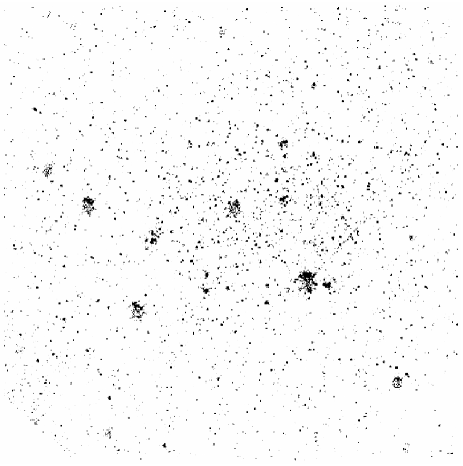
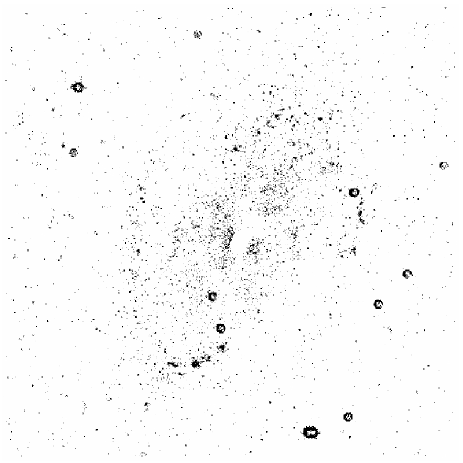
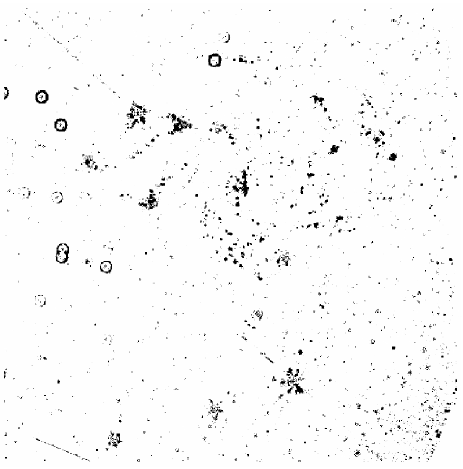
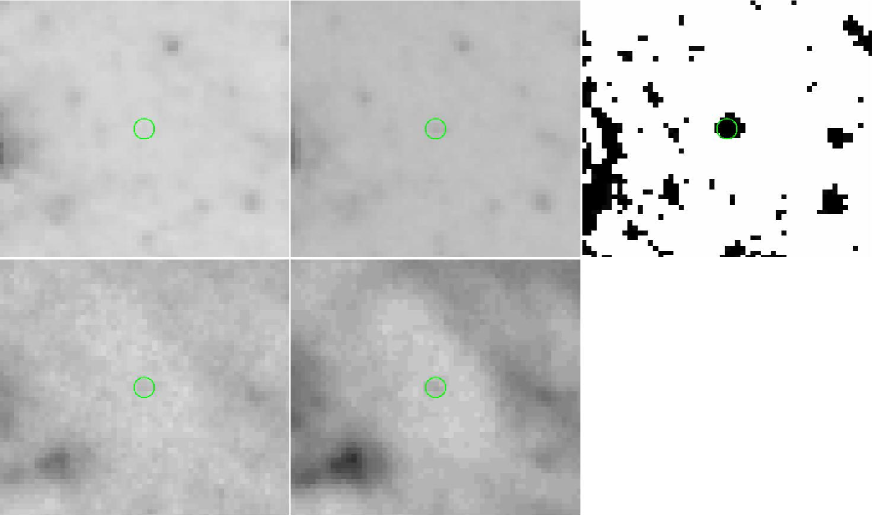
All normal stars have the same mid-IR color (Vega ), because of the Rayleigh-Jeans tails of their spectra. Stars with dusty envelopes lie off the main stellar locus at color 0 towards redder colors. This means that if we use difference imaging methods to match the 3.6 m image to the flux scale and point spread function (PSF) structure of the 4.5 m image and then subtract, all the normal stars “vanish” to leave us only with the stars having significant dust emission. In practice, we use the ISIS image subtraction software package (Alard & Lupton 1998) following the procedures from Hartman et al. (2004). We use the 4.5 m image as the reference from which the 3.6 m image is subtracted. ISIS automatically sets the flux scaling and backgrounds to optimally subtract the two bands, and utilizes a spatially variable kernel to model the PSF differences. Figures show the results of this procedure for our target galaxies. The result is visibly stunning: almost all the stars “vanish” to leave us with a clean image of the red self-obscured stars. Now we can identify and accurately measure positions for red sources that could otherwise be confused due to crowding.
We define objects directly identifiable in both the 3.6 m and 4.5 m bands as Class–A objects. This stage should be most successful for the nearest galaxies, and for sources with significant 3.6 m flux. The procedure followed at this stage is similar to that followed by Thompson et al. (2009), except that we verify the color limits for the candidates. Also, for all objects that are not red enough based on DAOPHOT PSF-fitting methods, we re-estimate the magnitudes and colors through aperture-photometry to ensure that we do not miss any candidate objects due to small measurement variations. Figure 6 shows a Class–A object detected in NGC 300.
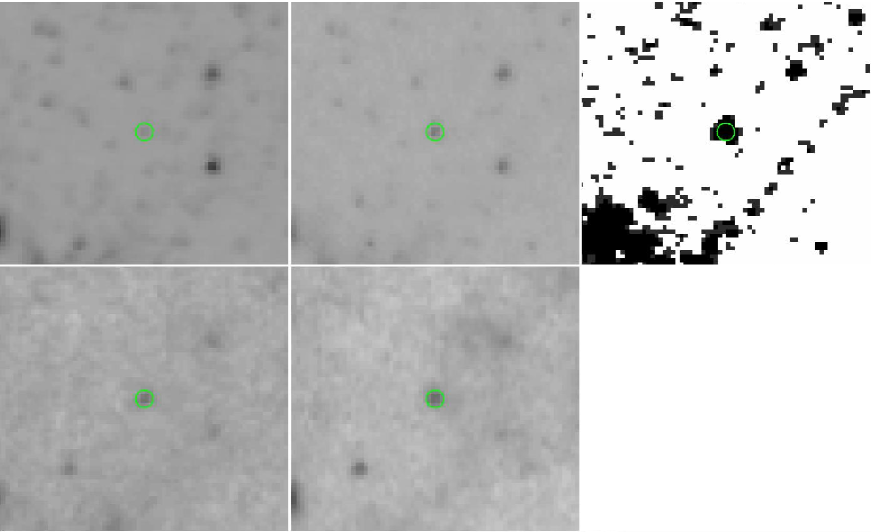
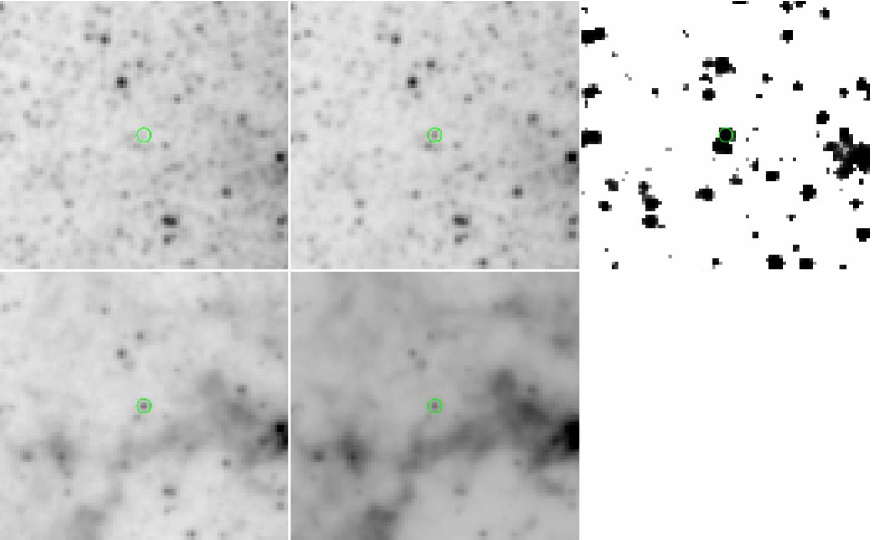
We define objects detectable at 4.5 m but not at 3.6 m as Class–B objects. For point sources that had a detection in the 4.5 m image based on PSF-photometry but lacked a 3.6 m counterpart within a 0.5 pixel matching radius, we used aperture-photometry at the position of the 4.5 m source to estimate or set limits on the 3.6 m magnitude and color (). Figure 6 shows a Class–B object detected in M33.
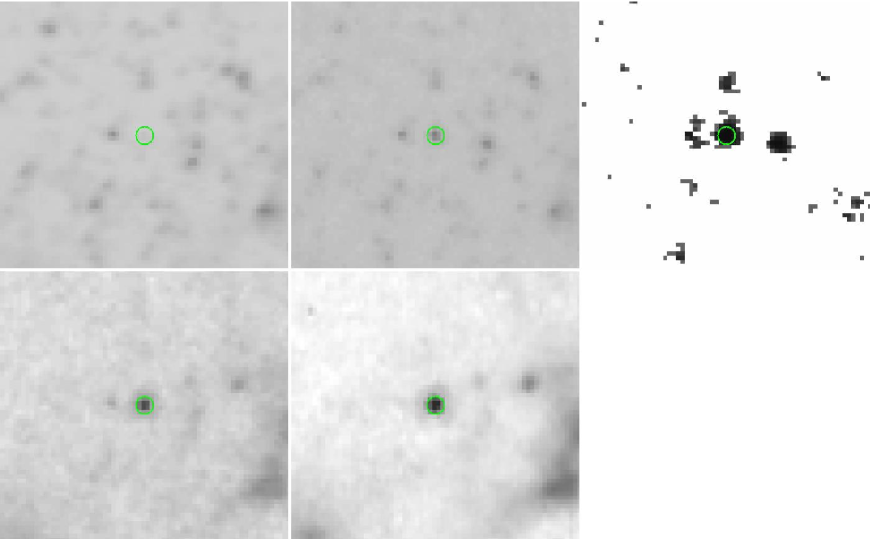
We define objects detectable only in the wavelength differenced image (hereafter the “ image”) as Class–C objects. We used DAOPHOT PSF-fitting to identify sources on the image. For the detected objects lacking a counterpart in the 4.5 m catalog within a 1 pixel matching radius, we use aperture-photometry on both the 3.6 m and 4.5 m images at the source position in the differenced image to estimate magnitudes and colors. Figure 7 shows a Class–C object detected in M81. For comparison, we show the SN 2008S and NGC 300-2008OT in Figures 9 and 9. These are detected as Class–B and Class–A objects, respectively, in our blind searches of NGC 6946 and NGC 300, as described in Section 3.
Given this broad outline, we now describe the specific technical details of how we performed the photometric measurements at the various stages of the search and then verified the properties of the candidates.
We used the DAOPHOT/ALLSTAR PSF-fitting and photometry package (Stetson 1992) to identify point sources in both the 3.6 m and 4.5 m IRAC images. The point source catalogs (Tables 5, 7, and 9) are comprised of those sources detected at at 4.5 m and with a 3.6 m counterpart within 0.5 pixels. We measure the properties of the sources using either DAOPHOT/ALLSTAR to do PSF-photometry or APPHOT/PHOT to do simple aperture-photometry. The PSF-magnitudes obtained with ALLSTAR were transformed to Vega-calibrated magnitudes using aperture corrections derived from bright stars. For aperture-photometry magnitudes, the aperture correction is determined from the Spitzer point response function reference image obtained from the IRAC website111http://ssc.spitzer.caltech.edu/irac/psf.html, and we empirically verified that for bright stars the magnitudes determined through PSF and aperture-photometry agree within magnitude. When performing aperture-photometry, we estimate the local background for each object using APPHOT/PHOT employing a outlier rejection procedure in order to exclude sources located in the local sky annulus, and correct for the excluded pixels assuming a Gaussian background distribution.
For every candidate object, we implement a strict detection criteria. We require a detection at 4.5 m regardless of the search stage at which an object is detected and how its properties are determined (PSF or aperture-photometry). Initially, we determine the limit on using the local background estimated using APPHOT/PHOT. If the estimate of is brighter than the local background limit, then we treat the estimate as the measured flux, otherwise we use the background estimate as an upper limit on the flux. Thus, we get a lower limit on the color of the objects for which we do not have reliable measurements at 3.6 m. This color limit verification is done identically in every stage of the search. Stars for which only limits could be determined are included in the tables and CMDs, but we do not show their SEDs. We visually inspected all candidate red stars in the 3.6 m, 4.5 m, and wavelength differenced images and rejected candidates that do not appear likely to be a star. The differenced images are very useful because they cleanly remove most of the crowding, as is apparent in Figures .
Due to how we organized the search, we first identify candidates that can be detected it at least one of the 3.6 m and 4.5 m images before searching for additional objects in the differenced image. Most of the Class–A and the Class–B objects are detected independently in the image as well, and the Class–C objects represent only the additional sources that can be hidden by crowding, especially in the more distant galaxies. The progenitor of SN 2008S is an excellent example: although we identified it in NGC 6946 as a Class–B object, Figure 9 makes it clear that had we missed it at 4.5 m, it would be detected without any confusion as a Class–C object. There was a tendency for DAOPHOT to split objects detected in the images, presumably due to the non-standard statistical properties of these images. Generally there was a primary, true detection and a secondary detection offset by roughly a pixel. These off-center detections represented the major source of false-positives for the Class C objects, and we systematically rejected these duplicate detections.
3. Inventory of Obscured Massive Stars
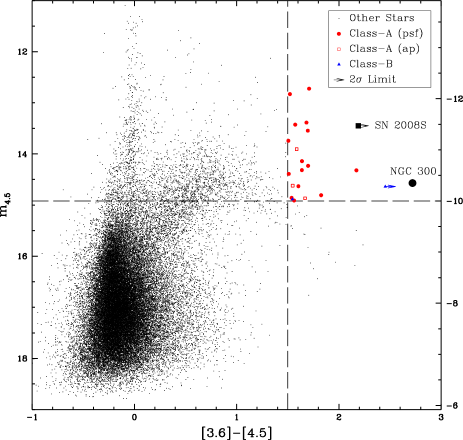
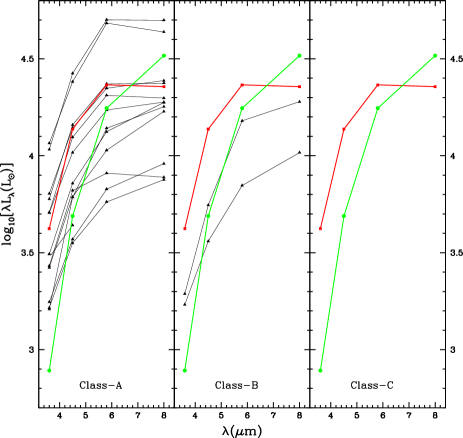
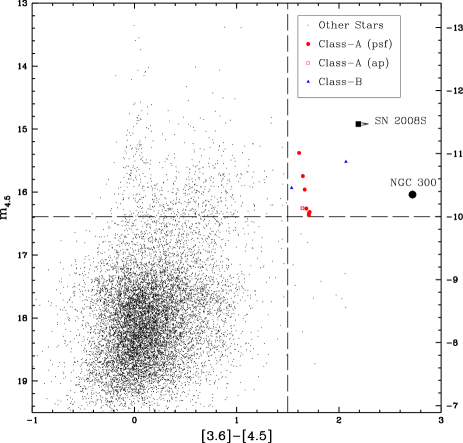
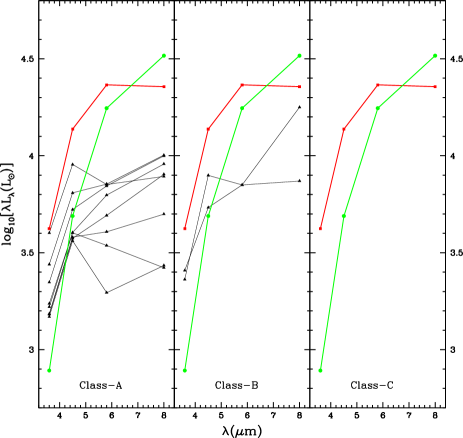
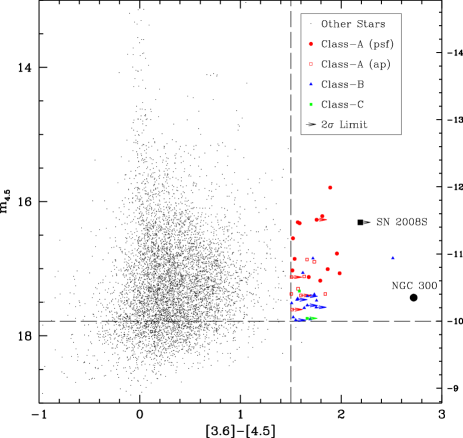
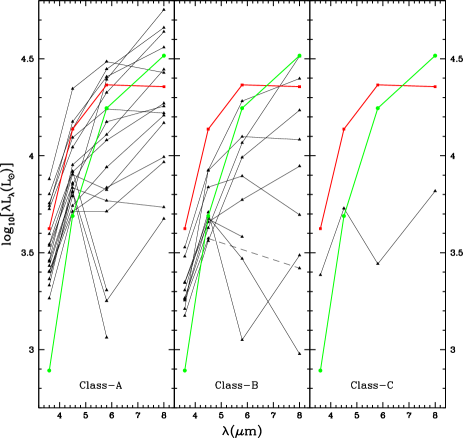
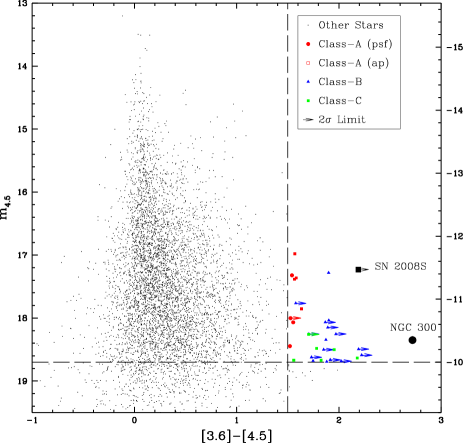
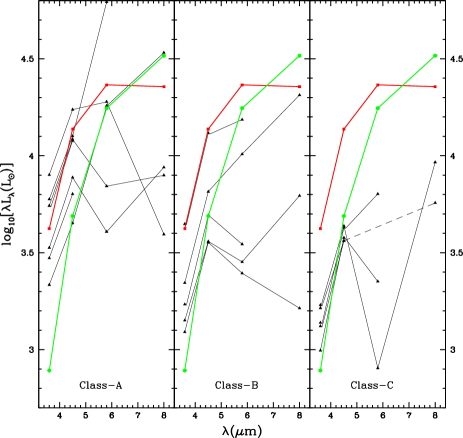
Figures present the versus CMDs for each galaxy. For comparison, we include the progenitors of NGC 300-2008OT and SN 2008S (Prieto et al. 2008; Prieto 2008) as well as the and selection region for extremely red and bright objects. The candidates that meet this criteria are shown with symbols indicating the stage of the search at which they were identified. Where applicable, color limits are indicated by arrows. Figures also present the mid-IR SEDs of the candidate objects as compared to the SEDs of the SN 2008S and NGC 300 transient progenitors. Here we include the 5.8 m and 8.0 m fluxes as determined using aperture-photometry for the position of the 4.5 m source. Due to significant PAH emissions in these two bands, we view the aperture-photometry measurements in these bands as less reliable. The SEDs of some fainter sources show a sharp decline at 5.8 m before rising again at 8.0 m due to PAH dominated background contamination. Figure 14 shows a summary of the CMDs of these four galaxies as well as those for the LMC and SMC from Blum et al. (2006) and Bolatto et al. (2007), respectively. Figure 15 shows the spatial distribution of the sources. All the objects identified at both 3.6 m and 4.5 m with DAOPHOT are reported in Tables 6, 8, and 10 for NGC 300, M81, and NGC 6946 respectively. Since Thompson et al. (2009) published a source catalog for M33, we do not publish a new catalog for this galaxy. In this section, we discuss the results of our search for obscured massive stars in each of the targeted galaxies. Lists of the candidates are presented in Tables LABEL:table:m33_red, LABEL:table:ngc300_red, LABEL:table:m81_red, and LABEL:table:ngc6946_red, sorted by the stage at which we measured the source properties (Class–A objects first, followed by Class–B objects and then Class–C objects), for all four galaxies.
3.1. M33
We first discuss our analysis of M33 (D Mpc, Bonanos et al. 2006), the nearest of the targeted galaxies, using our improved methods. Initially, we identify 15 Class–A objects based on PSF-photometry exactly following the procedures of Thompson et al. (2009) except where we estimate the color limits. We identify 4 additional Class–A objects through aperture-photometry, as well as 3 Class–B objects and 1 Class–C object. On visual inspection, we reject 1 object in each class, leaving 20 candidates. These objects include 12 of the 18 stars identified by Thompson et al. (2009) as self-obscured EAGBs. For one of these objects (Class–B), we could only determine a color limit. The only Class–C object was rejected as a duplicate detection of one of the Class–A objects. Table LABEL:table:m33_red presents the candidate EAGB sources. See Table 1 in Thompson et al. (2009) for the mid-IR point source catalog.
Of the 6 stars in Thompson et al. (2009) that were not identified in our present census as candidates, 5 are actually found in our search (3 in the first stage, 1 in the second stage, 1 in the third stage), but they are all located close to the color and magnitude selection boundaries, and small shifts in the color and magnitude estimates excluded them from the sample. The only object among the 18 that we missed entirely lay outside our search region, which is slightly different from that of Thompson et al. (2009). Only 1 source, the same in both searches, is brighter than the NGC 300 transient progenitor and redder than the SN 2008S progenitor color limit.
3.2. NGC 300
As the host of one of the optical transients, NGC 300-2008OT (D Mpc, Gieren et al. 2005) is of particular interest. Initially, we identify 8 Class–A objects based on PSF-photometry only (including the NGC 300-2008OT progenitor, as shown in Figure 9), 1 additional Class–A object through aperture-photometry, 2 Class–B objects, and 4 Class–C objects. However, all 4 Class–C objects were rejected as duplicate detections of Class–A/B objects. Overall, we found 10 candidate objects in NGC 300 apart from the transient progenitor. The color determined for each of these 10 objects is above the local background limit and none of them is brighter than the NGC 300-2008OT progenitor and redder than the SN 2008S progenitor color limit. Table 6 provides a catalog of the 11,241 sources identified in both bands, and Table LABEL:table:ngc300_red lists the candidate EAGB sources. We estimate the NGC 300-2008OT progenitor properties to be , , and which agrees with the previous measurement of , , and (Prieto 2008).
3.3. M81
As a large, nearby, nearly face-on spiral galaxy at an intermediate distance (more distant than NGC 300 and closer than NGC 6946), M81 (D Mpc, Saha et al. 2006) was chosen as a test case for our improved search method. Initially, we identify 15 Class–A objects through PSF-photometry only, 9 additional Class–A objects through aperture-photometry, 15 Class–B objects, and 3 Class–C objects. However, on visual inspection, we rejected 2 Class–A objects and 1 Class–C object, leaving 39 candidates, of which only 1 object is brighter than the NGC 300-2008OT progenitor and redder than the SN 2008S progenitor color limit. For 9 of these objects we could only determine a color limit (4 Class–A, 4 Class–B, 1 Class–C). Table 8 provides a catalog of the 6,021 sources identified in both bands, and Table LABEL:table:m81_red lists the candidate EAGB sources.
3.4. NGC 6946
The host of the SN 2008S event, NGC 6946 (D Mpc, Sahu et al. 2006) is the most distant of the four galaxies. At this distance, the absolute magnitude limit is close to the detection limit at 4.5 m, leading to reduced completeness. The 4.5 m SINGS archival image of NGC 6946 contains many artifacts that significantly affect the subtracted image. For example, bright stars show bright “halos” in the 4.5 m image that appear as rings in the subtracted image. As a result, most of the candidates identified in the second and third stages did not pass the visual inspection because they were clearly associated with artifacts.
Initially, we identify 5 Class–A objects through PSF-photometry only, 5 additional Class–A objects through aperture-photometry, 38 Class–B objects (including the SN 2008S progenitor), and 32 Class–C objects. On visual inspection, we rejected 2 Class–A objects, 21 Class–B objects, and 26 Class–C objects, leaving 30 candidates apart from the SN 2008S progenitor. None of these new sources are redder than this progenitor’s color limit and brighter than the NGC 300 transient progenitor. For 13 of these objects we could only determine a color limit (1 Class–A, 11 Class–B, 1 Class–C). Table 10 provides a catalog of the 5,601 sources identified in both bands, and Table LABEL:table:ngc6946_red lists the candidate EAGB sources.
One of the rejected candidates is a slightly shifted duplicate detection of the SN 2008S event progenitor star. We were unable to determine if there might be multiple stellar objects blended together at the image location. This can be further probed in future mid-IR observations of this galaxy using (warm) Spitzer. We estimate the SN 2008S progenitor properties to be , , and which agrees with the previous measurement of , , and (Prieto et al. 2008).
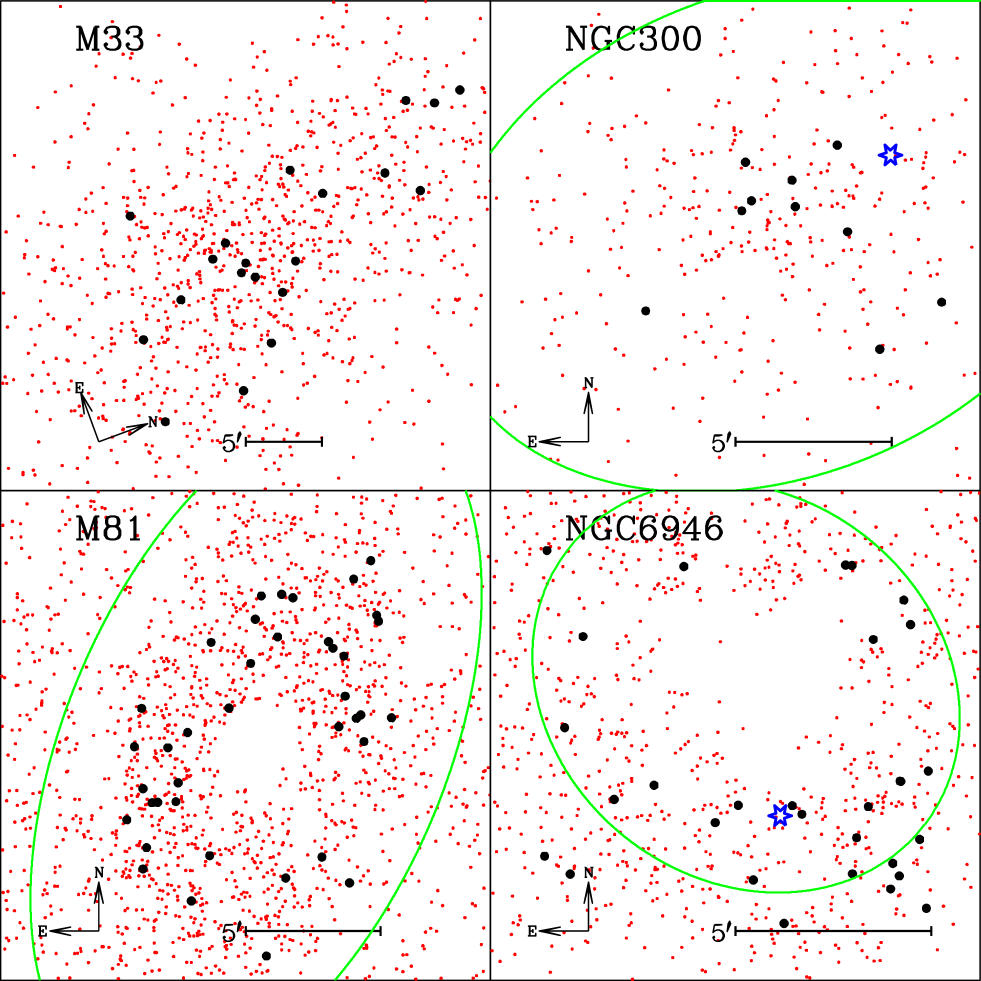
The spatial distribution of AGB and EAGB stars in NGC 6946 is very different from that of the other three galaxies (see Figure 15). The absence of these stars near the center of NGC 6946 is real, unlike M81 where we mask the saturated galactic center. The EAGB candidates also lie on the periphery of the galaxy near the isophotal radius. Brighter and redder EAGBs are relatively easier to identify through our improved search method even if they were initially missed due to blending, and it is highly unlikely that a significant number of EAGB objects in the inner region of NGC 6946 were missed. This suggests that the spatial pattern of the star formation history of NGC 6946 is quite different from the other three galaxies.
4. Discussion
The two supernova-like transient events observed in NGC 300 and NGC 6946 were fairly luminous, and the mid-IR properties of the progenitors of both transients indicate the presence of a dusty, warm, optically thick wind around the progenitors (Prieto et al. 2008; Thompson et al. 2009; Botticella et al. 2009; Prieto et al. 2009; Wesson et al. 2009). The extremely red colors of the progenitors can only be explained by total self-obscuration resulting from a period of circumstellar dust production. Our search for analogs of these progenitors gives us the opportunity to empirically investigate the nature and origin of such objects. In this section, we discuss the implications of our findings. For this discussion, we include the statistics for the LMC and SMC using the catalogs from the full survey of the LMC by Blum et al. (2006) and the partial survey of the SMC by Bolatto et al. (2007). Table LABEL:table:mc_red lists the candidate EAGB sources in the LMC and SMC.
First, we attempt to characterize the detected EAGB population of the target galaxies. Next, we consider how our results may help improve our understanding of the late-stage evolution of massive stars. Finally, we motivate a multi-epoch mid-IR survey of nearby galaxies to produce a complete list of potential progenitors of future supernova like transient events.
4.1. The EAGB Population
Although the exact number of analogs of the SN 2008S and NGC 300-2008OT progenitors () in these four galaxies is uncertain due to the absence of absolute quantitative criteria to identify such objects, it is clear that objects as bright and red as these progenitors are extremely rare. Following a conservative selection criteria of requiring the objects to be very red () and bright () produces a sample size on the order of tens of candidates per galaxy. However, following the strictest criteria of requiring the candidates to be brighter than the NGC 300-2008OT progenitor and redder than the SN 2008S event progenitor color limit, we would select no more than 1 candidate object in the LMC, M33 and M81, none in the SMC, and none other than the 2008 transient progenitors in NGC 300 and NGC 6946. Taking measurement uncertainties into account can increase the number of objects per galaxy meeting the strictest criteria by at most 1 more in the LMC, M33, and NGC 300, 0 more in the SMC and M81, and 3 more in NGC 6946.
Simple black-body fits of the EAGB SEDs with an assumed dust emissivity function going as show that almost all these objects have a bolometric luminosity of and photospheric temperatures of . This indicates that these are very massive stars embedded in dusty winds, with luminosities and temperatures very similar to those of the 2008 supernova-like transient progenitors.
To examine the contamination of the EAGB region of the CMD by non-EAGB objects, we took a closer look at the LMC objects which satisfy the and criteria. The reddest object at is the IRAS source, IRAS 05346-6949 (Elias et al. 1986), which has been classified as an “Extremely Red Object” (ERO) in Gruendl & Chu (2009). It is believed to be an enshrouded supergiant which is not bright in the optical. There are IRS spectra for 13 objects in this (ERO) class, although they are all less luminous () than the 2008 transient progenitors, and 7 of them are carbon stars (Gruendl et al. 2008). If such contamination is common, then analogs of SN 2008S and NGC 300-2008OT transient progenitors may be even rarer than our conservative estimates.
To determine the fraction of massive stars in these galaxies that are analogous to the SN 2008S and NGC 300 transient progenitors, we first estimate the total number of massive stars in each galaxy by scaling the Thompson et al. (2009) estimate of the number of RSG stars () in M33. We scale the number using the B-band luminosity estimates from Karachentsev et al. (2004), and find that the fraction is always on the order of . The constancy of this ratio means that our efficiency at finding them is nearly constant over a wide distance range, and that very few of the massive stars in any one galaxy at any moment have mid-IR colors and brightnesses comparable to those of the SN 2008S and NGC 300-2008OT progenitors. Table 3 shows the estimated EAGB counts as a fraction of massive stars in the six galaxies that we studied. The lower fractions in M81 and NGC 6946 are likely real rather than a completeness problem. For the SMC we only have a lower bound on , , and the ratio relative to M33 because the survey of the SMC covered only part of the galaxy.
| Galaxy | Luminosity | Ratio | ||||||||||
|---|---|---|---|---|---|---|---|---|---|---|---|---|
| Ratio to M33 | to M33 | |||||||||||
| LMC | 9 | 0.4 | 1.11 | |||||||||
| SMC | 0.1 | |||||||||||
| M33 | 20 | |||||||||||
| NGC 300 | 10 | 0.4 | 1.24 | |||||||||
| M81 | 39 | 7.5 | 0.27 | |||||||||
| NGC 6946 | 30 | 6.3 | 0.24 |
| Galaxy | with | Background | Ratio | |||||||||
|---|---|---|---|---|---|---|---|---|---|---|---|---|
| Contamination | Contamination | to M33 | ||||||||||
| LMC | 9 | 400 | 400 | 0.02 | 1.0 | |||||||
| SMC | 30 | 30 | 0.03 | 1.5 | ||||||||
| M33 | 20 | 1000 | 30 | 970 | 0.02 | |||||||
| NGC 300 | 10 | 330 | 80 | 250 | 0.04 | 2.0 | ||||||
| M81 | 39 | 1310 | 510 | 800 | 0.05 | 2.5 | ||||||
| NGC 6946 | 30 | 470 | 260 | 210 | 0.14 | 7.0 |
| Galaxy | logaaEstimates from Kennicutt et al. (2008) scaled for distances used in this paper. | SFR (H)bbEstimated using Equation 2 of Lee et al. (2009). | SFR (H) | |||||||
|---|---|---|---|---|---|---|---|---|---|---|
| Ratio to M33 | (erg/s) | /yr | Ratio to M33 | |||||||
| LMC | 9 | 0.5 | 40.5 | 0.24 | 0.7 | |||||
| SMC | 39.7 | 0.04 | 0.1 | |||||||
| M33 | 20 | 40.6 | 0.33 | |||||||
| NGC 300 | 10 | 0.5 | 40.2 | 0.13 | 0.4 | |||||
| M81 | 39 | 2.0 | 40.8 | 0.46 | 1.4 | |||||
| NGC 6946 | 30 | 1.5 | 41.4 | 2.05 | 6.3 |
Thompson et al. (2009) proposed that the very red and bright candidates are the most massive AGB stars in a late stage of evolution and thus constitute a natural extension of the AGB branch. Under this assumption, the ratio of the number of EAGB and massive AGB stars in a galaxy at a given time should depend on the star formation history of the galaxy, since the lifetime of stars spans Myr–Gyr. Based on the structure of the M33 CMD and the detection limits for the more distant galaxies, we used the criteria of
| (1) |
and
| (2) |
to select the bulk of the AGB sequence while minimizing the effects of incompleteness for the more distant galaxies. We also required that the objects lie within the isophotal radius of the galaxies (see Figure 15).
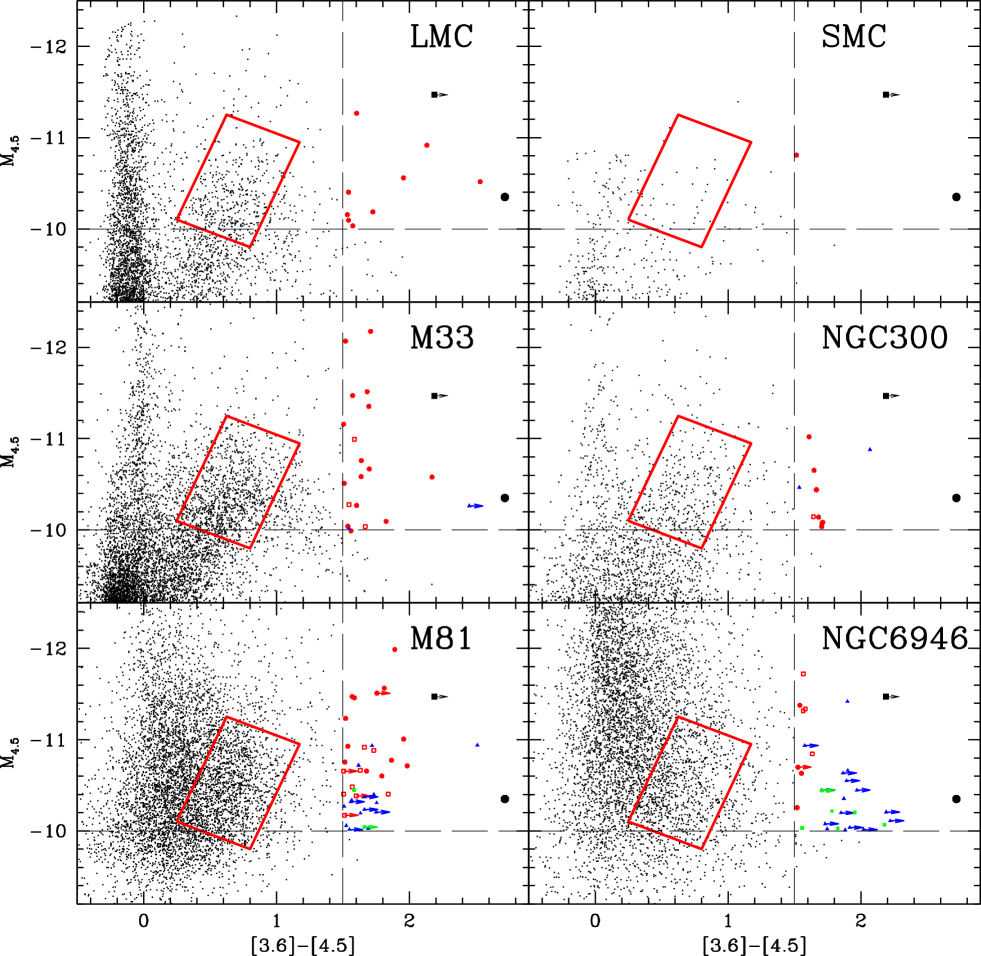
Figure 14 shows the CMDs zoomed in to highlight the AGB and EAGB stars, and Figure 15 shows the sky distribution of the luminous red AGB and EAGB candidate objects. The small number of bright objects in the SMC CMD is largely due to the survey (Bolatto et al. 2007) covering only portions of the SMC. While we can clearly see the AGB sequence in M33 and NGC 300, contamination by extragalactic sources is a problem for M81 and NGC 6946. We correct for this contamination using the 10 square degree Spitzer Deep Wide Field Survey (SDWFS, Ashby et al. 2009). While there is no significant extragalactic contamination to the EAGB sources, Table 3 shows that the contamination correction to the AGB sample is important. We ignore the possibility of foreground contamination of the AGB region given the rarity of luminous AGB stars in our galaxy and our small fields of view.
The ratios of the numbers of EAGB to luminous red AGB stars, in the LMC, SMC, and the four galaxies that we studied, are , , , , , and , respectively. There is worrisome trend in the ratios with increasing distance. It may be partly due to decreasing completeness of the AGB population relative to that for the EAGB population with increasing distance. The AGB candidates are selected from the catalog of mid-IR sources that are detected in both 3.6 m and 4.5 m, and for galaxies at greater distances we are losing AGB stars at the bottom of our selection box and potentially overestimating the extragalactic contamination. This can lead us to over-subtract the contamination and underestimate . On the other hand, the EAGB candidates are detected using our improved methods, and thus include objects detected only at 4.5 m or in the differenced image as well as those detected in both IRAC bands. This allows us to detect EAGB candidates that would otherwise be missed due to crowding and thus makes our EAGB count relatively more complete at greater distances when compared to the completeness of the AGB star count.
Table 3 summarizes the EAGB counts as fraction of AGB stars. If all these galaxies had the same relative star formation history, the ratio should be identical for all galaxies given fixed completeness. Alternatively, the various steps we used for finding the EAGB stars are improving our completeness for EAGB stars at the distance of NGC 6946 by a factor of . This may well be the case, since if we only used the DAOPHOT catalog of this galaxy, we would find only 4 EAGB candidates instead of 30. Thus, for NGC 6946 and to a lesser extent M81, our completeness for AGB stars is limited by the shallow depth of the SINGS observations.
Next we investigate whether the numbers of EAGB candidates correlate with the current SFR of these galaxies. We use the estimates from Kennicutt et al. (2008) and estimate the SFR using the results from Lee et al. (2009). There may be a weak correlation between and SFR (H), although the correlation clearly does not hold for NGC 6946. The discrepancy in this case is severe, and corresponds to finding only of the EAGB stars if viewed as a completeness problem. It seems more likely that the correlation is coincidental and that the EAGB stars must generally be less massive than the stars responsible for the emissions.
The EAGB candidate objects are expected to be very faint in the optical even if an optical counterpart exists. As such, we need very deep optical catalogs to search for optical counterparts. Of the four galaxies that we studied, only M33 has a publicly available deep optical catalog. Thompson et al. (2009) reported that no optical counterparts of the M33 EAGB candidate sources was found.
4.2. Understanding the Evolution of Massive Stars
As discussed in Thompson et al. (2009), there are three classes of explanations for the two transient events detected in 2008: explosive white dwarf formation, low-luminosity supernova (normal Fe core or electron capture SN), or a massive star transient. Prieto et al. (2008) and Thompson et al. (2009) argue for the electron capture SN interpretation, and this is supported by Botticella et al. (2009). Pumo et al. (2009) argue for this scenario using a parametric approach, demonstrating that such supernovae can be explained in terms of electron capture SN from super-AGB progenitors. Prieto et al. (2009) also found that the mid-IR spectra of the outburst resembled that of a proto-planetary nebula rather than a massive star outburst. Kashi et al. (2010) suggest that a mass transfer episode from an extreme asymptotic giant branch star to a main sequence companion powered NGC 3002008-OT. Smith et al. (2009a) and Bond et al. (2009) argue for a massive star outburst because of the optical spectra of the transients, but Prieto et al. (2008) note that such optical spectral characteristics are also found in proto-planetary nebula. Smith et al. (2009b) suggest that the two transient events are possibly linked to LBV eruptions, and are similar to SN 2009ip and the 2009 optical transient in UGC 2773. However, both of these events discovered in 2009 have optically luminous progenitors, unlike the progenitors of SN 2008S and NGC 300-2008OT. Bonanos et al. (2009) suggested that objects similar to the two 2008 transient progenitors are related to supergiant Be stars. However, whether a link between LBVs and sgBe stars exists is not known at this point.
While the nature of the two 2008 transient progenitors remains debated, our search for analogs of such objects has now empirically shown that such extremely red and luminous objects are truly rare. We estimate this number to be on the order of few tens per large galaxy, but it can be as low as if selected by the strictest criteria of requiring the objects to be brighter than the NGC 300 transient progenitor and redder than the SN 2008S progenitor. Thompson et al. (2009) estimated the duration of the dust obscured phase of EAGB stars to be on the order of years, a time scale very similar to that of the onset of carbon burning in relatively low mass massive stars.
Late stage evolution of stars in this mass range, around , is very difficult to model (e.g., Miyaji et al. 1980; Siess 2007; Poelarends et al. 2008). Pumo et al. (2009) argue that for very rapid mass loss rates, a completely self-obscuring shell can even be produced on the order of years prior to an electron capture SN explosion. Such an ultra-short duration for the dust obscured phase would make it surprising to find any true analogs of the SN 2008S or NGC 3002008OT progenitors in our small sample of galaxies.
We cannot definitively claim that any of our EAGB candidates are truly analogous to the two 2008 transient progenitors. However, we have empirically shown that even using relatively shallow archival data for relatively distant galaxies, we can successfully identify the dusty self-obscured stellar population. Using a combination of conventional PSF and aperture-photometry methods along with innovative use of difference imaging methods, we can overcome crowding issues for galaxies at greater distances as well. If another SN 2008S like transient is to occur in these galaxies, it is likely to be one of the sources we identified here. While the ordering of our search from very conventional (Class–A) to unconventional (Class–C) appears to suggest that the wavelength-differenced approach is of limited use, it is in fact very valuable for confirming candidates and becomes increasingly effective at greater distances. It is important when using it to note the manner in which the resulting changes in image statistics somewhat confuse standard source identification codes.
This study is also a significant expansion of the sample of galaxies with detailed mid-IR stellar catalogs. Previously, full catalogs existed only for the LMC (Blum et al. 2006) and M33 (McQuinn et al. 2007; Thompson et al. 2009), with partial catalogs for the SMC (Bolatto et al. 2007) and M31 (Mould et al. 2008). Our new catalogs can be used to study various stellar populations in nearby galaxies over a wide range of distances. We have also demonstrated that an innovative application of difference imaging can be used to remove crowding confusion for distant galaxies when searching for objects with significant color excesses. The improved data analysis method used in this study can be applied to study other stellar populations as well.
4.3. Motivations for Future Observations
Significant uncertainties regarding the nature of these transient events and their progenitors remain. A simple step is to determine whether the SN 2008S or NGC 300-2008OT progenitors survived their transients. The transient light curves have now likely faded, based on the Botticella et al. (2009) and Bond et al. (2009) light-curves, to the point where the continued existence of a progenitor can be observed, although this will likely require Spitzer observations to constrain a return to a self-obscured phase if optical and near-IR searches fail. Another important step is to properly survey the AGB/EAGB populations of all nearby ( Mpc) galaxies. Such a survey would have two goals. First, it would detect and characterize the progenitors of any future, similar events, and generally constrain the fraction of supernovae and massive star transients associated with self-obscured phases of stellar evolution more systematically. Kochanek et al. (2008) and Smartt et al. (2009) point out that there is a deficit of massive SN progenitors. One solution would be to obscure the progenitors and such Spitzer searches will greatly help to constrain this possibility, albeit only for self-obscured sources as compared to stars behind dense foreground dust. Second, it would characterize these phases of stellar evolution more generally, particularly since treatments of the AGB phase are an increasingly important problem in models of galaxy evolution (e.g., Marcillac et al. 2006; Santini et al. 2009; Conroy et al. 2010). Given catalogs of the AGB stars in galaxies with a broad range of physical properties, the scaling of AGB stars and their mid-IR emission due to dust absorption could be empirically calibrated as a function of galaxy star formation rates and metallicity.
For the more distant galaxies, M81 and NGC 6946, we relied on the SINGS observations, which were not designed to characterize individual stars. As a result, they are shallower than desired for this purpose. For example, the observational depth makes it difficult to count the AGB stars in these galaxies reliably and to properly control for contamination by extragalactic sources. We emphasize that source confusion for fully self-obscured stars is not a primary limitation and can be overcome even in the more distant galaxies using our new analysis methods based on difference imaging between the 3.6 m and 4.5 m wavelengths.
A particularly attractive approach to obtaining such deeper catalogs is to carry out the observations as part of a sparse variability survey. Little is known about mid-IR variability of such rare, massive stars, and the variability provides another means of identifying AGB stars in the presence of confusion, again through the use of difference imaging. In Thompson et al. (2009), for example, we found that variability increased along the AGB sequence except for the small population of EAGB stars, but the statistics were so limited that it was hard to draw general conclusions.
5. Conclusions
We carried out a systematic mid-IR photometric search for massive, luminous, self-obscured stars in four nearby galaxies combined with existing data for the LMC and SMC. We use a combination of conventional PSF and aperture-photometry techniques along with an innovative application of image subtraction. We investigate the population of SN 2008S-like transient event progenitor analogs in these 6 galaxies. We report catalogs of mid-IR sources in three new galaxies (NGC 300, M81, and NGC 6946) and candidate extreme AGB stars in all 6.
Using our methods, bright and red extreme AGB stars can be inventoried to Mpc despite Spitzer’s relatively poor angular resolution. The biggest current problem is that the archival data is insufficiently deep: even with our innovative “band-subtraction” technique, we simply need more photons to detect these extremely red stars in the more distant galaxies. A future multi-epoch survey using (warm) Spitzer could identify all EAGB candidates in nearby galaxies, characterize their variability, and pin down the contribution of these partly obscured stars to galaxy SEDs as a function of wavelength.
Finally, we again emphasize the point made by Thompson et al. (2009). Stars analogous to the progenitors of the SN 2008S and the NGC 300 transients are truly rare in all galaxies. At any moment there appears to be only true analog, and up to given a more liberal selection criterion, per galaxy. While completeness problems due to the limited depth of the archival data make it impossible to give exact scalings, they represent roughly of the red super giant population, of the AGB population, and appear at a rate of order EAGB stars per unit star formation ( year-1) using the liberal criteria (and an order of magnitude fewer if we use the more conservative one). Clarifying these scalings with stellar mass, SFR and metallicity requires larger and deeper surveys of nearby galaxies than can be accomplished with warm Spitzer or eventually with JWST.
References
- Alard & Lupton (1998) Alard, C. & Lupton, R. H. 1998, ApJ, 503, 325
- Arbour & Boles (2008) Arbour, R. & Boles, T. 2008, Central Bureau Electronic Telegrams, 1234, 1
- Ashby et al. (2009) Ashby, M. L. N. et al. 2009, ApJ, 701, 428
- Berger et al. (2009) Berger, E. et al. 2009, ApJ, 699, 1850
- Blum et al. (2006) Blum, R. D. et al. 2006, AJ, 132, 2034
- Bolatto et al. (2007) Bolatto, A. D. et al. 2007, ApJ, 655, 212
- Bonanos et al. (2006) Bonanos, A. Z. et al. 2006, ApJ, 652, 313
- Bonanos et al. (2009) —. 2009, AJ, 138, 1003
- Bond et al. (2009) Bond, H. E. et al. 2009, ApJ, 695, L154
- Botticella et al. (2009) Botticella, M. T. et al. 2009, MNRAS, 398, 1041
- Chiosi & Maeder (1986) Chiosi, C. & Maeder, A. 1986, ARA&A, 24, 329
- Conroy et al. (2010) Conroy, C., White, M., & Gunn, J. E. 2010, ApJ, 708, 58
- Dale et al. (2009) Dale, D. A. et al. 2009, ApJ, 703, 517
- Elias et al. (1986) Elias, J. H., Frogel, J. A., & Schwering, P. B. W. 1986, ApJ, 302, 675
- Fazio et al. (2004) Fazio, G. G. et al. 2004, ApJS, 154, 10
- Gogarten et al. (2009) Gogarten, S. M. et al. 2009, ApJ, 703, 300
- Gieren et al. (2005) Gieren, W. et al. 2005, ApJ, 628, 695
- Gruendl & Chu (2009) Gruendl, R. A. & Chu, Y. 2009, ApJS, 184, 172
- Gruendl et al. (2008) Gruendl, R. A. et al. 2008, ApJ, 688, L9
- Hartman et al. (2004) Hartman, J. D., Bakos, G., Stanek, K. Z., & Noyes, R. W. 2004, AJ, 128, 1761
- Karachentsev et al. (2004) Karachentsev, I. D. et al. 2004, AJ, 127, 2031
- Kashi et al. (2010) Kashi, A., Frankowski, A., & Soker, N. 2010, ApJ, 709, L11
- Kennicutt et al. (2003) Kennicutt, Jr., R. C. et al. 2003, PASP, 115, 928
- Kennicutt et al. (2008) —. 2008, ApJS, 178, 247
- Kochanek et al. (2008) Kochanek, C. S. et al. 2008, ApJ, 684, 1336
- Lee et al. (2009) Lee, J. C. et al. 2009, ApJ, 706, 599
- Li et al. (2001) Li, W., Filippenko, A. V., & Riess, A. G. 2001, ApJ, 546, 719
- Marcillac et al. (2006) Marcillac, D. et al. 2006, A&A, 451, 57
- Massey et al. (2006) Massey, P. et al. 2006, AJ, 131, 2478
- McQuinn et al. (2007) McQuinn, K. B. W. et al. 2007, ApJ, 664, 850
- Miyaji et al. (1980) Miyaji, S., Nomoto, K., Yokoi, K., & Sugimoto, D. 1980, PASJ, 32, 303
- Monard (2008) Monard, L. A. G. 2008, IAU Circ., 8946, 1
- Mould et al. (2008) Mould, J. et al. 2008, ApJ, 687, 230
- Poelarends et al. (2008) Poelarends, A. J. T., Herwig, F., Langer, N., & Heger, A. 2008, ApJ, 675, 614
- Prieto (2008) Prieto, J. L. 2008, The Astronomer’s Telegram, 1550, 1
- Prieto et al. (2008) Prieto, J. L. et al. 2008, ApJ, 681, L9
- Prieto et al. (2009) —. 2009, ApJ, 705, 1425
- Pumo et al. (2009) Pumo, M. L. et al. 2009, ApJ, 705, L138
- Saha et al. (2006) Saha, A. et al. 2006, ApJS, 165, 108
- Sahu et al. (2006) Sahu, D. K. et al. 2006, MNRAS, 372, 1315
- Santini et al. (2009) Santini, P., Fontana, A., & Grazian, A. 2009, in American Institute of Physics Conference Series, Vol. 1111, American Institute of Physics Conference Series, ed. G. Giobbi, A. Tornambe, G. Raimondo, M. Limongi, L. A. Antonelli, N. Menci, & E. Brocato, 212–215
- Siess (2007) Siess, L. 2007, A&A, 476, 893
- Smartt et al. (2009) Smartt, S. J. et al. 2009, MNRAS, 395, 1409
- Smith et al. (2009a) Smith, N. et al. 2009a, ApJ, 697, L49
- Smith et al. (2009b) Smith, N. et al. 2009b, ArXiv e-prints
- Stetson (1992) Stetson, P. B. 1992, 25, 297
- Thompson et al. (2009) Thompson, T. A. et al. 2009, ApJ, 705, 1364
- Wesson et al. (2009) Wesson, R. et al. 2009, MNRAS, 1823
- Woosley et al. (2002) Woosley, S. E., Heger, A., & Weaver, T. A. 2002, Reviews of Modern Physics, 74, 1015
Appendix A LMC and SMC
| Galaxy | RA | Dec | Color | |||||||||
|---|---|---|---|---|---|---|---|---|---|---|---|---|
| (deg) | (deg) | (mag) | (mag) | (mag) | (mag) | |||||||
| LMC | 81.694135 | 68.813077 | 8.74 | 7.13 | 1.61 | 5.79 | 4.37 | |||||
| LMC | 83.559766 | 69.788996 | 10.42 | 7.88 | 2.21 | 5.67 | 3.65 | |||||
| LMC | 78.003216 | 70.540071 | 9.94 | 8.22 | 1.72 | 6.82 | 5.44 | |||||
| LMC | 79.801060 | 69.152029 | 9.80 | 7.84 | 1.96 | 6.17 | 5.01 | |||||
| LMC | 80.552349 | 67.975638 | 9.54 | 8.00 | 1.54 | 6.56 | 5.20 | |||||
| LMC | 82.726151 | 68.574502 | 9.78 | 8.24 | 1.54 | 7.10 | 5.98 | |||||
| LMC | 83.332279 | 69.695785 | 9.85 | 8.31 | 1.54 | 7.14 | 6.05 | |||||
| LMC | 84.932592 | 69.642732 | 9.62 | 7.48 | 2.14 | 5.80 | 4.63 | |||||
| LMC | 87.485476 | 70.886629 | 9.94 | 8.37 | 1.57 | 7.08 | 5.81 | |||||
| SMC | 16.246012 | 72.147362 | 9.61 | 8.09 | 1.52 | … | 7.88 | |||||
Appendix B M33
| RA | Dec | Color | ||||||||||
|---|---|---|---|---|---|---|---|---|---|---|---|---|
| (deg) | (deg) | (mag) | (mag) | (mag) | (mag) | |||||||
| 23.55626 | 30.55206 | 14.43 | 12.72 | 1.71 | 11.27 | 10.29 | ||||||
| 23.55223 | 30.90565 | 15.07 | 13.39 | 1.68 | 12.10 | 11.11 | ||||||
| 23.34230 | 30.64595 | 15.00 | 13.43 | 1.57 | 12.15 | 11.07 | ||||||
| 23.45476 | 30.85700 | 16.49 | 14.32 | 2.17 | 12.67 | 11.41 | ||||||
| 23.40428 | 30.51731 | 15.24 | 13.55 | 1.69 | 12.25 | 11.03 | ||||||
| 23.29855 | 30.59900 | 16.47 | 14.91 | 1.56 | 13.62 | 12.35 | ||||||
| 23.56806 | 30.87753 | 16.63 | 14.81 | 1.82 | 13.77 | 12.80 | ||||||
| 23.55592 | 30.93663 | 16.40 | 14.86 | 1.54 | 13.45 | 12.14 | ||||||
| 23.39692 | 30.67733 | 15.25 | 13.74 | 1.51 | 12.44 | 11.35 | ||||||
| 23.53805 | 30.73258 | 15.78 | 14.14 | 1.64 | 12.72 | 11.36 | ||||||
| 23.44840 | 30.65119 | 14.35 | 12.83 | 1.52 | 11.32 | 10.45 | ||||||
| 23.43436 | 30.57101 | 15.93 | 14.23 | 1.70 | 13.25 | 12.32 | ||||||
| 23.46795 | 30.61916 | 15.95 | 14.32 | 1.63 | 12.95 | 11.47 | ||||||
| 23.49594 | 30.75659 | 16.24 | 14.63 | 1.61 | 13.82 | 12.90 | ||||||
| 23.43886 | 30.64303 | 15.90 | 14.39 | 1.51 | 13.41 | 12.49 | ||||||
| 23.29759 | 30.50737 | 15.50 | 13.91 | 1.59 | 12.55 | 11.27 | ||||||
| 23.42809 | 30.70271 | 16.17 | 14.62 | 1.55 | 13.06 | 11.26 | ||||||
| 23.42741 | 30.65543 | 16.54 | 14.87 | 1.67 | … | … | ||||||
| 23.48104 | 30.63851 | 17.09 | 14.64 | 2.45 | 12.92 | 11.83 | ||||||
| 23.49179 | 30.82798 | 16.43 | 14.89 | 1.54 | 13.41 | 12.00 |
Appendix C NGC 300
| RA | Dec | Color | ||||||||
|---|---|---|---|---|---|---|---|---|---|---|
| (deg) | (deg) | (mag) | (mag) | |||||||
| 13.85991 | 37.57455 | 11.50 | 0.02 | 11.50 | 0.03 | 0.01 | ||||
| 13.62310 | 37.81105 | 12.04 | 0.02 | 12.03 | 0.02 | 0.01 | ||||
| 13.87644 | 37.56594 | 12.04 | 0.02 | 12.05 | 0.01 | 0.00 | ||||
| 13.71941 | 37.81866 | 12.73 | 0.01 | 12.68 | 0.02 | 0.04 | ||||
| 13.83688 | 37.80313 | 12.93 | 0.02 | 12.88 | 0.03 | 0.05 | ||||
| … | … | … | … | … | … | … |
| RA | Dec | Color | ||||||||||
|---|---|---|---|---|---|---|---|---|---|---|---|---|
| (deg) | (deg) | (mag) | (mag) | (mag) | (mag) | |||||||
| 13.60942 | 37.72041 | 18.03 | 16.32 | 1.71 | 15.49 | 14.28 | ||||||
| 13.80838 | 37.72509 | 18.04 | 16.33 | 1.71 | 15.28 | 13.76 | ||||||
| 13.74378 | 37.67188 | 18.07 | 16.36 | 1.71 | 16.27 | 14.94 | ||||||
| 13.65096 | 37.74543 | 17.94 | 16.26 | 1.68 | 15.66 | 14.97 | ||||||
| 13.71002 | 37.65558 | 17.63 | 15.96 | 1.67 | 14.90 | 13.53 | ||||||
| 13.73724 | 37.66650 | 17.39 | 15.75 | 1.64 | 14.87 | 13.52 | ||||||
| 13.74127 | 37.64604 | 16.99 | 15.38 | 1.61 | 14.88 | 13.79 | ||||||
| 13.67270 | 37.68299 | 17.90 | 16.26 | 1.64 | 15.02 | 13.63 | ||||||
| 13.70787 | 37.66964 | 17.59 | 15.52 | 2.07 | 14.88 | 12.90 | ||||||
| 13.67960 | 37.63695 | 17.47 | 15.93 | 1.54 | 14.88 | 13.85 |
Appendix D M81
| RA | Dec | Color | ||||||||
|---|---|---|---|---|---|---|---|---|---|---|
| (deg) | (deg) | (mag) | (mag) | |||||||
| 149.19633 | 69.12408 | 11.26 | 0.05 | 11.30 | 0.04 | 0.04 | ||||
| 149.32484 | 69.02681 | 12.74 | 0.05 | 12.80 | 0.04 | 0.06 | ||||
| 149.30643 | 69.05417 | 12.86 | 0.03 | 12.85 | 0.03 | 0.02 | ||||
| 148.72163 | 69.06341 | 12.93 | 0.04 | 12.88 | 0.04 | 0.05 | ||||
| 149.21478 | 69.12849 | 13.96 | 0.02 | 12.96 | 0.04 | 1.00 | ||||
| … | … | … | … | … | … | … |
| RA | Dec | Color | ||||||||||
|---|---|---|---|---|---|---|---|---|---|---|---|---|
| (deg) | (deg) | (mag) | (mag) | (mag) | (mag) | |||||||
| 148.67606 | 69.14224 | 18.03 | 16.22 | 1.81 | 14.88 | 13.51 | ||||||
| 148.65425 | 69.08266 | 18.97 | 17.18 | 1.79 | 14.91 | 13.03 | ||||||
| 148.89754 | 69.11637 | 17.68 | 15.79 | 1.89 | 14.68 | 13.84 | ||||||
| 148.72737 | 68.98086 | 18.54 | 17.02 | 1.52 | 15.46 | 14.27 | ||||||
| 148.83730 | 68.98399 | 19.05 | 17.07 | 1.98 | 16.47 | 15.58 | ||||||
| 149.06765 | 69.03034 | 17.88 | 16.31 | 1.57 | 14.78 | 13.26 | ||||||
| 149.00651 | 69.07363 | 18.87 | 17.01 | 1.86 | 14.22 | 12.23 | ||||||
| 148.74550 | 69.07730 | 17.91 | 16.32 | 1.59 | 14.98 | 13.63 | ||||||
| 149.02259 | 69.04263 | 18.39 | 16.85 | 1.54 | 17.63 | … | ||||||
| 148.88968 | 69.14354 | 18.73 | 16.77 | 1.96 | 15.62 | 13.80 | ||||||
| 148.93513 | 69.08881 | 18.80 | 17.12 | 1.68 | 18.24 | … | ||||||
| 149.09832 | 69.06480 | 18.07 | 16.55 | 1.52 | 15.08 | 13.31 | ||||||
| 149.02652 | 69.03100 | 18.03 | 16.27 | 1.76 | 15.54 | 14.57 | ||||||
| 148.84383 | 69.15902 | 18.52 | 16.86 | 1.66 | 15.69 | 14.24 | ||||||
| 149.07671 | 69.00262 | 18.63 | 16.90 | 1.73 | 16.33 | 14.49 | ||||||
| 148.71896 | 69.16830 | 19.22 | 17.38 | 1.84 | 16.31 | 14.92 | ||||||
| 148.75517 | 69.12566 | 18.74 | 17.11 | 1.63 | 17.77 | 15.72 | ||||||
| 148.76269 | 69.12973 | 18.87 | 17.30 | 1.57 | 16.04 | 14.39 | ||||||
| 148.96612 | 69.12932 | 18.88 | 17.37 | 1.51 | 16.61 | 14.99 | ||||||
| 148.99972 | 68.96981 | 19.00 | 17.40 | 1.60 | 16.89 | … | ||||||
| 148.96812 | 68.99771 | 19.12 | 17.61 | 1.51 | 16.09 | 14.55 | ||||||
| 148.73406 | 69.09608 | 18.63 | 17.12 | 1.51 | 16.34 | 15.44 | ||||||
| 149.04063 | 69.06424 | 19.31 | 17.76 | 1.55 | 18.52 | 16.15 | ||||||
| 148.77491 | 68.99690 | 19.44 | 17.75 | 1.69 | 15.92 | 14.33 | ||||||
| 148.87053 | 68.93584 | 19.25 | 17.72 | 1.53 | … | 16.36 | ||||||
| 148.87911 | 69.15796 | 19.22 | 17.59 | 1.63 | 15.73 | 13.63 | ||||||
| 149.08604 | 69.08849 | 19.21 | 17.55 | 1.66 | 16.00 | 14.52 | ||||||
| 148.70745 | 69.08449 | 19.02 | 17.51 | 1.51 | 16.46 | 15.05 | ||||||
| 148.82431 | 69.15687 | 19.23 | 17.47 | 1.76 | 16.94 | … | ||||||
| 148.73618 | 69.12076 | 19.02 | 17.46 | 1.56 | … | … | ||||||
| 148.68902 | 69.17968 | 19.01 | 17.44 | 1.57 | 17.22 | 17.46 | ||||||
| 149.11110 | 69.01974 | 19.07 | 17.41 | 1.66 | 16.73 | 15.42 | ||||||
| 149.05787 | 69.03054 | 19.11 | 17.38 | 1.73 | 18.27 | 16.20 | ||||||
| 149.08270 | 68.98944 | 18.68 | 17.06 | 1.62 | 16.16 | 15.67 | ||||||
| 148.85093 | 69.13267 | 18.56 | 16.84 | 1.72 | 15.65 | 14.70 | ||||||
| 148.67919 | 69.14593 | 19.36 | 16.84 | 2.52 | 15.19 | 13.92 | ||||||
| 148.70187 | 69.06804 | 19.32 | 17.57 | 1.75 | 16.04 | 14.21 | ||||||
| 148.71479 | 69.08243 | 19.40 | 17.74 | 1.66 | 17.31 | 16.86 | ||||||
| 149.08331 | 69.03896 | 18.92 | 17.33 | 1.59 | 17.29 | 15.36 |
Appendix E NGC 6946
| RA | Dec | Color | ||||||||
|---|---|---|---|---|---|---|---|---|---|---|
| (deg) | (deg) | (mag) | (mag) | |||||||
| 308.77542 | 60.06477 | 12.94 | 0.03 | 12.78 | 0.03 | 0.16 | ||||
| 308.72086 | 60.17000 | 13.09 | 0.03 | 13.20 | 0.03 | 0.12 | ||||
| 308.80408 | 60.04553 | 13.53 | 0.03 | 13.50 | 0.03 | 0.04 | ||||
| 308.69391 | 60.11113 | 13.57 | 0.03 | 13.51 | 0.03 | 0.06 | ||||
| 308.77582 | 60.09848 | 13.66 | 0.03 | 13.51 | 0.03 | 0.15 | ||||
| … | … | … | … | … | … | … |
| RA | Dec | Color | ||||||||||
|---|---|---|---|---|---|---|---|---|---|---|---|---|
| (deg) | (deg) | (mag) | (mag) | (mag) | (mag) | |||||||
| 308.74430 | 60.09641 | 19.53 | 18.00 | 1.53 | 17.22 | 16.32 | ||||||
| 308.68564 | 60.05348 | 19.62 | 18.07 | 1.55 | … | … | ||||||
| 308.57731 | 60.18055 | 18.86 | 17.32 | 1.54 | 14.83 | 12.83 | ||||||
| 308.85752 | 60.17550 | 19.97 | 18.45 | 1.52 | 16.17 | 14.50 | ||||||
| 308.58661 | 60.11402 | 19.49 | 17.86 | 1.63 | 17.80 | 15.98 | ||||||
| 308.58305 | 60.19101 | 18.94 | 17.36 | 1.58 | 17.21 | 16.08 | ||||||
| 308.60922 | 60.17430 | 18.55 | 16.98 | 1.57 | 16.12 | 16.84 | ||||||
| 308.79663 | 60.11229 | 18.95 | 17.38 | 1.57 | … | … | ||||||
| 308.62378 | 60.08993 | 19.96 | 18.25 | 1.71 | 17.22 | 15.98 | ||||||
| 308.88858 | 60.21206 | 20.71 | 18.69 | 2.02 | … | 15.49 | ||||||
| 308.58582 | 60.11384 | 20.04 | 18.15 | 1.89 | 17.51 | 16.51 | ||||||
| 308.62727 | 60.07459 | 20.35 | 18.50 | 1.85 | 17.27 | 16.87 | ||||||
| 308.87304 | 60.13669 | 20.22 | 18.25 | 1.97 | 17.75 | 20.10 | ||||||
| 308.67866 | 60.10364 | 19.94 | 18.07 | 1.87 | 17.36 | 14.64 | ||||||
| 308.83064 | 60.10620 | 20.68 | 18.49 | 2.19 | … | … | ||||||
| 308.62745 | 60.20580 | 20.58 | 18.66 | 1.92 | … | … | ||||||
| 308.77135 | 60.20534 | 19.94 | 18.04 | 1.90 | 16.79 | 15.05 | ||||||
| 308.72470 | 60.10376 | 19.18 | 17.28 | 1.90 | 16.35 | … | ||||||
| 308.56433 | 60.05990 | 20.57 | 18.69 | 1.88 | 18.33 | 17.80 | ||||||
| 308.63279 | 60.20597 | 20.22 | 18.35 | 1.87 | 17.96 | … | ||||||
| 308.71184 | 60.07200 | 20.43 | 18.68 | 1.75 | 18.18 | 16.35 | ||||||
| 308.67038 | 60.09997 | 19.35 | 17.77 | 1.58 | 16.71 | 16.09 | ||||||
| 308.56994 | 60.08913 | 20.81 | 18.59 | 2.22 | 17.32 | 17.35 | ||||||
| 308.59289 | 60.07903 | 20.35 | 18.62 | 1.73 | 16.87 | 18.58 | ||||||
| 308.61373 | 60.10318 | 19.96 | 18.26 | 1.70 | … | 18.88 | ||||||
| 308.56247 | 60.11828 | 20.81 | 18.63 | 2.18 | 18.44 | … | ||||||
| 308.88990 | 60.08202 | 20.45 | 18.50 | 1.95 | 17.31 | 19.94 | ||||||
| 308.86798 | 60.07440 | 20.50 | 18.67 | 1.83 | … | 16.44 | ||||||
| 308.59478 | 60.06813 | 20.26 | 18.48 | 1.78 | 19.55 | 15.92 | ||||||
| 308.58739 | 60.07366 | 20.23 | 18.67 | 1.56 | 20.11 | … |