CO J=6–5 in Arp 220: strong effects of dust on high-J CO lines
Abstract
We report new single dish CO J=6–5 line observations for the archetypal Ultra Luminous Infrared Galaxy (ULIRG) Arp 220 with the James Clerk Maxwell Telescope atop Mauna Kea in Hawaii. The J=6–5 line is found to be faint, with brightness temperature ratios (6–5)/(1–0), (6–5)/(3–2) of =0.0800.017 and =0.0820.019, suggesting very low excitation conditions that cannot be reconciled with the warm and very dense molecular gas present in one of the most extreme starbursts in the local Universe. We find that an optically thick dust continuum, with for the bulk of the warm dust and gas in Arp 220, submerges this line to an almost black body curve, reducing its flux, and affecting its CO Spectral Line Energy Distribution (SLED) at high frequencies. This also resolves the C+ line deficiency in this object, first observed by ISO: the near absence of that line is a dust optical depth effect, not a dense Photodissociation Region (PDR) phenomenon. Finally we briefly comment on the possibility of such extreme ISM states in other ULIRGs in the distant Universe, and its consequences for the diagnostic utility of high frequency molecular and atomic ISM lines in such systems. In the case of Arp 220 we anticipate that the now spaceborne Herschel Space Observatory will find faint high-J CO lines at 690 GHz that would appear as sub-thermally excited with respect to the low-J ones as a result of the effects of dust absorption.
1 Introduction
Since the discovery of its enormous IR luminosity ((8–1000 m), Soifer et al. 1984; Emerson et al. 1984), representing of its bolometric luminosity, Arp 220 has been a study of extremes when it comes to the ISM conditions in intense starbursts in the local Universe. A prominent member in a prominent class of galaxies (e.g. Sanders & Ishida 2004), the large IR luminosity and relative proximity (at 77 Mpc, it is the nearest ULIRG), made Arp 220 an early target of numerous molecular line observations. Its large CO J=1–0 line luminosity revealed a huge molecular gas reservoir () (Young et al. 1984; Sanders, Scoville, & Soifer 1991; Solomon et al. 1997), while luminous transitions of heavy rotor molecules such as CS J=3–2, and HCN, HCO+ J=1–0 have demonstrated that, quite unlike typical quiescent spirals, most of the molecular gas in this spectacular merger is very dense, with (Solomon et al. 1990, 1992). Such studies have recently culminated in the most extensive molecular line survey ever conducted for such objects (Greve et al. 2009), making Arp 220 a galaxy with the best studied molecular gas reservoirs in the local Universe. High resolution CO J=1–0, 2–1 interferometric imaging reveals two compact (2r0.3′′; 108 pc) gas concentrations 1′′ (360 pc) apart (Scoville, Yun, & Bryant 1997; Downes & Solomon 1998; Sakamoto et al. 1999; Eckart, & Downes 2001), whose intense starbursts dominate the IR luminosity of the entire system. Finally a major advance was recently made with the imaging of the CO J=3–2 emission (and the adjacent continua at 860m) of the warm and dense gas, that also implied substantial dust optical depths even at submm wavelengths (Sakamoto et al. 2009).
We report single dish CO J=6–5 observations of Arp 220 with the James Clerk Maxwell Telescope as part of a multi-J CO and HCN line survey of LIRGs ( 1011 L⊙) in the local Universe. We demonstrate that an optically thick dust continuum at submm wavelengths submerges this CO line to near-blackbody emission, and strongly affects the emergent CO Spectral Line Energy Distribution (SLED) and the C+ fine-structure line luminosity for this extreme starburst. Finally we discuss whether similar ISM conditions are present in dusty starbursts in the distant Universe, lowering their observed (high-J)/(low-J) CO ratios well below those typical of star-forming molecular gas, and thus limiting their diagnostic utility.
2 Observations, line and continuum flux estimates
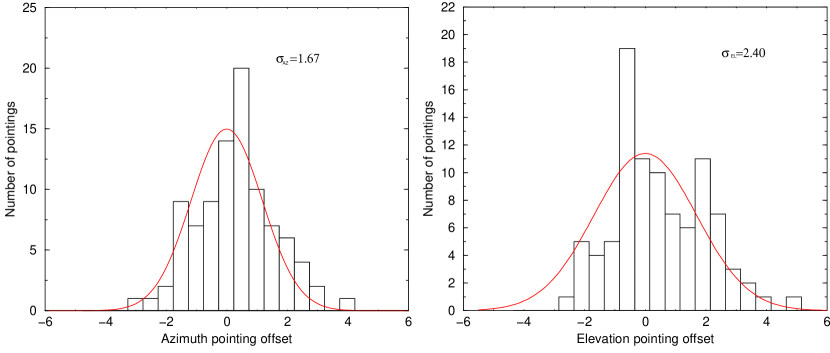
We used the upgraded dual-channel W/D (620–710 GHz) receiver at the James Clerk Maxwell Telescope (JCMT)111The James Clerk Maxwell Telescope is operated by The Joint Astronomy Centre on behalf of the Science and Technology Facilities Council of the United Kingdom, the Netherlands Organisation for Scientific Research, and the National Research Council of Canada. at 4092 m altitude atop Mauna Kea in Hawaii, operating single sideband (SSB), to observe the CO J=6–5 line (=691.473 GHz) in Arp 220 on March 15th 2009 under dry conditions (0.040.06). To ensure the flattest baselines possible, but also measure the corresponding dust continuum at =442m, we used the fastest beam switching mode available (continuum mode) with a beam switch frequency of =4 Hz and a throw of (in azimuth). The ACSIS spectrometer222http://www.jach.hawaii.edu/JCMT/spectral_line/Backends/acsis/acsisguide.html was used at its widest mode of 1.8 GHz (780 km s-1 at 690 GHz) and two separate tunings, yielding an effective bandwidth of (1400 km s-1). This was necessary in order to cover the widest known CO line in local ULIRGs (FWZI900–1000 km s-1). The typical system temperatures were (20003000) K, with a median of 2500 K (including atmospheric absorption). The beam size at 691 GHz is =8′′. Good pointing with such narrow beams is crucial and was checked every 45 mins using both absolute W/D and differential pointing with the A 3 receiver (230 GHz), yielding 1.4′′ (rms) (Figure 1). The aperture efficiency at 690 GHz is =0.32, estimated from the Ruze formula for an 80% membrane transmission, an rms dish surface accuracy of 25m, and a =0.68 (aperture efficiency for a perfect dish with the illumination taper applied at the JCMT), and verified with observations of Venus. The flux calibration uncertainty is estimated with repeated observations of compact spectral line standards and is .
Individual spectra were examined, edited for bad channels, and co-added (both W/D channels) to yield the final spectrum shown in Figure 2 overlaid with CO 3–2 (JCMT), and the HCN J=1–0, CS J=3–2 lines obtained with the IRAM 30-m telescope (from Greve et al. 2009). The agreement between overall FWZI’s and line centers is excellent although the CO J=6–5 line becomes weak towards the velocity range where the high density tracer CS J=3–2 line (2105 cm-3) becomes especially strong (see discusion in section 3). The integrated CO J=6–5 line flux is estimated from
| (1) |
where , and
| (2) |
with the pointing residuals. The aforementioned factor corrects for the flux bias resulting when point-like sources are observed with single dish telescopes with given pointing rms errors (Condon 2001). This is usually insignificant for modern mm/submm telescopes (e.g. at 345 GHz and the same pointing rms error: G1.064), yet it can become significant at very high frequencies, even for the excellent tracking and pointing of the enclosed JCMT. For our observations G=1.17, and we use it to scale our measured CO J=6–5 line and 442m dust continuum fluxes accordingly. We obtain (65)=(1170341) Jy km s-1, and =(3.710.96) Jy (using the line-free part of the spectrum and the scaling factor in Equation 1), or equivalently =(3.850.99) Jy (scaled by ). Regarding the continuum it is worth mentioning that Arp 220 is a submm calibration source for SCUBA at the JCMT333http://www.jach.hawaii.edu/JCMT/continuum/calibration/sens/potentialcalibrators.html, where multiple images show a compact source at 450m () with =(2.770.06) Jy. The higher value of =(6.30.8) Jy reported by Dunne & Eales (2001) is thus likely affected by calibration error (Dunne 2009, private communication). Finally the CO J=6–5 flux is in good agreement with that reported recently by Matsushita et al. 2009 of Sco(6–5)=(1250250)Jy km s-1 using the SMA444A fringe pattern present on the short baselines has likely corrupted the SMA channel map spectrum (Fig. 7 in Matsushita et al. 2009), and thus the SMA spectrum is not reproduced here. The reported SMA line flux has been corrected for that effect (Matsushita 2009, private communication). For the purposes of this work we adopt: (65)=(1210240) Jy km s-1 (average: JCMT and SMA), =(3.00.06) Jy (average: W/D, SMA, SCUBA calibrator database).
3 The state of molecular gas and dust in Arp 220
A large multi-J CO, HCN, HCO+ and CS line survey by Greve et al. (2009) makes Arp 220 the ULIRG with the best-studied molecular gas properties, and allows us to place the measured CO J=6–5 line in the best possible perspective. From that study it becomes apparent that densities for the bulk of the molecular gas in Arp 220 are very high: 105-6 cm-3, and thus the CO J=6–5 transition is expected to be fully thermalized ( 5.8104 cm-3). On the other hand global dust continuum SEDs (e.g. Lisenfeld, Isaak, & Hills 2000), and high resolution mm/submm imaging (e.g. Downes & Eckart 2007; Sakamoto et al. 2008) yield typically (65–120) K. For the high gas densities in this system: , and the CO line emission should be peaking at 5–7 (5.5 K). Clearly the J=6–5 transition should not only be luminous but quite possibly the most luminous CO line in this system, with typical brightness temperature ratios of 0.80–0.95 for J+1=1–5, even for the lowest possible =65 K and .
3.1 High dust optical depths at submm wavelengths
Our measured CO (6–5)/(1–0) and (6–5)/(3–2) brightness temperature ratios for Arp 220 are: =0.0800.017 and =0.0820.019 (CO J=1–0, 3–2 fluxes from Greve et al 2009), suggesting impossibly low excitation conditions, very much incompatible with the average properties of its molecular gas reservoir. High dust optical depths at short submm wavelengths provide the most plausible explanation for the faint CO J=6–5 line, immersing it in a strong nearly blackbody (and thus almost featureless) dust continuum. Such large optical depths of dust continuum at far-IR wavelengths were first proposed for Arp 220 by Lisenfeld et al. (2000) where 5–12 has been deduced from its far-IR/submm dust SED, with Gonzalez-Alfonso et al. (2004) arriving at similar conclusions using a full ISO LWS spectrum. This has culminated with the recent work of Sakamoto et al. 2008 where large optical depths are reported even at submm wavelengths (1). Their effect on the emergent CO line ratios can be easily shown using a simple model of an isothermal mixture of molecular gas and dust in LTE, where the continuum-subtracted source line brightness temperature is (e.g. Rohlfs & Wilson 1996):
| (3) |
where =, and and are the dust continuum and CO line optical depths. Here is important to point out that the equation above assumes a form identical to that for line absorption by a foreground dust screen only for an isothermal mixture of line-emitting gas and continuum-emitting dust (i.e. identical source functions). In such a mixture the high dust optical depths do not actually reduce the emergent line strength (as they would for a dust absorption “screen”) rather than make both continuum and spectral line emission rise up to a common blackbody SED, with Equation 3 simply expressing the diminishing line-continuum contrast. For a dust emissivity law (=1-2), the brightness temperature ratio CO(6–5)/(J+1–J) transition would then be
| (4) |
where is the “intrinsic” line ratio corresponding to =0. For CO J=3–2 (also tracing the warm star forming molecular gas as the J=6–5 line) and its corresponding continuum emission Sakamoto et al. (2008) has deduced 1. For = and a typical =(65–90) K our Large Velocity Gradient (LVG) code yields 0.85–0.90. Inserting these values into Equation 4 yields 0.042–0.32 (for =1-2), comfortably encompassing the observed value, and demonstrating how substantial submm dust optical depths can suppress (high-J)/(low-J) CO line ratios. The larger suppression of CO J=6–5 in the eastern nucleus of Arp 220, contributing mostly to the “horn” at 5600 km s-1 of the CO line profiles, is then a likely result of the larger gas densities (and thus correspondingly larger dust optical depths). This is clearly indicated by the rising CS J=3–2 line emission (Figure 2) and the larger HCN(4–3)/CO(3–2) ratio (Figure 3) towards (5500–5600) than towards (5300–5400) , the latter range associated with the western nucleus.
Thus the CO J=6–5 line (and partially even J=3–2) is affected by a dust continuum rising to an almost black body curve from IR out to short submm wavelengths. This is further indicated by the observed ratio 5.450.82 (for the two nuclei: =(0.550.082) Jy, from Sakamoto et al. 2008), which is close to the black body value of =3.93. Indeed from
| (5) |
and =5.45 we find 1.25 (for =2), while for =6.27 ( of the measured value) the minimum optical depth is 0.95. Dust optical depths large enough to bring all this about are certainly present in Arp 220 (Sakamoto et al. 2008), while the globally supressed J=6–5 line further demonstrates that much of the large molecular gas mass in this system is “cloaked” by these high dust optical depths rather than only small sub-regions around e.g. an AGN (Downes & Eckart 2007). If this is typical for ULIRGs, it can modify the emergent CO SLEDs, and affect the diagnostic value of molecular lines at high frequencies for such extreme systems, a possibility further discussed in Section 4.
Finally we note that the average state of the molecular gas in Arp 220, as indicated by the HCN, CS, and HCO+ lines, is so highly excited that even CO J=6–5 line fluxes up to 3 times higher would leave well below what is expected of such gas and is typically observed in starbursts (see Figure 5 in section 4.2), still suggesting substantial dust optical depths at short submm wavelengths surpressing high-J CO line emission.
3.2 Arp 220: the C+ line luminosity deficit resolved
For a “cloaking” the bulk of the gas and dust in Arp 220, and conservatively assuming =1, yields at the emission wavelength of the C+ fine structure line. This is more than enough to almost completely suppress this strong ISM cooling line into a featureless black body dust continuum, favoring large dust optical depths as the cause for its weakness among the other explanations proposed (e.g. Malhotra et al. 1997). Indeed the faint CO J=6–5 line, besides corroborating the high dust optical depths at IR/submm wavelengths in Arp 220, also makes them the most likely cause of its C+ line luminosity “deficit” (found in ULIRGs, with Arp 220 having the largest; Luhman et al. 1998, 2003). It does so by negating a prominent alternative explanation for the C+ line surpression, namely very dense PDRs (where precipitous C+ recombination would remove it from the ISM). This is because CO J=6–5 is a different spectral line (governed by different physics and chemistry than C+) and one that ought to be luminous if that alternative explanation held. Indeed, for dense PDRs immersed in strong far-UV radiation fields high-J CO lines are expected to be very luminous and an alternative cooling “channel” to that of the suppressed C+ line, balancing the tremendeous ISM heating expected in ULIRGs (Papadopoulos, Isaak, & van der Werf 2007). Finally it must be noted that if high dust optical depths at short submm wavelengths are responsible for surpressing both the high-J CO and the C+ lines in ULIRGs, it follows that the starburst systems with dust-surpressed (high-J)/(low-J) CO line ratios will also be those with small L(C+)/LIR.
4 High dust optical depths in ULIRGs: from the IR to the submm
The discovery of dust continuum optical depths that in ULIRGs can remain substantial even out to short submm wavelengths is the culmination of a series of studies successively “pushing” the limit longwards in wavelength for these remarkable systems (Condon et al 1991; Solomon et al. 1997; Lisenfeld et al. 2000; Sakamoto et al. 2008). Condon et al. were the first to point out that high dust extinction at far-IR wavelengths is needed to explain radio continuum sizes of ULIRGs that are smaller than their minimum IR black-body emission sizes. They argued that re-radiation of the IR light from a compact starburst by dust “layers” further out that remain optically thick at far-IR wavelengths can yield larger effective IR-continuum source sizes than the true starburst sizes (revealed by radio continuum). For the compact gas disk configurations in ULIRGs (expected in mergers and their dissipative gas motions) such large dust optical depths can make both IR “colors” and ISM line ratios at short submm wavelengths viewing-angle dependent and thus much reduce their AGN-vs-starburst diagnostic power. This is indeed the case for IR colors where “IR-cool” ULIRGs may not be lacking an AGN but instead host AGN that are heavily obscured along the particular line of sight observed (Condon et al. 1991), while in nearly face-on ULIRG/QSO systems (e.g. Mrk 231) such AGN remain visible with their warm IR colors discernible through smaller dust optical depths. It now seems that molecular line diagnostics at short submm wavelengths may suffer from similar effects.
4.1 The diagnostic power of far-IR/submm ISM lines revisited
A general effect of high dust optical depths at short submm wavelengths on the CO SLEDs would be to make them appear “cooler” than those typical for star-forming gas. Thus dust-suppressed CO (high-J)/(low-J) ratios can be hard to discern from those typical of genuinely low-excitation gas. High dust optical depths at short submm wavelengths in ULIRGs are particularly troubling for ISM lines whose physics makes them diagnostic of deeply “buried” AGN versus starbursts as the energy source of their prodigious IR luminosities. This is especially true for line frequencies of 690 GHz whose ratios, when unaffected by dust absorption, offer the best discrimination between the various ISM excitation mechanisms, such as X-rays from a deeply buried AGN (Meijerink & Spaans 2005), or far-UV photons from their starbursts (Meijerink, Spaans, & Israel 2006). In such cases ratios of lines adjacent in frequency (e.g. HCO+/HCN for the same rotational level) will have to be used as AGN/starburst discriminators. Finally, high dust optical depths at short submm wavelengths can affect molecular line observations of ULIRGs at high frequencies with the upcoming Herschel Space Observatory. For Arp 220 in particular faint and apparently sub-thermally excited CO lines are to be expected at 690 GHz (Figure 4), and this will also affect high-J transitions of any molecules tracing the star-forming gas phase (e.g. HCN).
4.2 Evidence for high dust optical depths at submm wavelengths in distant starbursts
Low (high-J)/(low-J) CO line ratios quite atypical of star-forming molecular gas have been measured in some of the most IR-luminous ( L⊙) starbursts in the distant Universe (Tacconi et al. 2006), a Ly-break galaxy whose CO(7–6)/(3–2) brightness temperature ratio is =0.030 (Baker et al. 2004), and in a submm-bright ULIRG at z=1.44 where 0.16 (Papadopoulos & Ivison 2002). However the wealth of molecular line data for Arp 220 that allowed its low CO (6–5)/(3–2) ratio to be attributed to large dust optical depths at short submm wavelengths is not available yet for high redshift systems. Thus, as discussed in the previous section, “cool” CO line ratios can be due to either low-excitation gas or to high dust optical depths.
Dominant amounts of low-excitation and SF-idle gas extending well beyond star-forming galactic nuclei are indeed well-known features of star-forming spirals in the local Universe and even of archetypal starbursts such as M 82 (Weiss, Walter, & Scoville 2004). However recent high resolution CO imaging of submm-bright galaxies (SMGs) at high redshifts finds no evidence for such low-excitation extended molecular gas reservoirs (Tacconi et al. 2006; Iono et al. 2009), yet it also measures CO (6–5)/(3–2), (7–6)/(3–2) line ratios of in many such systems. In one extreme such case, the most compact SMG (SMM J044307+0210 at z=2.5) has the lowest such line ratio of 0.13 (Tacconi et al. 2006). Indicatively, for nearby star-forming galactic nuclei such CO line ratios are 0.8–0.9 (Mao et al. 2000; Bayet et al. 2006), and values of 0.30 are typical of low-excitation SF-quiescent gas. In Figure 5 we show the ratios for star-forming and quiescent environments in the local Universe along with those available for systems at high redshifts. From this it becomes obvious that: a) nearby starburst environments behave as expected, tracing the entire range of values typical for star-forming molecular gas, and b) several high luminosity SMGs ( L⊙) fall well below this range,555If a “neighboring” CO line ratio (e.g. ) rather than is avalaible for a high-z system, we obtain the average value and range of by using the available one to find compatible LVG solutions over =(30–110) K, =(–) cm-3, assuming also 1. and well into that typical for low-excitation SF-idle environments. In some SMGs falls even below the minimum value of 0.3, expected for the dense and cold starless cores with minimum temperatures of 10 K (set by Galactic cosmic rays), and densities of n(H2)105 cm-3. Indicatively for Arp 220 would remain below that value even for a CO J=6–5 line flux that is 3 times higher than the one observed.
In order to better quantify this we conduct Large Velocity Gradient (LVG) radiative transfer modeling of the CO line ratios reported for SMGs by Tacconi et al. (2008). For and we find no solutions within (40–90) K, cm-3 and 1 (self-gravitating gas phase), the parameter space typical for star-forming gas. The Kvir parameter is
| (6) |
(1–2.5, depending on the cloud density profile) and quantifies the kinematics of the gas responsible for the CO emission, with 1 (within factors of 2–3) indicating a virialized gas phase and 1 an unbound one (e.g. Greve et al. 2009). Only for 0.3 are there solutions =[40 K, (65–80) K], = cm-3, i.e. typical for star-forming gas, except that =[4, 11] indicates unbound gas motions. The low CO (high-J)/(low-J) line ratios found in some distant starbursts are thus not compatible with the typical conditions of warm and dense star-forming gas. Hence, unless one is willing to postulate dominant amounts of cold and/or diffuse gas in some of the most spectacular starbursts in the Universe, high dust optical depths at rest-frame submm wavelengths are the only other way of surpressing such (high-J)/(low-J) CO line ratios. Finally, it is unlikely Arp 220 will be the only ULIRG, near or far, where this happens making its CO SLED appear “cool” and atypical of its vigorously star-forming dense gas.
In summary high dust optical depths at short submm wavelengths in extreme starbursts could then seriously impact
-
•
the detectability of CO J+1J, J+16 lines of starbursts in the local or distant Universe with Herschel and ALMA respectively
-
•
the diagnostic power of high-frequency molecular and atomic line ratios, (e.g. deduced densities and temperatures, AGN-induced XDRs versus starburst-related PDRs)
-
•
the thermal balance in the molecular ISM of ULIRGs (with and high-J CO line cooling diminished, dust continuum maybe the dominant cooling “channel”)
We will further explore these issues in a future paper that will include the entire suite of CO lines observed for the LIRGs in our sample and their corresponding molecular SLEDs for heavily dust obscured environments.
5 Conclusions
We report measurements of the high-excitation CO J=6–5 line and its adjacent dust continuum at 442m of the prototypical Ultra Luminous Infrared Galaxy Arp 220 with the James Clerk Maxwell Telescope in Hawaii. Our findings can be summarised as follows:
-
1.
The CO J=6–5 line is very faint, with CO (6–5)/(1–0), (6–5)/(3–2) brightness temperature ratios of 0.08, much lower than those expected from the warm and dense star-forming molecular gas that is present in this extreme starburst.
-
2.
High dust optical depths with 1 are responsible for the faint CO J=6–5 line in Arp 220 and will strongly modify its emergent CO SLED. We anticipate that for this ULIRG the now spaceborne Herschel Space Observatory will observe faint and apparently sub-thermally excited CO lines beyond 690 GHz.
-
3.
The C+ and the CO J=6–5 line luminosity “deficits” in this system have the same cause: high far-IR/submm dust optical depths.
-
4.
The low CO (high-J)/(low-J) line ratios found also in several starbursts at high redshifts could also be due to high dust optical depths at short sub-mm wavelengths, though in individual objects this can be hard to distinguish from large reservoirs of genuinely low-excitation molecular gas.
-
5.
High dust optical depths at far-IR/submm wavelengths can affect the diagnostic power of molecular and atomic lines in the spectral regime where it is expected to be the greatest, making their intensity ratios depend on differential absorption and viewing angle rather than underlying gas excitation conditions.
References
- (1) Baker A. J., Tacconi L. J., Genzel R., Lehnert M. D., & Lutz D. 2004, ApJ, 604, 125
- (2) Bayet, E., Gerin, M., Phillips, T.G., & Contursi, A. 2006, A&A, 460, 467
- (3) Bradford C. M., Nikola T., Stacey G. J., et al. 2003, ApJ, 586, 891
- (4) Condon J. J., Huang Z.-P., Yin Q. F., & Huan T. X. 1991, ApJ, 378, 65
- (5) Condon J. J. 2001, in Single-dish Radio Astronomy: Techniques and Applications ASP Conf. Series, Vol. 278, pg. 160
- (6) Downes D., & Solomon, P. M. 1998, ApJ, 507, 615
- (7) Downes D., & Eckart A. 2007, A&A, 468, L57
- (8) Eckart A., & Downes D. 2001, ApJ, 551, 730
- (9) Eales S. A., Wynn-Williams C. G., & Duncan W. D. 1989, ApJ, 339, 859
- (10) Emerson J. P., Clegg P. E., Gee G., et al. 1984, Nature, vol. 311, pg. 237
- (11) Goldsmith P. F. 2001, ApJ, 557, 736
- (12) González-Alfonso E., Smith H. A., Fischer J., & Cernicharo J. 2004, ApJ, 613, 247
- (13) Graciá-Carpio J., García-Burillo S., Planesas P., Fuente A., & Usero A. 2008, A&A, 479, 703
- (14) Greve T. R., Papadopoulos, P. P., Gao Y., & Radford S. J. E. 2009, ApJ, 692, 1432
- (15) Fixsen D. J., Bennett C. L., & Mather J. C. 1999, ApJ, 526, 207
- (16) Krips M., Neri R., García-Burillo S., et al. 2008, ApJ, 677, 262
- (17) Lisenfeld U., Isaak K. G., & Hills R. 2000, MNRAS, 312, 433
- (18) Luhman M. L., Satyapal S., Fischer J. et al. 1998, ApJ, 504, L11
- (19) Luhman M. L., Satyapal S., Fischer J., et al. 2003, ApJ, 594, 758
- (20) Malhotra S., Helou G., Stacey G., et al. 1997, ApJ, 491, L27
- (21) Mao R. Q., Henkel C., Schulz A., et al. 2000, A&A, 358, 433
- (22) Matsushita S., Iono D., Petitpas G., et al. 2009, ApJ, 693, 56
- (23) Marrone D. P., Battat J., Bensch F. 2004, ApJ, 612, 940
- (24) Meijerink R., & Spaans M. 2005, A&A, 436, 397
- (25) Meijerink R., & Spaans M. & Israel F. P. 2006, ApJ, 650, L103
- (26) Papadopoulos P. P., & Ivison, R. J. 2002, ApJ, 564, L9
- (27) Papadopoulos P. P., Isaak K. G., & van der Werf P. P. 2007, ApJ, 668 815
- (28) Rohlfs K., & Wilson T. L. 1996, in Tools of Radio Astronomy, 2nd Edition, pg. 320
- (29) Sakamoto K., Scoville N. Z., Yun M. S., et al. 1999, ApJ, 514, 68
- (30) Sakamoto K., Wang J., Wiedner M. C., et al. 2008, ApJ, 684, 957
- (31) Sanders D. B., Scoville N. Z., & Soifer B. T. 1991, ApJ, 370, 158
- (32) Sanders D. B., & Ishida C. M., 2004, in The Neutral ISM in Starburst Galaxies ASP Conference Series, Vol. 320, pg. 230
- (33) Scoville N. Z., Yun M., Bryant P. M. 1997, ApJ, 484, 702
- (34) Shirley Y. L., Evans N. J., Young K. E., Knez C., & Jaffe D. T. 2003, ApJS, 149, 375
- (35) Solomon P. M., Radford S. J. E. & Downes D. 1990, ApJ, 348, L53
- (36) Solomon P. M., Downes D., & Radford S. J. E. 1992, ApJ, 387, L55
- (37) Solomon P. M., Downes D., Radford S. J. E., & Barrett J. W. 1997, ApJ, 478, 144
- (38) Soifer B. T., Neugebauer G., Helou G. et al. 1984, ApJ, 283, L1
- (39) Tacconi L. J., Neri R., Chapman S. C., et al. 2006, ApJ, 640, 228
- (40) Walter F., & Carilli C. 2008, in Science with the Atacama Large Millimeter Array Ap&SS, 313, 313
- (41) Weiss A., Walter F., & Scoville N. Z. 2004, in The Neutral ISM in Starburst Galaxies ASP Conference Series, Vol. 320, pg. 142
- (42) Wild W., Harris A. I., & Eckart A. 1992, A&A, 265, 447
- (43) Young J. S., Kenney J., Lord S. D., Schloerb F. P. 1984, ApJ, 287, L65