Local transition gradients determine the global attributes of protein energy landscapes
Abstract
The dynamical characterization of proteins is crucial to understand protein function. From a microscopic point of view, protein dynamics is governed by the local atomic interactions that, in turn, trigger the functional conformational changes. Unfortunately, the relationship between local atomic fluctuations and global protein rearrangements is still elusive. Here, atomistic molecular dynamics simulations in conjunction with complex network analysis show that fast peptide relaxations effectively build the backbone of the global free-energy landscape, providing a connection between local and global atomic rearrangements. A minimum-spanning-tree representation, built on the base of transition gradients networks, results in a high resolution mapping of the system dynamics and thermodynamics without requiring any a priori knowledge of the relevant degrees of freedom. These results suggest the presence of a local mechanism for the high communication efficiency generally observed in complex systems.
In complex systems the behavior of the whole is hardly predictable from the fundamental laws of interactions of the single components anderson1972 . Indeed, it is hard to reveal the intimate connection between the local properties of a complex system and its global behavior. This problem has been formalized in the context of complex networks boguna2008 as a question of “navigability”; i.e., the mechanism for the efficient flow of information when the single network nodes do not have a global view of the overall topology. As a matter of fact, many collective dynamical processes are driven by the presence of (usually hidden) local gradients toroczkai2004 .
The study of protein dynamics involve a similar problem – the coupling between the fast atomic fluctuations, which are local, and the slow conformational changes, which are global frauenfelder1991 . Those dynamical aspects have been recently recognized to be crucial for protein function, playing an important role in signalling, allosteric pathways and enzymatic reactions kern2003 ; eisenmesser2005 . Molecular dynamics (MD) simulations are playing an increasing role in complementing the experimental results boehr2006 ; schuler2008 ; colletier2008 which supply useful , but limited, information to this question. The recent combination of computational and experimental studies of a protein enzyme has pointed out that the fast atomic fluctuations are partly correlated to the displacements occuring in the catalytic reaction henzler2007 . As yet, the coupling between the fast nanosecond timescales and the functional relevant transitions occuring in the microsecond to millisecond range largely remains obscure.
Most descriptions of the free-energy surface governing protein dynamics have been rather qualitative because of the lack of proper order parameters and the intrinsic multidimensionality of the problem du1998 ; pande1998 . These limitations have triggered the development of a completely new arsenal of tools inspired by network theory caflisch2006 . The essential idea is to map the protein trajectory, obtained by computer simulations or experiments, on a conformation space network (CSN), whose nodes represent the different microstates and whose links correspond to direct transitions between them rao2004 ; caflisch2006 ; gfeller2007 . This approach has been successfully applied to the study of peptide folding and structural transitions rao2004 ; krivov2004 ; gfeller2007 ; settanni2008 ; yang2008 ; prada2009 , as well as to interpret electron transfer experiments li2008 and time-resolved IR measurements ihalainen2007 ; ihalainen2008 .
In this letter, the relation between the local properties of the free-energy landscape and its global architecture is investigated by MD simulations of a 4 residues peptide, (GlySer)2, and complex network analysis . In particular, when the CSN of a fully-atomistic peptide is reduced to the subgraph containing only one link per microstate pointing towards the most probable transition (i.e. following the transition gradient), the presence of energy valleys and subvalleys and their equilibrium populations is naturally extracted as well as the hierarchy of transitions between them. Hence, the fast local motions build up the backbone of the global communication. The observed coupling between local and global dynamical properties is expected to occur in a large class of complex systems.
GlySer peptides have been used for quite some time as flexible linkers (and are known to show poor secondary structure) for polypeptide dynamics bieri1999 ; moglich2006 . MD simulations using the Langevin algorithm 111MD simulations, using the Langevin algorithm with a friction coefficient equal to 0.6 , were calculated with the CHARMM program charmm2009 , the polar hydrogen energy function (PARAM19) was used. The effects of water have been included using the generalized born FACTS implicit solvation model haberthur2008 . SHAKE was employed so that an integration step of 2 fs could be used. and the implicit solvation FACTS haberthur2008 ; charmm2009 have been performed. A trajectory of 280 ns at 340 K was obtained and snapshots were saved every 140 steps for a total of conformations. During the simulation the peptide visits several different conformations characterized by an end-to-end distance between 3.1 and 12.7 Å (Fig. 1) indicating large structural fluctuations.
The peptide microstates are defined as the inherent structures (IS), i.e. the potential energy minima, of the system stillinger1982 ; stillinger1983 . They are calculated minimizing all the snapshots along the trajectory, resulting in 3044 different IS. The IS are a natural, physically meaningfull, partition into microstates baumketner2003 ; kim2007 ; rao2010 . The conformation space network (CSN) is built on top of this microstate definition: the nodes and the links are the microstates (i.e. the IS) and their direct transitions observed during the MD trajectory, respectively. The obtained network is weighted and it is equivalent to a classical transition matrix when the columns of the adjacency matrix (i.e. the network links) are appropriately normalized to one.

The relation between fast local modes and global chain rearrangements is investigated by constructing from the full CSN, a new network with a reduced number of links. For each network node, the transition with the highest probability (excluding self interactions) is kept, and all others are deleted. These transitions define a gradient in the network dynamics and result in a partitioning of the network into several disconnected minimum spanning trees carmi2008 , called here gradient-clusters for convenience. (Gradient networks were originally introduced by Toroczkai and Bassler to study jamming toroczkai2004 , though in their case the gradient is defined on the nodes as a quenched scalar field). Following the pathway defined by the most probable transitions leads to microstates lower and lower in free energy, resulting in a kind of “steepest descent pathway” on the free-energy surface. High energy microstates, in the neighbor of a free-energy barrier, would connect either to one valley or another. As a matter of fact, the network characterizing the free-energy surface is split into a set of disconnected minimum-spanning-trees representing the local attractors of the system dynamics.
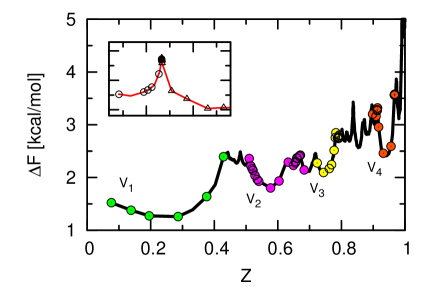
To better understand the nature of the gradient-clusters (161 in total), a cut-based free-energy profile (CFEP) krivov2006 is calculated on the CSN and compared to the output of the gradient-partition. The CFEP is based on a network flux analysis following the idea that the network regions of minimum flow correspond to transition states krivov2006 ; krivov2008 ; muff2009 . In Fig. 2 the calculated CFEP is shown. The profile reveals that the peptide free-energy landscape is rugged. Remarkably, the obtained gradient-clusters represent either a valley or a subvalley of the free-energy landscape (Fig. 2). In Table 1 the population of the four most relevant free-energy basins detected by the gradient-approach is compared against the populations calculated by the minimum-cut method krivov2004 , which is one of the most accurate approaches for this type of calculation caflisch2006 . The results indicate that the populations of the gradient-clusters are accurate, effectively reproducing the correct thermodynamics of the system. This is particularly relevant since the gradient-approach does not use any global property of the system, neither in terms of barrier heights or microstates energies. On the other hand, the CFEP and the minimum-cut method do perform a global analysis of the network. These observations suggest an interesting application of the proposed approach to automatically detect the presence of metastable states sampled by multiple short MD runs with the aim of building simplified Markov models chodera2007 .
| Valley |
Gradient
population 111To take into account of the entropic effects, gradient-clusters separated by free-energy barriers smaller than have been merged. |
Mincut
population |
[Å] |
| 0.429 | 0.428 | 4.167 | |
| 0.120 | 0.120 | 4.253 | |
| 0.068 | 0.064 | 10.960 | |
| 0.037 | 0.051 | 4.160 |
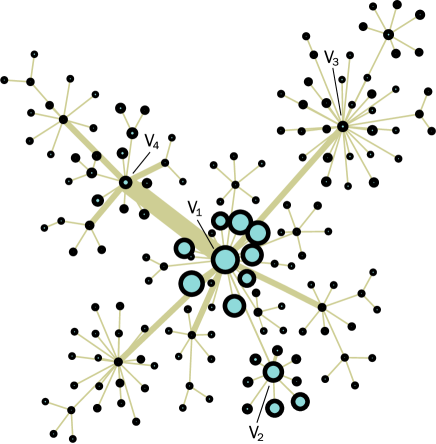
The gradient-approach can be applied in an iterative, heirarchical fashion, when the gradient-clusters are considered themselves as nodes of a higher level CSN. In this case, the nodes and the links of the network are the gradient-clusters and the connections between them, respectively. The iteration can be applied recursively until all the microstates are merged into one cluster, which is represented as a minimum-spanning-forest. The tree structure obtained for the (GlySer)2 peptide is shown in Fig. 3. Link widths represent at which iteration step the edge was introduced. For example, the and valleys are merged at the first iteration, indicating that they interconvert rapidly. On the other hand, is merged to at the fourth iteration indicating that this is the slowest transition to . The gradient-minimum-spanning-forest represents, in an intrinsically multidimensional fashion, the valleys of the free-energy landscape and their dynamical organization in fast and slow relaxations. The iteration step at which two gradient-clusters are merged together is a kinetic mesaure of the dynamical distance between the two valleys.
Concluding, we found that, for an all-atom peptide MD simulation, the fast local relaxations produce a partition of the conformational space into disconnected minimum-spanning-trees. This partition reproduces the organization of the free-energy landscape into valleys and subvalleys with the correct populations. The iterative connection of those valleys into a minimum-spanning-forest recovers the global backbone architecture of the dynamics occuring on the free-energy landscape. A similar coupling between local and global dynamics is expected to take place in other complex systems. These results are relevant to investigate the still unclear relationship between network structure and dynamics in transport processes ranging from metabolic pathways to air-travelling and the internet.
Acknowledgments
I am grateful to Prof. A. Caflisch, Prof. M. Karplus, Dr S. Muff, Dr. S. Krivov, Dr. M. Cecchini for useful comments and discussions and Prof. P. Hamm, Dr. S. Garrett-Roe for a critical reading of the manuscript.
References
- (1) P. Anderson, Science 177, 393 (1972)
- (2) M. Boguñá, D. Krioukov, and K. Claffy, Nature Physics 5, 74 (2008)
- (3) Z. Toroczkai and K. Bassler, Nature, 716(2004)
- (4) H. Frauenfelder, S. Sligar, and P. Wolynes, Science 254, 1598 (Dec 1991)
- (5) D. Kern and E. R. Zuiderweg, Curr Opin Struct Biol 13, 748 (2003)
- (6) E. Z. Eisenmesser, O. Millet, W. Labeikovsky, D. M. Korzhnev, M. Wolf-Watz, D. A. Bosco, J. J. Skalicky, L. E. Kay, and D. Kern, Nature 438, 117 (2005)
- (7) D. D. Boehr, D. McElheny, H. J. Dyson, and P. E. Wright, Science 313, 1638 (2006)
- (8) B. Schuler and W. A. Eaton, Curr Opin Struct Biol 18, 16 (2008)
- (9) J. P. Colletier, D. Bourgeois, B. Sanson, D. Fournier, J. L. Sussman, I. Silman, and M. Weik, Proc Natl Acad Sci U S A 105, 11742 (2008)
- (10) K. A. Henzler-Wildman, M. Lei, V. Thai, S. J. Kerns, M. Karplus, and D. Kern, Nature 450, 913 (2007)
- (11) R. Du, V. Pande, A. Grosberg, T. Tanaka, and E. Shakhnovich, J. Chem. Phys. 108, 334 (1998)
- (12) V. Pande, A. Grosberg, T. Tanaka, and D. Rokhsar, Curr. Opin. Struct. Biol. 8, 68 (1998)
- (13) A. Caflisch, Curr Opin Struct Biol 16, 71 (2006)
- (14) F. Rao and A. Caflisch, J. Mol. Biol. 342, 299 (2004)
- (15) D. Gfeller, P. De Los Rios, A. Caflisch, and F. Rao, Proc Natl Acad Sci U S A 104, 1817 (2007)
- (16) S. Krivov and M. Karplus, Proc. Natl. Acad. Sci. USA 101, 14766 (Oct 2004)
- (17) G. Settanni and A. R. Fersht, Biophys J 94, 4444 (2008)
- (18) S. Yang and B. Roux, PLoS Computational Biology 4 (2008)
- (19) D. Prada-Gracia, J. Gómez-Gardeñes, P. Echenique, and F. Falo, PLoS computational biology 5, e1000415 (2009)
- (20) C. B. Li, H. Yang, and T. Komatsuzaki, Proc Natl Acad Sci U S A 105, 536 (2008)
- (21) J. A. Ihalainen, J. Bredenbeck, R. Pfister, J. Helbing, L. Chi, I. H. van Stokkum, G. A. Woolley, and P. Hamm, Proc Natl Acad Sci U S A 104, 5383 (2007)
- (22) J. A. Ihalainen, B. Paoli, S. Muff, E. H. Backus, J. Bredenbeck, G. A. Woolley, A. Caflisch, and P. Hamm, Proc Natl Acad Sci U S A 105, 9588 (2008)
- (23) O. Bieri, J. Wirz, B. Hellrung, M. Schutkowski, M. Drewello, and T. Kiefhaber, Proc. Nat. Acad. Sci. USA 96, 9597 (1999)
- (24) A. Möglich, K. Joder, and T. Kiefhaber, Proc. Nat. Acad. Sci. 103, 12394 (2006)
- (25) MD simulations, using the Langevin algorithm with a friction coefficient equal to 0.6 , were calculated with the CHARMM program charmm2009 , the polar hydrogen energy function (PARAM19) was used. The effects of water have been included using the generalized born FACTS implicit solvation model haberthur2008 . SHAKE was employed so that an integration step of 2 fs could be used.
- (26) U. Haberthur and A. Caflisch, J Comput Chem 29, 701 (2008)
- (27) B. R. Brooks, C. L. Brooks, 3rd, A. D. Mackerell, Jr, L. Nilsson, R. J. Petrella, B. Roux, Y. Won, G. Archontis, C. Bartels, S. Boresch, A. Caflisch, L. Caves, Q. Cui, A. R. Dinner, M. Feig, S. Fischer, J. Gao, M. Hodoscek, W. Im, K. Kuczera, T. Lazaridis, J. Ma, V. Ovchinnikov, E. Paci, R. W. Pastor, C. B. Post, J. Z. Pu, M. Schaefer, B. Tidor, R. M. Venable, H. L. Woodcock, X. Wu, W. Yang, D. M. York, and M. Karplus, J Comput Chem 30, 1545 (2009)
- (28) F. Stillinger and T. Weber, Phys. Rev. A 25, 978 (Feb 1982)
- (29) F. Stillinger and T. Weber, Physical Review A 28, 2408 (1983)
- (30) A. Baumketner, J.-E. Shea, and Y. Hiwatari, Phys. Rev. E 67, 011912 (Jan 2003)
- (31) J. Kim and T. Keyes, J. Phys. Chem. B 111, 2647 (2007)
- (32) F. Rao and M. Karplus, to be published(2010)
- (33) S. Carmi, P. Krapivsky, and D. Ben-Avraham, Phys. Rev. E 78, 66111 (2008)
- (34) S. V. Krivov and M. Karplus, J. Phys. Chem. B 110, 12689 (2006), ISSN 1520-6106 (Print)
- (35) S. V. Krivov, S. Muff, A. Caflisch, and M. Karplus, J Phys Chem B 112, 8701 (2008)
- (36) S. Muff and A. Caflisch, J. Chem. Phys. 130, 125104 (2009)
- (37) J. Chodera, N. Singhal, V. Pande, K. Dill, and W. Swope, J. Chem. Phys. 126, 155101 (2007)