Tuning Message Size in Opportunistic Mobile Networks
Abstract
We describe a new model for studying intermittently connected mobile networks, based on Markovian random temporal graphs, that captures the influence of message size, maximum tolerated delay and link stability on the delivery ratio.
category:
C.2.1 Network Architecture and Design Store and Forward Networkscategory:
C.4 Performance of Systems Modeling Techniqueskeywords:
Delay Tolerant Networks, Random Temporal Graphs, Message Size, Delivery Ratio1 Introduction
The topology of a real-life network of mobile handheld devices evolves over time as links come up and down. Successive snapshots of the evolving connectivity graph yields a temporal graph, a time-indexed sequence of traditional static graphs. These present a number of new interesting metrics. For example, there might exist a space-time path between two vertices even if there never exists an end to end path between them at any given moment. Since such temporal graphs appear naturally when analyzing connectivity traces in which nodes periodically scan for neighbors, their theoretical study is important for understanding the underlying network dynamics.
Modeling temporal networks using random graphs is a relatively unexplored field. Simple sequences of independent regular random graphs are used in [1] to analyze the diameter of opportunistic mobile networks. The notion of connectivity over time is explored in [2] but looses any information about the order in which contact opportunities appear.
In this paper, we improve upon previous work, by capturing the strong real-life correlation between the connectivity graphs at times and . Since we will be examining how the message size influences the delivery ratio, it is crucial to model link stability, i.e., the probability that a link up at time remains so at time . In order to capture these correlations, we propose a Markovian temporal graph model.
2 Model
| Number of nodes | Maximum delay | ||
| Time step | Average link lifetime | ||
| Packet size | fraction of time a link is down |
We consider temporal graphs of mobile nodes that evolve in discrete time. The time step is equal to the shortest contact or inter-contact time. In a real-life trace, will be equal to the sampling period. The only differences between successive time steps will be which links are up and which are down. They can come up or go down at the beginning of each time step, but the topology then remains static until the next time step.
Each of the potential links is considered independent and is modeled as a two-state ( or ) Markov chain. The evolution of the entire connectivity graph can also be described as a Markov chain on the tensor product of the state spaces of all links.
We note the average number of time steps that a link spends in the state, and the fraction of time that a link spends in the state. In a sense, measures the evolution speed of the network’s topology while is related to its density. The average link lifetime is by definition while the average node degree is .
When up, all links share the same capacity and thus can transport the same quantity of information during one time step. We will refer to as the link size. Message size is equal to where can be greater or smaller than . By abuse of language, we will refer to as the message size. For example, a message of size () will only be able to traverse links that last for more than time steps, whereas a message of size , will be able to perform two hops during each time step. The message size thus defined is numerically proportional to .
Small values of mean that the network topology’s characteristic evolution time is short and thus only small amounts of information may be transmitted over a link during one time step. Furthermore we suppose than a mobile application can only tolerate a given delay in message delivery. We note the maximum delay beyond which a delivery is considered to have failed.
3 Results
Using this model, we can derive the delivery ratio of a message using epidemic routing for , as well as upper and lower bounds when . To be successful, the delivery has to occur without exceeding the maximum allowed delay. Epidemic routing is useful for theoretical purposes, since its delivery ratio is also that of the optimal single-copy time-space routing protocol.
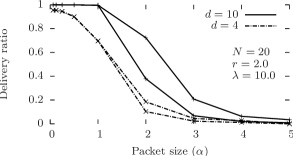
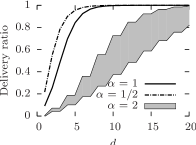
Message size. (Fig. 1) Messages larger than the link size see their delivery probability severely degraded, though this is somewhat mitigated by longer maximum delays. On the other hand, messages smaller than the link size are able of making several hops in a single time step. This is a great advantage when the time constraints are particularly tight ( in Fig. 1), but barely has any effect when the time constraints are looser. This also highlights the influence of node mobility. Indeed, since the actual message size is proportional to , high node mobility (i.e. small ) makes the actual link size smaller and thus further constrains possible message size.
Furthermore, the gain achieved by using small messages is bounded because because it hits the performance limit of epidemic routing. Indeed, the best possible epidemic diffusion of a message will, at each time step, infect a whole connected component if at least one of its nodes is infected. A small enough packet can spread sufficiently quickly to achieve this, and thus even smaller packets bring no performance gain ( in Fig. 1).
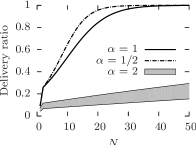
Number of nodes. (Fig. 2a) The delivery ratio tends to as increases. Indeed, for a given source/destination pair, each new node is a new potential relay in the epidemic dissemination and thus can only help the delivery ratio.
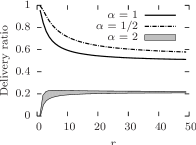
Average link lifetime. (Fig. 2b) Shorter average link lifetimes make for a more dynamic network topology. Indeed smaller values of make for shorter contact and inter-contact times and increases contact opportunities. Small messages () take advantage of this and their delivery ratio increases as decreases. On the other hand, excessive link instability drives the delivery ratio for larger messages () to 0, because fewer links last longer than one time step.
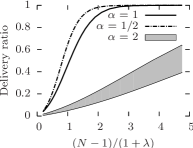
Average node degree. (Fig. 2c) Greater connectivity increases the delivery probability. The sharp slope of the curve when is reminiscent of percolation in random graphs when the average node degree hits .
Maximum Delay. (Fig. 2d) All else being equal, there is clearly a threshold value beyond which almost all messages are delivered. This can be linked to the space-time diameter of the underlying topology [1].
Experimental results. We measured the delivery ratio achieved by various message sizes by replaying a real-life wireless mobility trace (Rollernet [3]). Although our model may not be quantitatively comparable to real-life traces due to unwanted small-world properties, it accurately predicts the relations between delivery ratio, maximum delay and message size.
4 Conclusion
In this paper, we proposed a new model of random temporal graphs that, for the first time, captures the correlation between successive connectivity graph, and provides insights on the interaction between node mobility, maximum delay and message size. In particular, we have shown that, given a certain maximum delay and node mobility, message size has a major impact on the delivery ratio. These results, which we reproduced by replaying a real-life connectivity trace, should be taken into consideration when designing and implementing services for mobile handhelds.
References
- [1] A. Chaintreau, A. Mtibaa, L. Massoulie, and C. Diot. The diameter of opportunistic mobile networks. In CoNEXT ’07: Proceedings of the 2007 ACM CoNEXT conference, 2007.
- [2] F. De Pellegrini, D. Miorandi, I. Carreras, and I. Chlamtac. A graph-based model for disconnected ad hoc networks. In INFOCOM 2007. 26th IEEE International Conference on Computer Communications. IEEE, 2007.
- [3] P.-U. Tournoux, J. Leguay, F. Benbadis, V. Conan, M. D. de Amorim, and J. Whitbeck. The accordion phenomenon: Analysis, characterization, and impact on dtn routing. In Proc. IEEE Infocom, 2009.