Convection and 6Li in the atmospheres of metal-poor halo stars
Abstract
Based on 3D hydrodynamical model atmospheres computed with the CO5BOLD code and 3D non-LTE (NLTE) line formation calculations, we study the effect of the convection-induced line asymmetry on the derived 6Li abundance for a range in effective temperature, gravity, and metallicity covering the stars of the [Asplund et al. (2006), Asplund et al. (2006)] sample. When the asymmetry effect is taken into account for this sample of stars, the resulting 6Li/7Li ratios are reduced by about 1.5% on average with respect to the isotopic ratios determined by [Asplund et al. (2006), Asplund et al. (2006)]. This purely theoretical correction diminishes the number of significant 6Li detections from 9 to 4 (2 criterion), or from 5 to 2 (3 criterion). In view of this result the existence of a 6Li plateau appears questionable. A careful reanalysis of individual objects by fitting the observed lithium Å doublet both with 3D NLTE and 1D LTE synthetic line profiles confirms that the inferred 6Li abundance is systematically lower when using 3D NLTE instead of 1D LTE line fitting. Nevertheless, halo stars with unquestionable 6Li detection do exist even if analyzed in 3D-NLTE, the most prominent example being HD 84937.
keywords:
stars: abundances, stars: atmospheres, hydrodynamics, convection, radiative transfer, line: formation, line: profiles, stars: individual (G271-162, HD 74000, HD 84937)1 Introduction
The spectroscopic signature of the presence of 6Li in the atmospheres of metal-poor halo stars is a subtle extra depression in the red wing of the 7Li doublet, which can only be detected in spectra of the highest quality. Based on high-resolution, high signal-to-noise VLT/UVES spectra of 24 bright metal-poor stars, [Asplund et al. (2006), Asplund et al. (2006)] report the detection of 6Li in nine of these objects. The average 6Li/7Li isotopic ratio in the nine stars in which 6Li has been detected is about 4% and is very similar in each of these stars, defining a 6Li plateau at approximately Li (on the scale H). A convincing theoretical explanation of this new 6Li plateau turned out to be problematic: the high abundances of 6Li at the lowest metallicities cannot be explained by current models of galactic cosmic-ray production, even if the depletion of 6Li during the pre-main-sequence phase is ignored (see reviews by e.g. [Christlieb (2008), Christlieb 2008], [Cayrel et al. (2008), Cayrel et al. 2008], Prantzos 2010 [this volume] and references therein).
A possible solution of the so-called ‘second Lithium problem’ was proposed by [Cayrel et al. (2007), Cayrel et al. (2007)], who point out that the intrinsic line asymmetry caused by convection in the photospheres of metal-poor turn-off stars is almost indistinguishable from the asymmetry produced by a weak 6Li blend on a presumed symmetric 7Li profile. As a consequence, the derived 6Li abundance should be significantly reduced when the intrinsic line asymmetry in properly taken into account. Using 3D NLTE line formation calculations based on 3D hydrodynamical model atmospheres computed with the CO5BOLD code ([Freytag et al. (2002), Freytag et al. 2002], [Wedemeyer et al. (2004), Wedemeyer et al. 2004], see also http://www.astro.uu.se/bf/co5bold_main.html), we quantify the theoretical effect of the convection-induced line asymmetry on the resulting 6Li abundance as a function of effective temperature, gravity, and metallicity, for a parameter range that covers the stars of the [Asplund et al. (2006), Asplund et al. (2006)] sample.
A careful reanalysis of individual objects is under way,
in which we consider two alternative approaches for
fixing the residual line broadening, , the combined
effect of macroturbulence (1D only) and instrumental broadening, for
given microturbulence (1D only) and rotational velocity:
(i) treating as a free parameter when fitting the Li feature,
(ii) deriving from additional unblended spectral lines with
similar properties as Li I . We show that method (ii) is potentially
dangerous, because the inferred broadening parameter shows considerable
line-to-line variations, and the resulting 6Li abundance depends rather
sensitively on the adopted value of .
2 3D hydrodynamical simulations and spectrum synthesis
The hydrodynamical atmospheres used in the present study are part of the CIFIST 3D model atmosphere grid ([Ludwig et al. (2009), Ludwig et al. 2009]). They have been obtained from realistic numerical simulations with the CO5BOLD code which solves the time-dependent equations of compressible hydrodynamics in a constant gravity field together with the equations of non-local, frequency-dependent radiative transfer in a Cartesian box representative of a volume located at the stellar surface. The computational domain is periodic in and direction, has open top and bottom boundaries, and is resolved by typically 140140150 grid cells. The vertical optical depth of the box varies from (top) to (bottom), and the radiative transfer is solved in 6 or 12 opacity bins. Further information about the models used in the present study is compiled in Table 1. Each of the models is represented by a number of snapshots, indicated in column (6), chosen from the full time sequence of the corresponding simulation.
These representative snapshots are processed by the non-LTE code NLTE3D that
solves the statistical equilibrium equations for a 17 level lithium atom with
34 line transitions, fully taking into account the 3D thermal structure of
the respective model atmosphere. The photo-ionizing radiation field is
computed at frequency points between and 32 407 Å,
using the opacity distribution functions of [Castelli & Kurucz (2004)] to allow for
metallicity-dependent line-blanketing, including the H I–H+ and
H I–H I quasi-molecular absorption near and Å,
respectively. Collisional ionization by neutral hydrogen via the charge
transfer reaction
H() + Li() Li+() + H- is
treated according to [Barklem, et al. (2003)]. More details are given in
[Sbordone et al. (2009)]. Finally, 3D NLTE synthetic line profiles of the
Li I Å doublet are computed with the line formation code
Linfor3D (http://www.aip.de/mst/linfor3D_main.html), using
the departure coefficients =
provided by NLTE3D for each level of the lithium model atom as a function
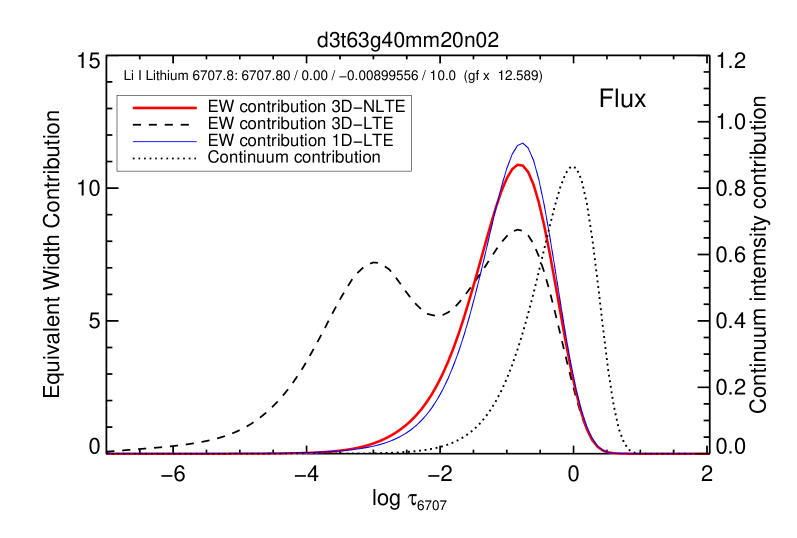
of geometrical position within the 3D model atmospheres. As demonstrated in
Fig. 1, 3D NLTE effects are very important for the metal-poor
dwarfs considered here: they strongly reduce the height range of line
formation such that the 3D NLTE equivalent width is smaller by roughly a
factor 2 compared to 3D LTE. Ironically, the line strength predicted by
standard 1D mixing-length models in LTE are close to the results obtained
from elaborate 3D NLTE calculations. We note that the half-width of the 3D
NLTE line profile, FWHM(NLTE) = 8.5 km/s, is larger by about 10%:
FWHM(LTE) = and km/s, respectively, before and after reducing
the Li abundance such that 3D LTE and 3D NLTE equivalent widths agree.
This is because 3D LTE profile senses the higher photosphere where both
thermal and hydrodynamical velocities are lower. However, the NLTE
line profile is significantly less asymmetric than the LTE
profile, even if the latter is broadened to the same half-width
(Fig. 1, bottom panel).
| Model | [Fe/H] | Nbin | Nsnap | W2) | = n(6Li)/n(7Li) | n(6Li)/n(7Li) | ||
| [K] | [mÅ] | 3D NLTE [%] | 1D LTE [%] | |||||
| d3t59g40mm30n02 | -3.0 | 20 | 44.9 | 1.14 / 1.14 | 0.88 / 0.88 | |||
| d3t59g45mm30n01 | -3.0 | 19 | 39.9 | 0.75 / 0.75 | 0.63 / 0.64 | |||
| d3t63g40mm30n01 | -3.0 | 20 | 23.9 | 1.96 / 1.93 | 1.86 / 1.83 | |||
| d3t63g40mm30n02 | -3.0 | 20 | 24.1 | 1.81 / 1.80 | 1.63 / 1.62 | |||
| d3t63g45mm30n01 | -3.0 | 18 | 24.3 | 1.07 / 1.06 | 1.02 / 1.00 | |||
| d3t65g40mm30n01 | -3.0 | 20 | 20.0 | 1.75 / 1.70 | 1.70 / 1.66 | |||
| d3t65g45mm30n01 | -3.0 | 12 | 16.4 | 1.29 / 1.27 | 1.25 / 1.22 | |||
| d3t59g35mm20n01 | -2.0 | 20 | 42.8 | 2.48 / 2.44 | 2.02 / 2.01 | |||
| d3t59g40mm20n02 | -2.0 | 20 | 45.2 | 1.59 / 1.59 | 0.96 / 0.98 | |||
| d3t59g45mm20n01 | -2.0 | 18 | 42.3 | 1.12 / 1.13 | 0.45 / 0.46 | |||
| d3t63g35mm20n01 | -2.0 | 20 | 22.1 | 4.09 / 4.00 | 4.04 / 3.97 | |||
| d3t63g40mm20n01 | -2.0 | 16 | 23.7 | 1.95 / 1.94 | 1.79 / 1.78 | |||
| d3t63g40mm20n02 | -2.0 | 20 | 25.1 | 1.92 / 1.92 | 1.66 / 1.67 | |||
| d3t63g45mm20n01 | -2.0 | 19 | 23.0 | 1.18 / 1.18 | 0.97 / 0.97 | |||
| d3t65g40mm20n01 | -2.0 | 19 | 16.2 | 2.28 / 2.21 | 2.22 / 2.16 | |||
| d3t65g45mm20n01 | -2.0 | 19 | 17.0 | 1.31 / 1.29 | 1.21 / 1.19 | |||
| d3t59g40mm10n02 | -1.0 | 20 | 41.5 | 1.60 / 1.62 | 1.45 / 1.47 | |||
| d3t59g45mm10n01 | -1.0 | 08 | 38.2 | 1.14 / 1.15 | 0.83 / 0.85 | |||
| d3t63g40mm10n01 | -1.0 | 20 | 22.0 | 2.37 / 2.38 | 2.33 / 2.33 | |||
| d3t63g40mm10n02 | -1.0 | 20 | 21.8 | 2.15 / 2.16 | 2.05 / 2.06 | |||
| d3t63g45mm10n01 | -1.0 | 20 | 23.4 | 1.36 / 1.37 | 1.23 / 1.24 | |||
| d3t65g40mm10n01 | -1.0 | 20 | 15.5 | 3.10 / 3.02 | 3.14 / 3.06 | |||
| d3t65g45mm10n01 | -1.0 | 19 | 17.1 | 1.51 / 1.51 | 1.44 / 1.43 |
Notes: 1) averaged over selected snapshots; 2) averaged over selected 3D non-LTE spectra
3 6Li bias due to convective line asymmetry
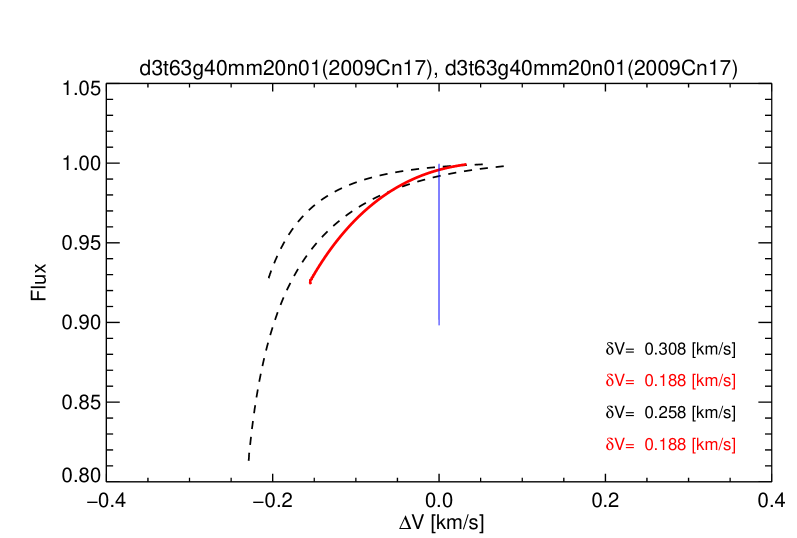
As outlined above, the 6Li abundance is systematically overestimated if one ignores the intrinsic asymmetry of the 7Li line components. To quantify this bias theoretically, we rely on synthetic spectra. The idea is as follows: we represent the observation by the synthetic 3D NLTE line profile of the 7Li line blend, computed with zero 6Li content. Except for an optional rotational broadening, the only source of non-thermal line broadening is the 3D hydrodynamical velocity field, which also gives rise to a convective blue-shift and an intrinsic line asymmetry. Now this 3D 7Li line blend is fitted by ’classical’ 1D synthetic line profiles composed of intrinsically symmetric components of 6Li and 7Li. Four parameters are varied independently to find the best fit (minimum ): in addition to the total 6Li+7Li abundance, (Li), and the 6Li/7Li isotopic ratio, (Li), which control line strength and line asymmetry, respectively, we also allow for a residual line broadening described by a Gaussian kernel with half-width , and a global line shift, . Note that the four fitting parameters are non-degenerate, since each one has a distinctly different effect on the line profile. The rotational line broadening is fixed to the value used in the 3D spectrum synthesis (we tried and km/s). The value (Li) of the best fit is then identified with the correction that has to be subtracted from the 6Li/7Li isotopic ratio derived from the 1D analysis to correct for the bias introduced by neglecting the intrinsic line asymmetry: (Li) = (Li) - (Li). The procedure properly accounts for radiative transfer in the lines, including saturation effects.
Two different sets of 1D profiles were used for this purpose: (a) NLTE line profiles based on the 3D model, constructed by averaging the 3D model on surfaces of constant optical depth, and (b) LTE line profiles computed from a so-called LHD model, a 1D mixing-length model atmosphere that has the same stellar parameters and uses the same microphysics and radiative transfer scheme as the corresponding 3D model. For both kind of 1D models, the microturbulence was fixed at km/s. The mixing length parameter adopted for the LHD models is .
We have determined (Li) according to the method outlined above for our grid of 3D model atmospheres. The results are given in Table 1, both for fitting with the 3D NLTE profiles ((Li), col. (8)) and with the 1D LTE profiles of the LHD models ((Li), col. (9)). At given metallicity, the corrections are largest for low gravity and high effective temperature. They increase towards higher metallicity. We also note that (Li) is essentially insensitive to the choice of the rotational broadening.
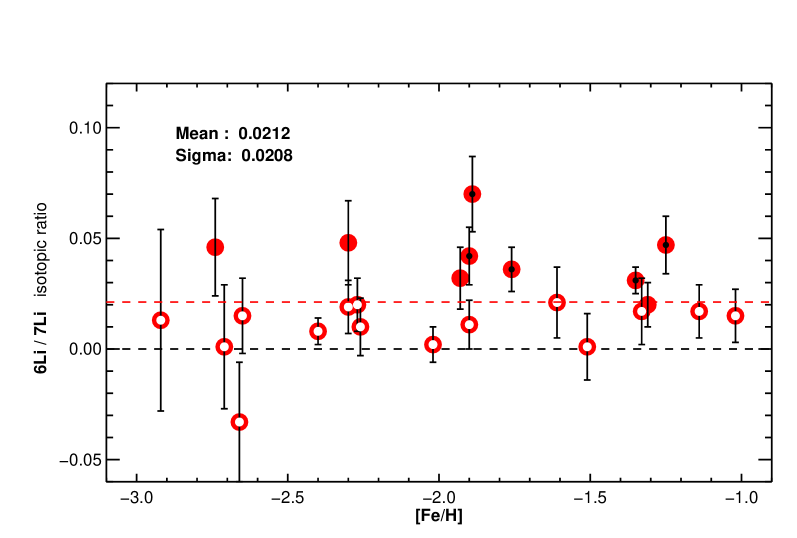
The analysis of [Asplund et al. (2006)] utilizes 1D LTE profiles computed from
MARCS model atmospheres. Hence, the correction (Li),
computed with the 1D LTE profiles of the 1D LHD models, should be applied
to their 6Li/7Li isotopic ratios. The resulting downward corrections
are typically in the range (Li) for the
stars of their sample (cf. [Steffen et al. (2010), Steffen et al. 2010], Fig. 2).
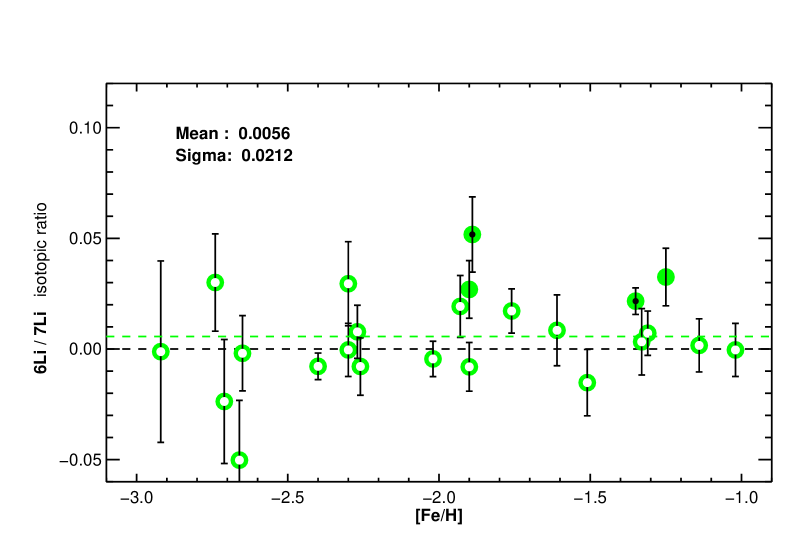
After subtracting the individual (Li) for each of these
stars, according to their , , and [Fe/H],
the mean 6Li/7Li isotopic ratio of the sample is
reduced from to , as illustrated in Fig. 2.
Given the 6Li/7Li isotopic ratios and their error bars
as determined by [Asplund et al. (2006)], the number of stars with a 6Li detection
above the 2 and 3 level is 9 and 5, respectively, out of
24. After correction, the number of 2 and 3 detections
is reduced to 4 and 2, respectively. One of the stars meeting the 3
criterion after correction, HD 106038, survives only because of its
particularly small error bar of . The other one is
G020-024, which shows the clearest evidence for the presence of 6Li
((Li) ), while HD 102200 remains the only clear
2 detection ((Li) ). The spectra of these stars
should be reanalyzed with 3D NLTE line profiles.
| Star | [K] | [Fe/H] | R= | S/N | Instrument | Reference | |
|---|---|---|---|---|---|---|---|
| HD 74000 | -2.05 | ESO3.6 / HARPS | Cayrel et al. 2007 | ||||
| G271162 | -2.25 | VLT / UVES | Nissen et al. 2000 | ||||
| HD 84937 | -2.30 | CFHT / GECKO | Cayrel et al. 1999 |
4 Analysis of observed spectra: 3D NLTE versus 1D LTE line fitting
As a further exercise, we have fitted the observed Li I Å spectra of three halo turn-off stars (see Table 2), both with 3D NLTE and 1D LTE synthetic line profiles. Since the parameters of these three stars are very similar, the synthetic spectra were computed in all cases from hydrodynamical model d3t6300g40mm20n01 (see Table 1) and the corresponding 1D LHD model. The standard approach is to vary the four parameters (Li), (Li), , and to find the optimum line profile fit, as described above (method I). The results are presented in Table 3. As expected, the 3D analysis yields lower 6Li/7Li isotopic ratios by about 1.7%. The numbers differ slightly from those given by [Steffen et al. (2010), Steffen et al. 2010] due to an upgrade of the line fitting procedure, but the conclusions remain unchanged: HD 74000 and G271162 are considered non-detections, while HD 84937 remains a clear 6Li detection with (Li) .
For completeness, Table 3 also shows the results of fitting the observed lines with 3D LTE synthetic profiles (not recommended). The 6Li abundances obtained in this way lie between the 3D NLTE and the 1D LTE results. It is not obvious why fitting with the more asymmetric 3D LTE profiles gives higher 6Li than fitting with the slightly more symmetric 3D NLTE profiles, but this is a robust result.
For HD 74000, we also tried an alternative approach (method II),
where is determined from other spectral lines,
and is then fixed during the fitting of the Li I Å feature. For this purpose, we rely on a set of 6 clean Fe I lines
with similar excitation potential between and eV:
the 5 lines of [Cayrel et al. (2007), Cayrel et al. (2007)], Table 1, plus
Fe I Å, eV. Their equivalent widths
range from to mÅ, embracing the strength of the
Li doublet. Fitting the 6 Fe I lines with 3D LTE synthetic line profiles,
we obtain (Fe) = km/s for
km/s, in close agreement with (Li)
inferred from the fitting of the Li I profile. This result may be
taken as an indication that, in contrast to Li, the selected Fe I
lines are not severely affected by departures from LTE. We note,
however, a trend of (Fe) increasing slightly with ,
which remains to be understood. If instead the Fe I lines are fitted
with 1D LTE synthetic profiles, we find (Fe) =
km/s, systematically lower than
(Li) by km/s. Fixing =(Fe),
the best fit of the Li I doublet implies (Li)=%,
which is % higher than with method I. Finally, Table 3
demonstrates that applying method II with 3D LTE fitting of Li I leads
to a severe overestimation of the 6Li/7Li isotopic ratio:
(Li) % compared to (Li)=%!
| Star | synthetic | fitting | (Li) | n(6Li)/n(7Li) | ||
|---|---|---|---|---|---|---|
| spectrum | method | [%] | [km/s] | [km/s] | ||
| HD 74000 | 3D NLTE | I | / | -1.1 / -1.1 | / | 0.64 / 0.64 |
| (3D LTE) | I | / | -0.4 / -0.5 | / | 0.66 / 0.67 | |
| 1D LTE | I | / | 0.6 / 0.6 | / | 0.43 / 0.43 | |
| 3D NLTE | II | / | -1.1 / -1.3 | 3.1 / 2.2 | 0.64 / 0.65 | |
| (3D LTE) | II | / | 4.6 / 4.2 | 3.1 / 2.2 | 0.46 / 0.47 | |
| 1D LTE | II | / | 1.7 / 1.7 | 5.6 / 5.1 | 0.39 / 0.39 | |
| G271162 | 3D NLTE | I | / | 0.7 / 0.6 | / | 0.04 / 0.04 |
| (3D LTE) | I | / | 1.3 / 1.1 | / | 0.06 / 0.07 | |
| 1D LTE | I | / | 2.3 / 2.4 | / | -0.17 / -0.17 | |
| HD 84937 | 3D NLTE | I | / | 5.2 / 5.2 | / | 0.02 / 0.02 |
| (3D LTE) | I | / | 5.8 / 5.7 | / | 0.05 / 0.05 | |
| 1D LTE | I | / | 6.9 / 6.9 | / | -0.19 / -0.19 |
Notes: 1) ; 2) Gaussian kernel, bold: fixed from Fe I lines
5 Conclusions
The 6Li/7Li isotopic ratio derived from fitting of the Li I doublet
with 3D NLTE synthetic line profiles is shown to be about 1% to
2% lower than what is obtained with 1D LTE profiles.
Based on this result, we conclude that only out of the
stars of the [Asplund et al. (2006)] sample would remain significant 6Li
detections when subjected to a 3D non-LTE analysis, suggesting that
the presence of 6Li in the atmospheres of galactic halo stars is
rather the exception than the rule, and hence does not necessarily
constitute a cosmological 6Li problem.
If we adopt the approach
by [Asplund et al. (2006)], relying on additional spectral lines to fix the
residual line broadening, the difference between 3D NLTE and 1D LTE results
increases even more, as far as we can judge from our case study HD 74000.
Until the 3D NLTE effects are fully understood for all involved lines,
we consider this method as potentially dangerous.
References
- [Asplund et al. (2006)] Asplund, M., Lambert, D. L., Nissen, P. E., Primas, F., & Smith, V. V. 2006, ApJ, 644, 229
- [Barklem, et al. (2003)] Barklem, P.S., Belyaev, A.K., Asplund, M. 2003, A&A, 409, L1
- [Castelli & Kurucz (2004)] Castelli, F., & Kurucz, R. L. 2004, arXiv:astro-ph/0405087
- [Cayrel et al. (1999)] Cayrel, R., Spite, M., Spite, F., Vangioni-Flam, E., Cassé, M., Audouze, J. 1999, A&A, 343, 923
- [Cayrel et al. (2007)] Cayrel, R., Steffen, M., Chand, H., Bonifacio, P., Spite, M., Spite, F., Petitjean, P., Ludwig, H.-G., & Caffau, E. 2007, A&A, 473, L37
- [Cayrel et al. (2008)] Cayrel, R., Steffen, M., Bonifacio, P., Ludwig, H.-G., Caffau, E. 2008, Nuclei in the Cosmos (NIC X), availale online at http://adsabs.harvard.edu/abs/2008nuco.confE…2C
- [Christlieb (2008)] Christlieb, N. 2008, Journal of Physics G: Nuclear Physics, 35, 014001
- [Freytag et al. (2002)] Freytag, B., Steffen, M., & Dorch, B. 2002, AN, 323, 213
- [Ludwig et al. (2009)] Ludwig, H.-G., Caffau, E., Steffen, M., Freytag, B., Bonifacio, P., & Kučinskas, A. 2009, MemSAI, 80, 708
- [Nissen et al. (2000)] Nissen, P.E., Asplund, M., Hill, V., D’Odorico, S. 2000, A&A 357, L49
- [Sbordone et al. (2009)] Sbordone, L., Bonifacio, P., Caffau, E., et al. 2009, A&A (in press)
- [Steffen et al. (2010)] Steffen, M., Cayrel, R., Boinfacio, P., Ludwig, H.-G., Caffau, E. 2010, in: K. Cunha, M. Spite, and B. Barbuy (eds.) Chemical Abundances in the Universe: Connecting First Stars to Planets, Proc. IAU Symposium No. 265, (in press, http://arxiv.org/abs/0910.5917v1)
- [Wedemeyer et al. (2004)] Wedemeyer, S., Freytag, B., Steffen, M., Ludwig, H.-G., & Holweger, H. 2004, A&A, 414, 1121