Anomalous optical and electronic properties of dense sodium
Abstract
Based on ab initio density-functional-theory using generalized gradient approximation, we systematically study the optical and electronic properties of the insulating dense sodium phase (Na-hp4) reported recently [Ma et al., Nature 458, 182 (2009)]. The structure is found optically anisotropic and transparent to visible light, which can be well interpreted using its electronic band structure and angular moment decomposed density of states. Through the bader analysis of Na-hp4 at different pressures, we conclude that ionicity exists in the structure and becomes stronger with increasing pressure. In addition, the absorption spectra in the energy range from 1.4 to 2.4 eV are compared with recent experimental results and found good agreement. It is found that the deep-lying valence electrons participate in the interband transition.
pacs:
71.20.-b, 71.20.Dg, 78.20.Ci, 78.20.-eI Introduction
The electronic structure and property of alkali metals under pressure have drawn extensive attentions recently. At low pressures they all possess simple body-centered-cubic (bcc) or face-centered-cubic (fcc) structure, for which the tightly bound core electrons remain largely unaltered with respect to those in the free atomsWigner1933 . However, the application of pressure may cause the core states to come into play and thus results in unexpected varieties of complex phenomena. Sodium (Na) is unique among alkali metals due to the occupied electronic states. Under pressure, Na is apt to adopting low-symmetry structuresMcMahon2007 ; Gregoryanz2008 and even incommensurate phaseLundegaard2009 . The high pressure transition sequence of Na has been recognized as follows: Na in bcc structure transforms to fcc structure at 65 GPaHanfland2002 and then to a more complex cI16 structure (16-atom bcc) at 105 GPaGregoryanz2005 ; Hanfland2002-1 ; The orthorhombic oP8 phase is observed between 118 to 125 GPaGregoryanz2008 ; At 125 GPa, oP8 transforms to an incommensurate phase tI19Gregoryanz2008 . Though the darkening of Na at the transition to tI19 was observed, the phase is still notably metalicLundegaard2009 . Until recently, Ma et al. reported a new phase of Na transparent to visible light at pressure about 200 GPaMa2009 , which suggests that the metal has become an insulator or at least semiconductor. First-principles evolutionary methodology for crystal structure prediction identified the new phase as wide bandgap dielectric with a six-coordinated, highly distorted double-hexagonal close-packed structure, denoting as hp4Ma2009 . This finding may stimulate the study of transition mechanisms from metal to nonmetal under high pressures and promote the development of high pressure theory as well. It is encouraged to study the electronic properties of the insulating phase Na-hp4.
Optical measurement is a powerful tool for studying the electronic structures of semiconductor and metal. The optical absorption and reflective spectra of Na have been studied extensively both experimentally and theoreticallyStevenson1973 ; Inagaki1976 ; Inagaki1976-1 ; Lundegaard2009 . In particular, Lazicki et al. have recently studied the optical properties of Na in bcc, fcc, cI16, oP8 and tI19 phases comparatively using synchrotron infrared spectroscopy and first-principles method within DFTLazicki2009 . It was found that Na gradually loses its Drude-like luster under compression, and tends towards less metallic behavior. As for the insulating phase Na-hp4, though spectroscopic data have been obtained, the main optical spectra are still scarce except experimentally measured absorption spectra in a small energy range. It is indispensable to study the optical properties of Na-hp4 systematically both for interpretation of the mechanism of metal transition to insulator and for further insight into the electronic structure of Na-hp4. As dielectric material, exploration of dielectric constants of Na-hp4 may be useful from the viewpoint of technological applications. Besides, it is also expected that the calculated results can be as useful reference for future experimental studies.
In the present study, the electronic structure and optical properties of Na-hp4 are calculated based on ab initio DFT using generalized gradient approximation (GGA). These calculations demonstrate that Na-hp4 is transparent to visible light anisotropically. The - hybridization of valence electrons and strong interstitial charge concentrations are the main character of Na-hp4. Through DOS and Bader analysis of Na-hp4, we conclude that electrons transfer between the two inequivalent atoms in the unit cell and ionicity exists between them. And also the ionicity becomes stronger with increasing pressure. The rest of this paper is organized as follows. In the next section, the computational details regarding the methods used in our calculations of electronic structure and optical properties are described. In Sec. III, the calculated results are discussed and compared with experimental dataMa2009 . Finally, we close our paper with a summary of our main results.
II Computational Details
Our electronic and optical calculations are performed using a plane-wave implementation of DFT within the GGA of Perdew-Burke-Ernzerhof (PBE) formalismPerdew1996 , as implemented in the VASP code (Vienna ab initio simulation program)Kresse1993 . The all-electron projector augmented wave (PAW) methodKresse1999 ; Blochl1994 are adopted, with the PAW potential treating as valence electrons. It is implemented by incorporating state into an effective frozen core. The PAW potential provides a significant advantage over the ultrasoft pseudopotential in applying to the optical property calculation since the all electron PAW treatment avoids the complication of calculating an awkward correction term related to the nonlocal pseudopotential operatorAdolph12001 ; Gajdos2006 . We use the plane-wave kinetic energy cutoff of 1250 eV, which is shown to give excellent convergence of the total energies. For structure relaxation and electronic properties calculations, 12×12×10 Monkhorst-Pack grid are used, while for optical property study, the -centered 18×18×12 k grids and 72 bands are adopted yielding dynamical dielectric constants within 0.002 (compare Table II).
The response of a system to an external electromagnetic field with a small wave vector can be described with the complex dielectric function. We consider only electronic excitations because only the dielectric function for frequencies well above those of the phonons is of interest to us. For these, two different methods are used to determine the dielectric constants using different approximations. On one hand, the linear response theory (density functional perturbation theory) is applied; on the other hand, a summation over conduction band states is used. For the former, only the static ion-clamped dielectric matrix can be obtained without summation of conduction bands required. While the latter can be used to calculate the frequency-dependent dynamical dielectric constants when Kohn-Sham eigenvalues and eigenfunctions are obtained. Moreover, due to the double-hexagonal close-packed structure of sodium, the dielectric function is an anisotropic tensor. By an appropriate choice of the principal axes, we can diagonalize it and restrict our considerations to the diagonal matrix elements. The interband contribution to the imaginary part of the dielectric function is calculated by summing transitions from occupied to unoccupied states (with fixed vectors) over the Brillouin zone, weighted with the appropriate matrix element giving the probability for the transition. To be specific, the longitudinal expression for the components are given by
| (1) |
where the indices and refer to conduction and valence band states respectively, and is the cell periodic part of the wavefunctions. The vector are the unit vectors for the three Cartesian directions. is the volume of the primitive cell. While the point weights are defined such that they sum to 1, the Fermi weights equal to 1 for occupied and zero for unoccupied states. The factor 2 before the weights accounts for the fact that we consider a spin-degenerate system. The real part of the dielectric tensor is obtained by the usual Kramers-Krönig transformation:
| (2) |
where stands for the principal value of the integral. The knowledge of both the real and imaginary parts of dielectric tensor allows the calculation of important optical constants. In this paper we present and analyze the reflectivity , the absorption coefficient , the electron energy-loss spectrum , as well as the refractive index and extinction coefficient . The reflectivity spectra are derived from the Fresnel’s formula:
| (3) |
The absorption coefficient and the electron energy-loss spectrum are expressed explicitly as,
| (4) |
| (5) |
The refractive index and the extinction coefficient are obtained by the following expressions:
| (6) |
| (7) |
The optical conductivity then follows immediately from the imaginary part of the dielectric constants,
| (8) |
III Results and Discussion
III.1 Atomic and electronic structures of Na-hp4
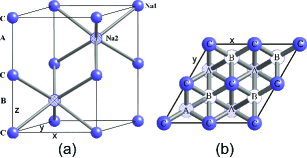
The crystal structure of sodium in hp4 phase have been studied experimentally using x-ray diffraction and reflectionMa2009 . The insulating phase considered here is a highly distorted double-hexagonal close-packed structure (D_2h space symmetry). It belongs to the space group of and contains four atoms per cell. There are two inequivalent atomic positions in unit cell, Na1 located at the site and Na2 at site . All the crystal parameters are optimized. Atoms in this dense structure are six-coordinated. Note that the stacking of close-packed layers of Na atoms is CACBCACB… as in any d.h.c.p structure. Top view along the c-axis within plane of Na-hp4 is show in the Fig. 1(b), in which A, B, and C denote the atoms occupying the A, B, and C layers in the Fig. 1(a).
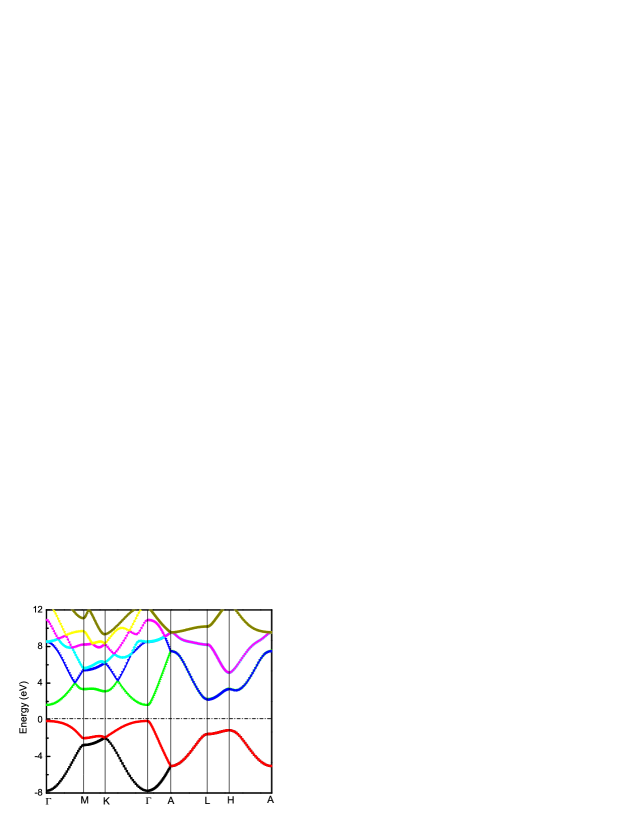
Electronic structure is first calculated since the optical spectra are calculated from interband transition. It should be noted that theoretical predicted transition pressure of Na-hp4 is about 260 GPa, which is higher than experimental reported value 200 GPaMa2009 . The discrepancy may result from the well-known overstabilization of metallic states by DFT calculations. For this reason, we calculate the electronic and optical properties of Na-hp4 at 320 GPa, at which Na-hp4 exists stably. The calculated band structure of hp4 phase at 320 GPa in the high-symmetry directions in the Brillouin zone are shown in Fig. 2. The energy scale is in eV, and the valence band maximum is set to be the Fermi energy, indicating that the bands below are all occupied. From this figure it is clear that a direct band gap appears between the top-most valence band and the bottom-most conduction band at . Our calculated value of the direct band gap is about 1.75 eV, which should be smaller than the true value due to the discontinuity of the exchange-correlation potential, while consistent with other theoretical resultsMa2009 . The bands have large dispersion. There are only two valence bands in the valence region shown in Fig. 2, the bottom one mainly arising from orbitals and the above one from the hybridization between and orbitals. These two valence bands are degenerate along directions.
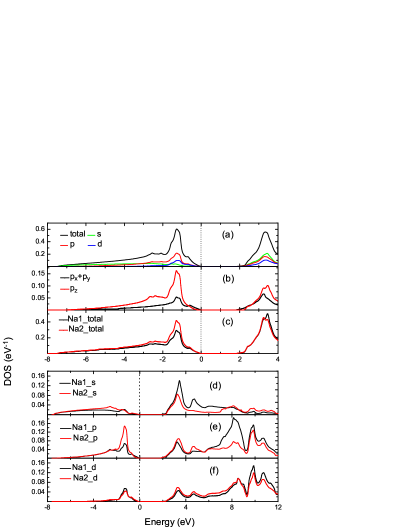
Our calculated total density of states (DOS) along with site-projected and angular momentum decomposed DOS of hp4 phase are shown in Fig. 3. The valence maximum is set to be zero on the energy scale. The most intriguing feature of the DOS is the emergence of state. Under the compression of 320 GPa, the overall density is increased to about six times as large as the atmospheric density of Na. The nearest Na-Na distance is 1.878 Å, while the and orbital radii are 1.71 and 0.28 Å, ionic radius of is 1.02 Å. That means strong valence-core and core-core overlap exist between the neighboring atoms. Due to the exclusionary effects, the Bloch states with the angular momentum components of and are largely excluded from the core region by the core states with the same angular momentum components. However, the more asymmetric states which have lower kinetic energy is apt to sampling the full nuclear potential. Thus states drops below the Fermi energy and hybridize with states, which induce strong electron localization as seen in valence charge density shown in Fig. 4. Figure 3(b) indicates that the DOS for is different from that for , which predicts the anisotropy of Na-hp4. As shown in Fig. 3(c), the DOS peaks for Na1 and Na2 are largely different, which implies evident charge transfer from Na1 to Na2 and thus weak ionicity exists between them. In the valence band, the state covers larger energy range than the and states. From Fig. 3(d)-3(f), the , and states decrease to zero at 7.4, 5.8 and 3.1 eV below , while begin to emerge at 2.3, 1.8 and 2.2 eV above , respectively. The contributions from and states imply and hybridizations for Na1 and Na2, respectively. The contribution rises basically with increasing binding energy in conduction band, while the state contribution begins to decrease with energy at about 3 eV above .
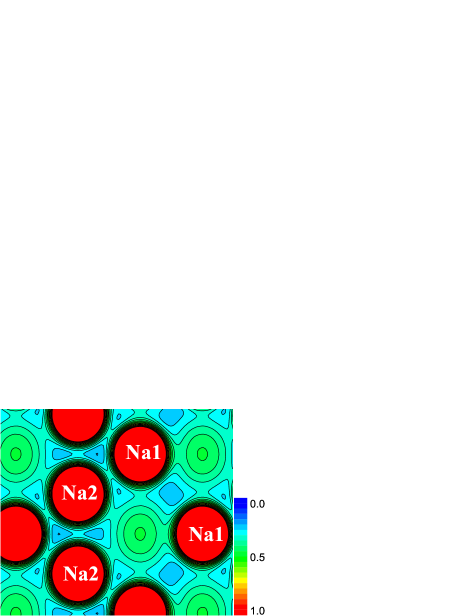
In order to clarify the cause of the insulating phase, we present in Fig. 4 the valence charge density in the plane of Na-hp4. Density isocontours are drawn at intervals of 0.05 color-coded from (blue) to 1 (red). It shows that the charge concentration is very strong in interstitial regions, while minimal near and between the ions, which is resulted by the exclusionary effect mentioned above. The transition to the insulating phase (Na-hp4) is eventually culminated. From this figure, charge transfer from Na1 to Na2 can also be concluded consistently. To describe the ionic character quantitatively and more clearly, we perform the Bader analysis of Na-hp4 at different pressures. Bader analysis is a well established analysis tool for studying the topology of the electron density and suitable for discussing the ionicity of a material Bader1990 ; Tang2009 . The charge enclosed within the Bader volume () is a good approximation to the total electronic charge of an atom. In present study charge density grids are used, which give excellent precision of the effective charge . The calculated results are listed in Table I. From Table I, the ionic character is obviously shown through a charge flux (about 0.6 electrons per Na atom) from Na1 to Na2. Besides, the valence of charge transfer increases with increasing pressure, which implies that the ionicity become stronger under compression. The main reason lies in that the energy level for Na2 is lower than that for Na1. With increasing pressure, the energy level difference becomes larger.
| Pressure Na1-Na2 |
|---|
| (GPa) |
| 260 8.4024 9.5976 5.0458 9.1543 0.9222 |
| 280 8.3950 9.6050 4.8979 8.8720 0.9191 |
| 300 8.3875 9.6125 4.4607 8.6191 0.9067 |
| 320 8.3828 9.6172 4.6468 8.3879 0.8991 |
| 340 8.3783 9.6217 4.5404 8.1746 0.8920 |
III.2 Optical properties of Na-hp4
The interband optical functions of Na-hp4 at 320 GPa calculated using expressions (1) and (2) are shown in Fig. 5(a) and 5(b), in which , and correspond to the three principle directions , , and , regarding to the electric field vector polarized along the crystallographic axes , and respectively. It is evident that Na-hp4 is optically anisotropic: and spectra are the same, while spectrum is different. The macroscopic dielectric constants are calculated using different methods and approximations, as shown in Table II. A -centered grid with points yields dielectric constants with good convergence within 0.001 for and 0.09 for . The value of can be compared with experimental data. Obviously, is 5.785 and 11.028 in and directions, respectively. The obtained values can be as important reference for further experimental measurements of Na-hp4.
| Na-hp4 |
|---|
Our calculated optical spectra cover the photon energy range of 30 eV. In order to show the details clearly, we use logarithm longitudinal scale for the imaginary part of dielectric constant and absorption coefficient . shows mainly five peaks both in direction and in directions. In direction, these peaks correspond to the photon energy of 2.54, 4.31, 13.37, 17.7 and 24.64 eV, while in directions, 4.31, 10.54, 16.34, 20.8 and 28.8 eV, respectively. The peak at 2.54 eV originates from the transition from to corresponding to the topmost valence band to bottommost conduction band, while the peak at 4.31 eV is attributed to the transition from to . At 4.31 eV and 13.37 eV in direction and 4.31 eV and 16.34 eV in directions, the sign of changes, which predict the anisotropy of the polarized spectra. In the range around 13.37 eV and 16.34 eV, is very low and thus the conditions for a plasma resonance are satisfiedSchoenes1980 . Hence, there are strong resonance maxima at these energies in the calculated energy-loss spectra for these polarizations, as can be seen from Fig. 6(c). The other seven high-energy peaks can all be attributed to transitions from the top two valence bands to the upper conduction bands, without deep-lying valence orbitals participating in the interband transitions. These also explain the origin of the peak structure in the absorption coefficient and reflectivity spectra. The absorption spectra remains nearly zero in the visible photon energy, which implies that Na-hp4 is transparent to visible light. As seen from Fig. 5(c), Na-hp4 remains transparent to light with higher frequency in direction than in direction. In Fig. 5(d), we present in the photon energy range from 1.4 eV to 2.4 eV at 200 GPa along with the previously reported experimental measurementMa2009 . Here we assume the sample thickness is 8 m. As all know, the band gap can be deduced by extrapolating the absorption to zero. It is concluded that the results from theoretical calculation and experiment agree well except that the theoretically predicted band gap is smaller than the experiment, the origin of which is the local-density approximation. In addition, it should be noted that the present calculation only pertains to the electronic response, and does not include the effects of lattice vibrations that dominate the experimental absorption spectrum in the low frequency region. Thus we can not derive the complete agreement with experimental results.
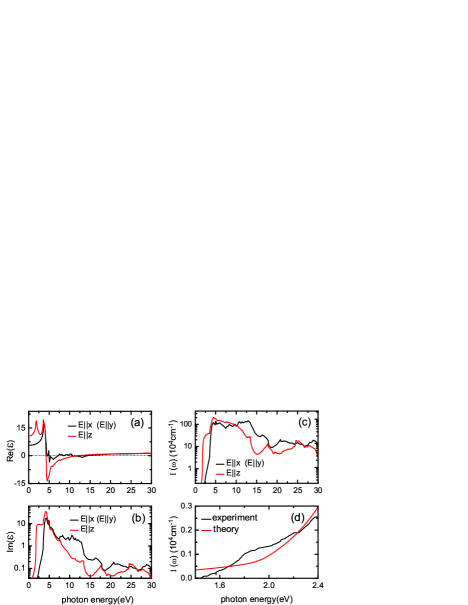
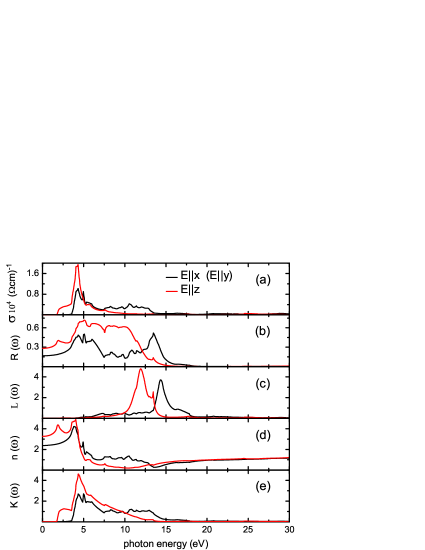
In Fig. 6, we show the main optical spectra including optical conductivity, reflective spectrum, energy-loss spectrum, extinction and refractive indices in a photon energy width of 30 eV. The peak of optical conductivity in direction is almost twice as large as that in and directions. The reflectivity spectrum is distinct from the drude-type spectrum, which means Na-hp4 is no longer metallic. The reflectivity is small at visible optical energy, which ensures the transparency of Na-hp4. During the range about 5 eV to 10 eV, the reflective index remains almost constant as in direction and in direction. Refractive indices of a crystal are closely related to electronic polarizability of ions and the local field inside the crystal. Another interesting point connected with the refractive indices is the electro-optic effect. We present the refractive indices in Fig. 6(d). The low-frequency refractive index along and direction are calculated as and respectively. It is clear that the light polarized parallel to the axis is more refracted than that with polarization along the and axes. This indicates the large optical anisotropy in Na-hp4.
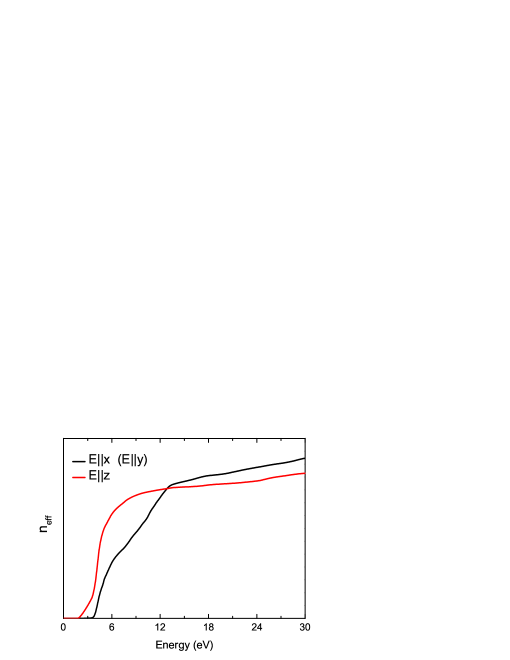
Since the optical properties of Na-hp4 are anisotropic, it is particularly interesting to calculate the effective number of valence electrons per Na atom contributing to the optical properties in each direction. This can be accomplished by means of the sum ruleLogothetidis1988 :
| (9) |
where denotes the upper limit of integration, is the electron mass, and stands for the electron density. The effective number of valence electrons per Na atom participating in the interband transitions along the crystallographic directions at 320 GPa is shown in Fig. 7 as a function of . One can see that remains lager before 13 eV and smaller after 13 eV in direction than in direction. This is connected with the larger reflectivity feature observed in direction at low energy range than in direction. In addition, the doesn’t reach a saturation value up to 30 eV. This shows that deep-lying valence orbitals do participate in the interband transition.
IV Conclusions
In summary, we have performed systematic study of the electronic and optical properties of the transparent insulating phase Na-hp4 using the first-principles method. The insulating mechanism that exclusionary effect induces the valence electrons being excluded from the core region is clearly demonstrated from the calculated band structure, angular moment decomposed density of states and valence charge density. The dielectric functions and all main optical spectra indicate that Na-hp4 is optically anisotropic. The macroscopic dielectric constants have been obtained and are expected to be useful for future reference. Especially, our calculated absorption spectrum in the energy range from 1.4 to 2.4 eV agrees well with the experimental observation. Finally, we have shown that during the interband transition, deep-lying valence electrons of Na-hp4 also participate.
Acknowledgements.
We thank Yanming Ma for dicussions. This work was supported by NSFC under Grant No. 60776063, No. 10734140 and No. 10674021, the National Basic Research Program of China (973 Program) under Grant No. 2009CB929103 and No. 2005CB724500.References
- (1) E. Wigner and F. Seitz, Phys. Rev. 43, 804 (1933); ibid 46, 509 (1934).
- (2) M. I. McMahon, E. Gregoryanz, L. F. Lundegaard, I. Loa, C. Guillaume, R. J. Nelmes, A. K. Kleppe, M. Amboage, H. Wilhelm, and A. P. Jephcoat, PNAS 104, 17297 (2007).
- (3) E. Gregoryanz, L. F. Lundegaard, M. I. McMahon, C. Guillaume, R. J. Nelmes, and M. Mezouar, Science. 320, 1054 (2008).
- (4) L. F. Lundegaard, E. Gregoryanz, M. I. McMahon, C. Guillaume, I. Loa, and R. J. Nelmes, Phys. Rev. B 79, 064105 (2009).
- (5) E. Gregoryanz, O. Degtyareva, M. Somayazulu, R. J. Hemley, and H. K. Mao, Phys. Rev. Lett. 94, 185502 (2005).
- (6) M. Hanfland, I. Loa, and K. Syassen, Phys. Rev. B 65, 184109 (2002).
- (7) M. Hanfland, K. Syassen, L. Loa, N. E. Christensen, and K. Amaya, Poster at 2002 High Pressure Gordon Conference (2002).
- (8) Y. M. Ma, M. Eremets, A. R. Oganov, Y. Xie, I. Trojan, S. Medvedev, A. O. Lyakhov, M. Valle, and V. Prakapenka, Nature 458, 182 (2009).
- (9) D. J. Stevenson, Phys. Rev. B 7, 2348 (1973).
- (10) T. Inagaki, L. C. Emerson, E. T. Arakawa, and M. W. Williams, Phys. Rev. B 13, 2305 (1976).
- (11) T. Inagaki, E. T. Arakawa, R. D. Birkhoff, and M. W. Williams, Phys. Rev. B 13, 5610 (1976).
- (12) A. Lazicki, A. F. Goncharov, V. V. Struzhkin, R. E. Cohen, Z. Liu, E. Gregoryanz, C. Guillaume, and H. K. Mao, PNAS 106, 6525 (2009).
- (13) J. P. Perdew, K. Burke, and M. Ernzerhof, Phys. Rev. Lett. 77, 3865 (1996)
- (14) G. Kresse, and J. Hafner, Phys. Rev. B 48, 13115 (1993).
- (15) G. Kresse, and D. Joubert, Phys. Rev. B 59, 1758 (1999).
- (16) P. E. Blochl, Phys. Rev. B 50, 17953 (1994).
- (17) B. Adolph, J. Furthmuller, and F. Bechstedt, Phys. Rev. B, 63, 125108 (2001).
- (18) M. Gajdos, K. Hummer, and G. Kresse, J. Furthmuller, and F. Bechstedt, Phys. Rev. B 73, 045112 (2006).
- (19) R. F. W. Bader, Atoms in Molecules: A Quantum Theory (Oxford University Press, New York, 1990).
- (20) W. Tang, E. Sanville, and G. Henkelman, J. Phys.: Condens. Matter 21, 084204 (2009).
- (21) J. Schoenes, Phys. Rep. 63, 301 (1980).
- (22) S. Logothetidis, and G. Kiriakidis, J. Appl. Phys. 64, 2391 (1988).