Mopra line survey mapping of NGC 6334 I and I(N) at 3 mm
Abstract
A 5′5′ region encompassing NGC 6334 I and I(N) has been mapped at a wavelength of 3 mm (from 83.5 to 115.5 GHz) with the Mopra telescope at an angular resolution between 33″ and 36″. This investigation has made use of the recently installed 3 mm MMIC receiver and the Mopra Spectrometer (MOPS) with broadband capabilities permitting total coverage of the entire frequency range with just five different observations. In total, the spatial distribution of nineteen different molecules, ions and radicals, along with additional selected isotoplogues have been studied. Whilst most species trace the sites of star formation, CH3CN appears to be most closely associated with NGC 6334 I and I(N). Both CN and C2H appear to be widespread, tracing gas that is not associated with active star formation. Both N2H+ and HC3N closely resemble dust continuum emission, showing they are reliable tracers of dense material, as well as the youngest stages of high mass star formation. Hot (E100 K) thermal CH3OH emission is preferentially found towards NGC 6334 I, contrasting with I(N), where only cold (E22 K) thermal CH3OH emission is found.
keywords:
circumstellar matter – infrared: stars.1 Introduction
NGC 6334 is a giant molecular cloud located at a distance of 1.7 kpc (Neckel, 1978) in the southern Galactic plane. Lying along a gas filament of 11 pc in length, NGC 6334 exhibits several luminous sites of massive star formation – as seen in the far-infrared (McBreen et al. 1979, five sources denoted using roman numerals I to V) and radio continuum (Rodriguez et al. 1982, six sources denoted with letters from A to F) with source I dominating the millimetre to the far infrared (Sandell, 2000). In close proximity to NGC 6334 I, about two arcminutes to the north, another bright source is found in the millimetre- and submillimetre continuum, denoted NGC 6334 I(N) (Cheung et al., 1978; Gezari, 1982; Sandell, 2000). While this source is believed to be a comparably young object – as concluded from the lack of H ii regions and mid-IR emission – there is compelling evidence however, that star formation is going on there (e.g. Megeath & Tieftrunk, 1999). It is this twin core system, NGC 6334 I and I(N), that offers the rare opportunity to study the evolution of high mass stars from the same parental cloud and in a relatively small spatial region.
Single dish molecular line observations show both cores to be chemically rich (Thorwirth et al., 2003) with source I being comparable in line density to prototypical hot cores such as Orion-KL and SgrB2(N) (Bachiller & Cernicharo, 1990; McCutcheon et al., 2000; Thorwirth et al., 2003; Schilke et al., 2006). High spatial resolution observations towards both cores have been conducted: ATCA investigations of NH3 emission up to the (6,6) inversion transition reveals the presence of warm gas in both cores (Beuther et al., 2005, 2007) and SMA continuum observations at 1.3 mm (Hunter et al., 2006) resolve each core into a sample of sub-cores of several tens of solar masses each, four for source I and seven for I(N), demonstrating the formation of star clusters.
Several line mapping studies using standard molecular tracers were carried out in the past to obtain information about the large scale spatial distribution of molecular gas (Kraemer & Jackson, 1999; McCutcheon et al., 2000) additionally leading to the detection of several molecular outflows associated with both cores (Bachiller & Cernicharo, 1990; Megeath & Tieftrunk, 1999; Leurini et al., 2006).
In the present investigation we have used the Mopra telescope for spectral line mapping of a 5′5′ region around NGC 6334 I and I(N) throughout the entire 3 mm range.
2 Observations
Observations were carried out in 2006 on June 25th, using the 22m Mopra telescope near Coonabarabran, New South Wales, Australia111For detailed information on the facility visit the Mopra www page at http://www.narrabri.atnf.csiro.au/mopra/. We used the recently commissioned 3 mm MMIC receiver in combination with the new Mopra spectrometer, MOPS, in broadband mode222Detailed information on the available receivers and backends can be found online in the “Technical Summary of the Mopra Radiotelescope” available at http://www.narrabri.atnf.csiro.au/mopra/mopragu.pdf resulting in an instantaneous bandwidth of 8 GHz split over four overlapping IFs of 2.2 GHz each. At the time of the observations MOPS provided 1024 channels per IF, giving a total of 8192 channels. The spectral resolution of the observations was 2 MHz corresponding to a velocity resolution of about 6 km s-1 per channel. For NGC 6334, this velocity resolution is about the same, or slightly larger than expected line widths, which means while we do not expect to spectrally resolve many lines, we will not suffer a significant loss in signal due to spectral smearing. Thus, this work will necessarily concentrate on morphologies and integrated intensities of emission, rather than any analysis of kinematic structure.
The pointing centre for the maps was chosen to be RA(J2000) = 17 20 54.24, Dec(J2000) = -35 46 11.5, which is approximately half way between NGC 6334 I and I(N). We used the on-the-fly mapping routine to map an area of 5′5′ around this position. Due to incomplete sampling of the edges of the map, a slightly smaller area is considered in this work. A scanning rate of 3.5 arcsec s-1 was used. Data were averaged every 2 seconds which gives an optimum data collection rate with minimal smearing of the output. A spacing of 10 arcseconds was used between each scanning row. Assuming a beam of between 33 and 36″, depending on the frequency (Ladd et al., 2005), this observing mode resulted in a fully sampled map. A single map was obtained in about 90 minutes, including about 15% of this time for TSYS calibration, reference observations and pointing on a nearby SiO maser (AH Sco). Poor weather (clouds) affected some of the data, which usually appears as faint horizontal stripes in the data (see the following sections for details).
3 Results
Figure 1 shows spectra at I and I(N) across the 3 mm band. Each spectrum was made by integrating the emission over a box approximately equal to the size of the beam. The spectrum for NGC 6334 I was centred on the methanol maser site that overlaps with the UC HII region (17 20 53.35, -35 47 1.6) and the spectrum for NGC 6334 I(N) was centred on the methanol maser site (17 20 54.58 -35 45 8.6). Across the band, we detect a total of 52 transitions from 19 species. Details of each detection are given in Table 1. For each of these transitions, we provide a map of the emission, shown in Figure 6.
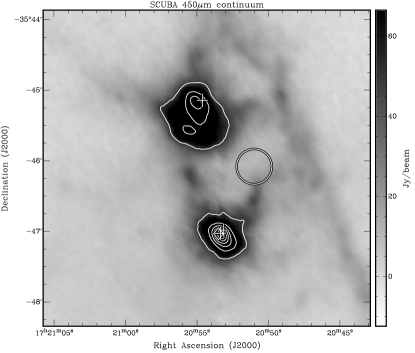
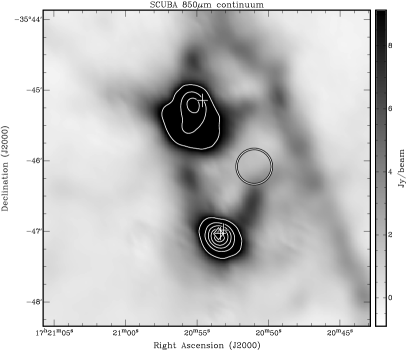
Figure 5 shows dust continuum emission in the region taken using SCUBA on the JCMT (Göran Sandell, private communication). These images were taken on June 26th and July 1st, 1998, with measured half-power beam widths of at 850m and at 450m. In this Figure, the plus symbols represent the positions of methanol maser emission (Walsh et al., 1998). In the north, the methanol maser site marks the position of NGC 6334 I(N). In the south, two maser sites are seen, spaced about apart. Coincident with one of these maser sites, and marked by the diamond is the UC HII region NGC 6334 I. The other, nearby maser site marks the position of a hot core (eg. Beuther et al. 2005). The circle marks the position, and approximate extent of the HII region NGC 6334 E. Strong sources of submm continuum emission appear associated with both NGC 6334 I and NGC 6334 I(N). At the position of NGC 6334 I, the dust continuum appears to peak at the UC HII region position, rather than the hot core located to the north-west. The continuum emission also appears to be essentially unresolved here. Higher resolution observations by Hunter et al. (2006) show the continuum emission does fragment into multiple sources.
The continuum emission associated with NGC 6334 I appears to be extended over almost an arcminute, corresponding to a projected length of nearly 0.5 pc. The continuum emission also appears to peak about to the south-east of the maser site associated with NGC 6334 I(N). The greyscale continuum images also show the low level dust emission, which exhibits a prominent filamentary structure running from the south-western corner to the centre-top of the field of view. Other, weaker filamentary structures appear as a bridge between NGC 6334 I and I(N), as well as possibly connecting NGC 6334 I and NGC 6334 E, although very little continuum emission is coincident with the HII region NGC 6334 E. The very weak filamentary structure appears to extend from NGC 6334 I(N) to the north-eastern corner of the field of view. Finally, there is some emission seen directly to the north of NGC 6334 I(N), which may be an extension of the filament seen to bridge the gap between NGC 6334 I and I(N).


… Frequency range is between 91.5 and 99.5 GHz.

… Frequency range is between 99.5 and 107.5 GHz. The large blank areas shown on the upper plot are because the data in these frequency ranges were unfortunately unusable. Note that one line appears at approximately 100.322 GHz. This is a reflection of HNC at 90.664 GHz, and not a real line.

… Frequency range is between 107.5 and 115.5 GHz. The frequencies of identified lines in each spectrum are indicated with a solid vertical line below the spectrum.
 |
 |
 |
 |
 |
 |
 |
 |
 |
 |
 |
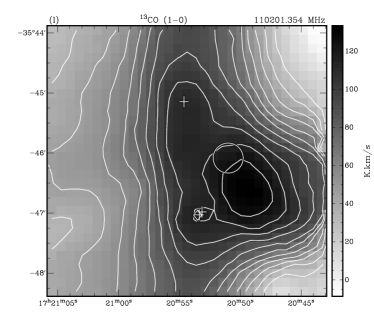 |
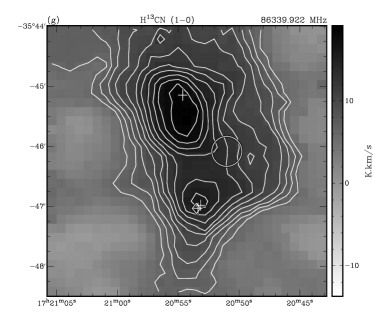
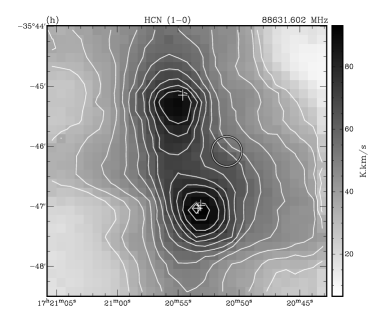
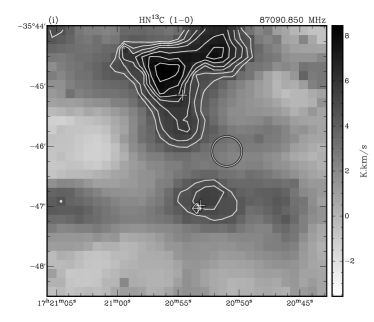
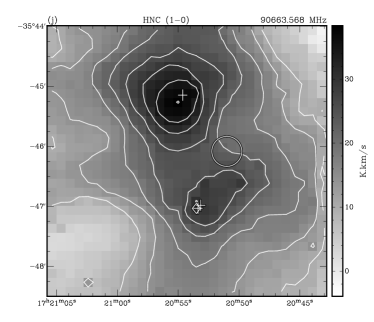
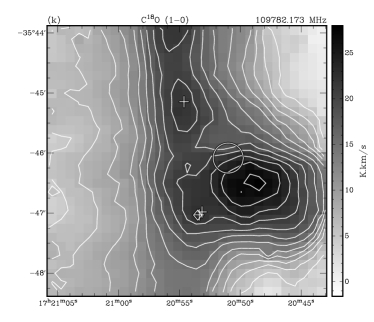
(g) H13CN (1–0) — hydrogen cyanide. Contours start at 5 and increase in 1 steps, where 1 is 1.2 K km s-1. (h) HCN (1–0) — hydrogen cyanide. Contours start at 5 and increase in 1 steps, where 1 is 6.0 K km s-1. (i) HN13C (1–0) — hydrogen isocyanide. Contours start at 5 and increase in 1 steps, where 1 is 0.6 K km s-1. (j) HNC (1–0) — hydrogen isocyanide. Contours start at 5 and increase in 2 steps, where 1 is 2.0 K km s-1. (k) C18O (1–0) — carbon monoxide. Contours start at 5 and increase in 2 steps, where 1 is 1.1 K km s-1. (l) 13CO (1–0) — carbon monoxide. Contours start at 5 and increase in 2 steps, where 1 is 5.0 K km s-1.
 |
 |
 |
 |
 |
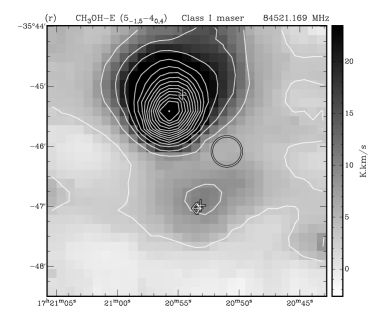 |
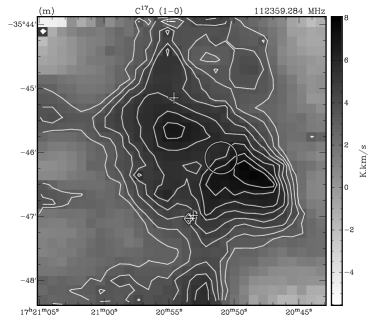
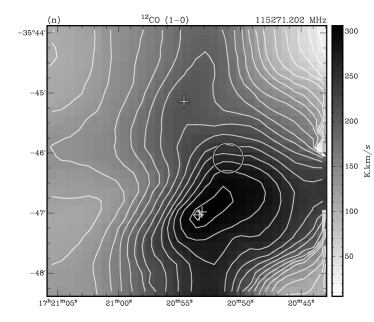
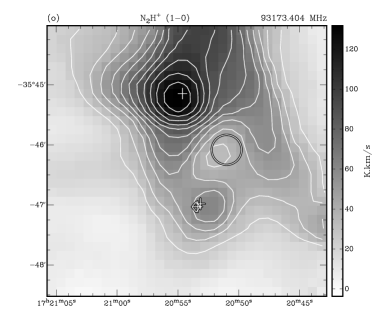
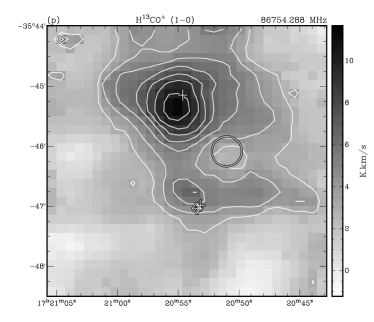
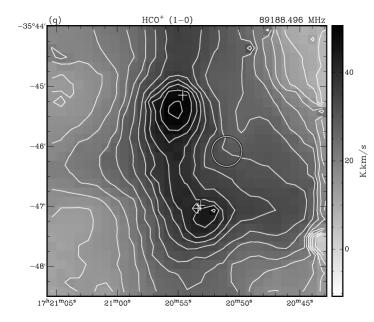
(m) C17O (1–0) — carbon monoxide. Contours start at 5 and increase in 1 steps, where 1 is 0.6 K km s-1. (n) 12CO (1–0) — carbon monoxide. Contours start at 5 and increase in 3 steps, where 1 is 5.0 K km s-1. (o) N2H+ (1–0) — diazenylium. Contours start at 5 and increase in 2 steps, where 1 is 5.0 K km s-1. (p) H13CO+ (1–0) — oxomethylium. Contours start at 5 and increase in 2 steps, where 1 is 0.6 K km s-1. (q) HCO+ (1–0) — oxomethylium. Contours start at 5 and increase in 2 steps, where 1 is 1.6 K km s-1. (r) CH3OH-E ( – ) — methanol. Contours start at 5 and increase in 10 steps, where 1 is 0.6 K km s-1. This methanol transition is a Class I maser (Müller et al., 2004).
 |
 |
 |
 |
 |
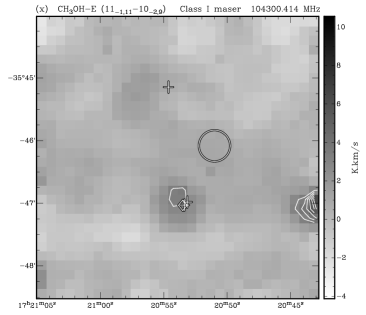 |
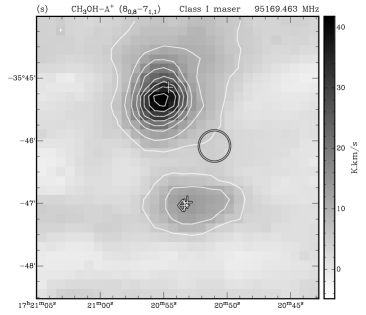
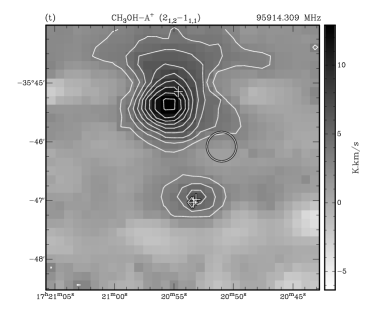
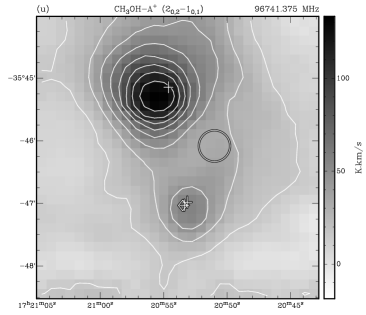
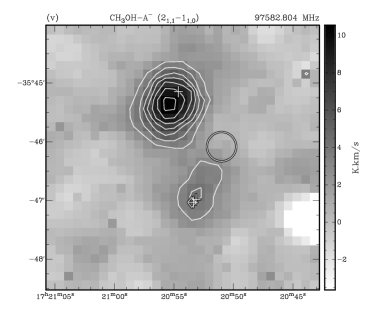
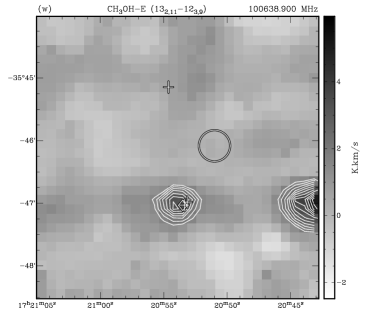
(s) CH3OH-A+ (80,8–71,7) — methanol. Contours start at 5 and increase in 5 steps, where 1 is 1.0 K km s-1. This methanol transition is a Class I maser (Müller et al., 2004). (t) CH3OH-A+ (21,2–11,1) — methanol. Contours start at 5 and increase in 2 steps, where 1 is 0.6 K km s-1. (u) CH3OH-A+ (20,2–10,1) — methanol. Contours start at 5 and increase in 5 steps, where 1 is 3.0 K km s-1. (v) CH3OH-A- (21,1–11,0) — methanol. Contours start at 5 and increase in 2 steps, where 1 is 0.6 K km s-1. (w) CH3OH-E (132,11–123,9) — methanol. Contours start at 5 and increase in 1 steps, where 1 is 0.3 K km s-1. Strong “emission” is seen on the right hand edge of the image, at a declination of approximately , which is due to a bad data point, and is not real emission. (x) CH3OH-E (11-1,11–10-2,9) — methanol. Contours start at 5 and increase in 1 steps, where 1 is 0.6 K km s-1. This methanol transition is a Class I maser (Müller et al., 2004). “Emission” is seen on the right hand edge of the image, at a declination of approximately , which is due to a bad data point, and is not real emission.
 |
 |
 |
 |
 |
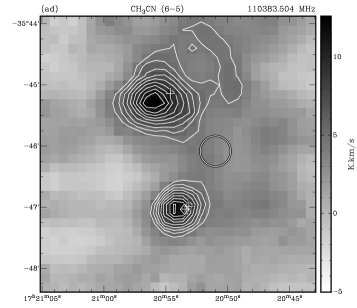 |
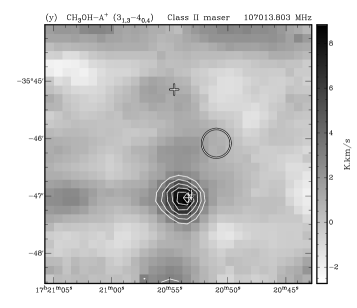
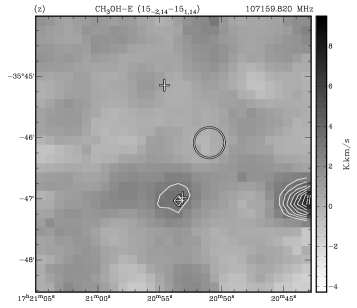
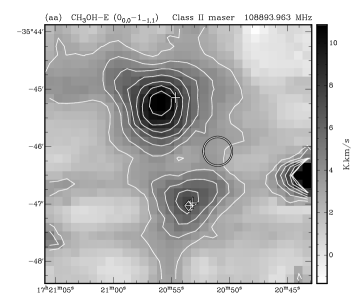
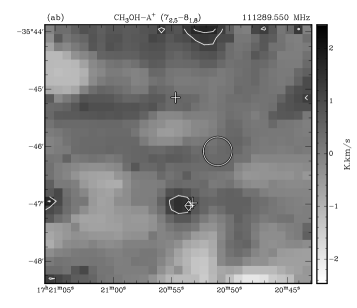
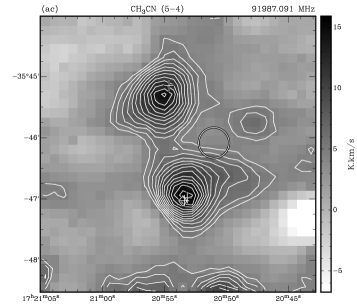
(y) CH3OH-A+ (31,3–40,4) — methanol. Contours start at 5 and increase in 2 steps, where 1 is 0.6 K km s-1. This methanol transition is a Class II maser (Müller et al., 2004). (z) CH3OH-E (15-2,14–151,14) — methanol. Contours start at 5 and increase in 1 steps, where 1 is 0.6 K km s-1. Strong “emission” is seen on the right hand edge of the image, at a declination of approximately , which is due to a bad data point, and is not real emission. (aa) CH3OH-E (00,0–1-1,1) — methanol. Contours start at 5 and increase in 2 steps, where 1 is 0.6 K km s-1. This methanol transition is a Class II maser (Müller et al., 2004). Strong “emission” is seen on the right hand edge of the image, at a declination of approximately , which is due to a bad data point, and is not real emission. (ab) CH3OH-A+ (72,5–81,8) — methanol. Contours start at 3 and increase in 1 steps, where 1 is 0.5 K km s-1. (ac) CH3CN (5–4) — methyl cyanide. The emission includes all transitions in the K ladder from 0 to 3, inclusive. Contours start at 5 and increase in 1 steps, where 1 is 0.9 K km s-1. We attribute the “emission” seen south of to be due to poor weather and is thus not real. (ad) CH3CN (6–5) — methyl cyanide. The emission includes all transitions in the K ladder from 0 to 3, inclusive. Contours start at 5 and increase in 1 steps, where 1 is 0.9 K km s-1.
 |
 |
 |
 |
 |
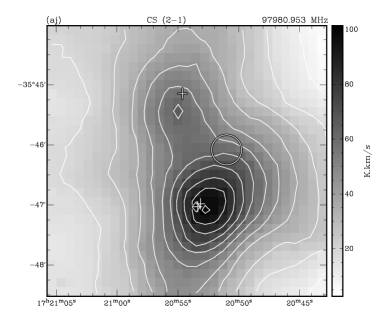 |
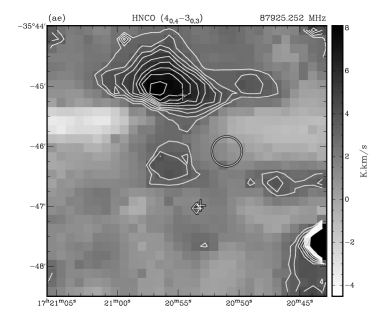
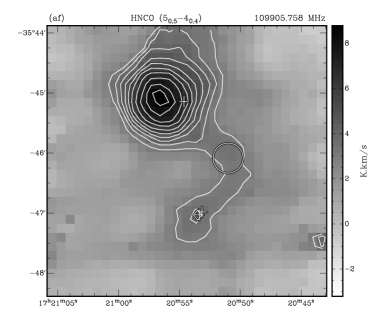
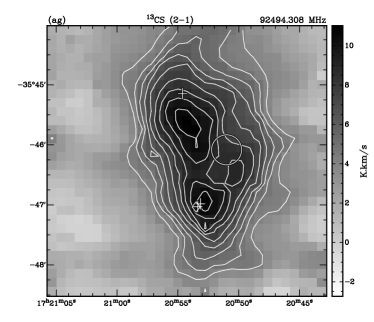
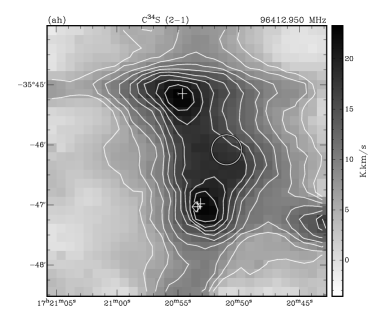
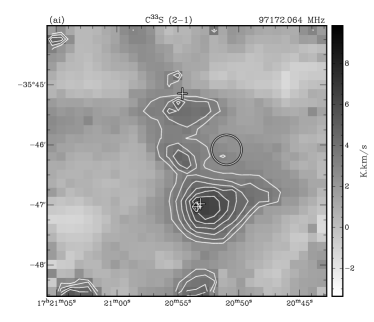
(ae) HNCO (40,4–30,3) — isocyanic acid. Contours start at 5 and increase in 1 steps, where 1 is 0.6 K km s-1. Strong “emission” is seen on the right hand edge of the image, at a declination of approximately , which is due to a bad data point, and is not real emission. (af) HNCO (50,5–40,4) — isocyanic acid. Contours start at 5 and increase in 1 steps, where 1 is 0.6 K km s-1. (ag) 13CS (2–1) — carbon sulfide. Contours start at 5 and increase in 1 steps, where 1 is 0.7 K km s-1. (ah) C34S (2–1) — carbon sulfide. Contours start at 5 and increase in 2 steps, where 1 is 1.0 K km s-1. Strong “emission” is seen on the right hand edge of the image, at a declination of approximately , which is due to a bad data point, and is not real emission. (ai) C33S (2–1) — carbon sulfide. Contours start at 5 and increase in 1 steps, where 1 is 0.6 K km s-1. (aj) CS (2–1) — carbon sulfide. Contours start at 5 and increase in 5 steps, where 1 is 1.8 K km s-1.
 |
 |
 |
 |
 |
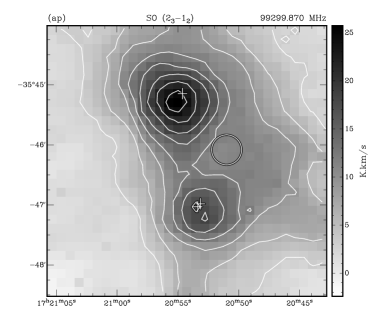 |
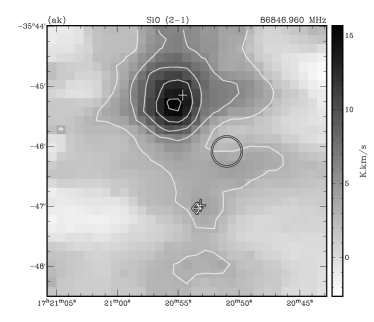
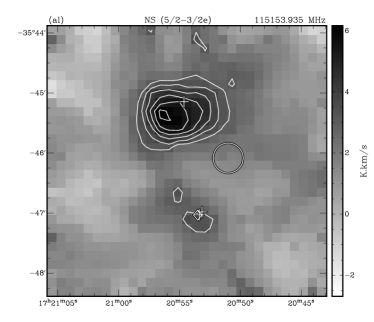
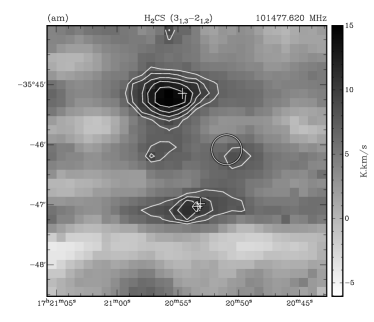
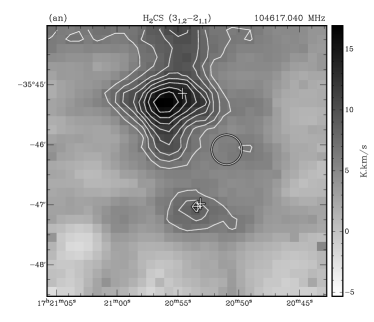
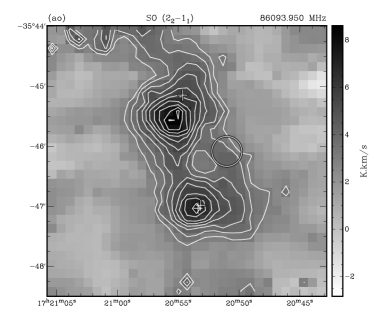
(ak) SiO (2–1) — silicon monoxide. Contours start at 5 and increase in 5 steps, where 1 is 0.6 K km s-1. (al) NS (–e) — nitrogen sulfide. Contours start at 5 and increase in 1 steps, where 1 is 0.6 K km s-1. (am) H2CS (31,3–21,2) — thioformaldehyde. Contours start at 5 and increase in 1 steps, where 1 is 1.5 K km s-1. (an) H2CS (31,2–21,1) — thioformaldehyde. Contours start at 5 and increase in 1 steps, where 1 is 1.3 K km s-1. (ao) SO (22–11) — sulfur monoxide. Contours start at 5 and increase in 1 steps, where 1 is 0.6 K km s-1. (ap) SO (23-12) — sulfur monoxide. Contours start at 5 and increase in 5 steps, where 1 is 0.6 K km s-1.
 |
 |
 |
 |
 |
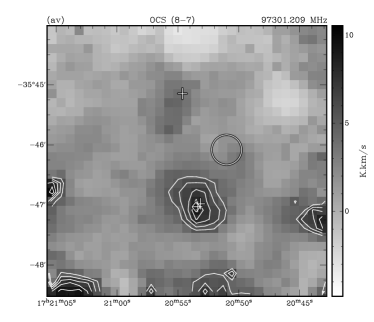 |
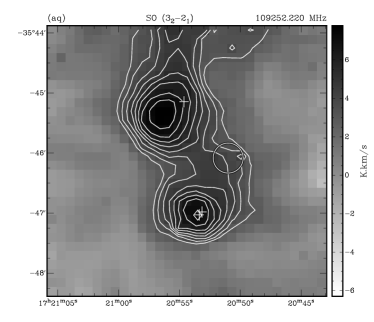
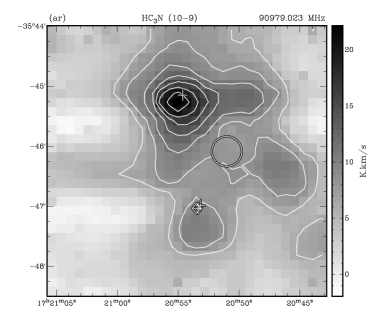
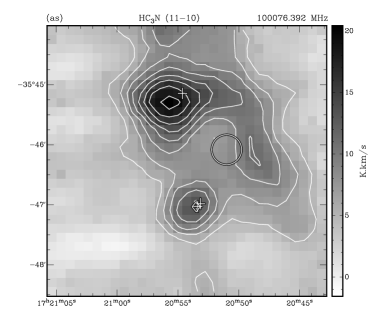
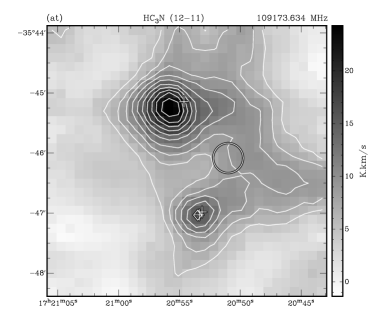
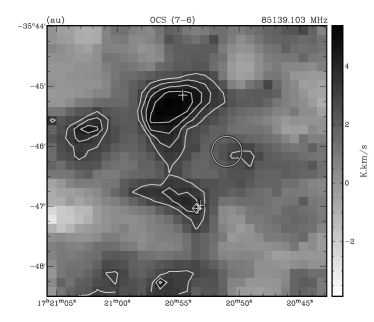
(aq) SO (32–21) — sulfur monoxide. Contours start at 5 and increase in 1 steps, where 1 is 0.6 K km s-1. (ar) HC3N (10–9) — cyanoacetylene. Contours start at 5 and increase in 2 steps, where 1 is 1.2 K km s-1. (as) HC3N (11–10) — cyanoacetylene. Contours start at 5 and increase in 2 steps, where 1 is 1.1 K km s-1. (at) HC3N (12–11) — cyanoacetylene. Contours start at 5 and increase in 2 steps, where 1 is 1.1 K km s-1. (au) OCS (7–6) — carbonyl sulfide. Contours start at 5 and increase in 1 steps, where 1 is 0.6 K km s-1. (av) OCS (8–7) — carbonyl sulfide. Contours start at 5 and increase in 1 steps, where 1 is 1.1 K km s-1. Strong “emission” is seen around edges of the bottom half of the image, which is most likely due to poor weather, and is not real emission.
 |
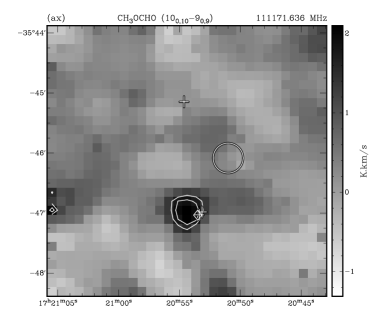 |
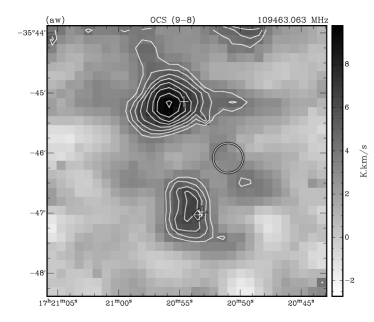
(aw) OCS (9–8) — carbonyl sulfide. Contours start at 5 and increase in 1 steps, where 1 is 0.7 K km s-1. “Emission” is seen around the northern edge of the image, which is most likely due to poor weather, and is not real emission. (ax) CH3OCHO-A (100,10–90,9) — methyl formate. Contours start at 5 and increase in 1 steps, where 1 is 0.3 K km s-1.
4 Discussion
4.1 Morphological analysis
Since the spectral resolution was relatively coarse, we refrain from an analysis of spectrally resolved data-cubes and only show and interpret integrated images of the different molecular species and isotopologues. Furthermore, the angular resolution of the Mopra telescope in the 3 mm band is (at 90 GHz) corresponding to a linear resolution of 65000 AU or 0.3 pc. This spatial resolution is not sufficient to analyze spatial differences within one or the other massive star-forming region. However, it allows us to investigate the molecular global properties, similarities and differences between the different massive star-forming regions present in our field of view. In the following, we will qualitatively describe the global spatial characteristics of the different molecular species and its isotopologues.
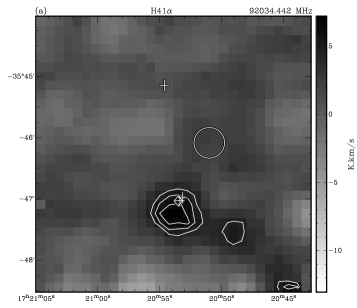
H41: The only covered hydrogen recombination line that we could image and is found as expected toward the UCHii region associated with NGC 6334 I.
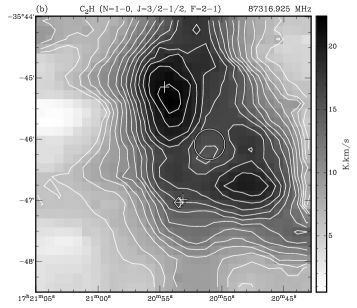
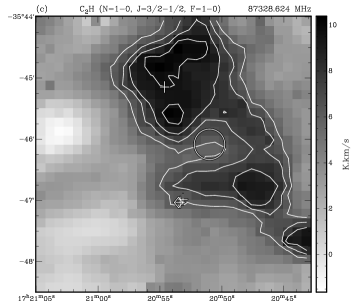
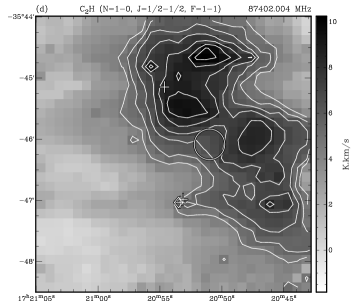
C2H: C2H shows a peculiar spatial morphology since its main emission peak is associated with NGC 6334 I(N) and appears as a weak hole at the position of NGC 6334 E. Furthermore, extended emission closely follows the dust continuum ridge shown in Figure 5. This molecule shows no clear peak toward the southern source NGC 6334I. The dearth of emission coincident with both NGC 6334 E and I suggests that this molecule is destroyed close to HII region environments.
Unsaturated hydrocarbons like C2H are known to be strong at early evolutionary stages (eg. Millar & Nejad 1985; Turner et al. 1999). During the warm-up of the cores it reacts quickly with oxygen to form CO through ion-molecule chemistry (eg. Turner et al. 1999; Herbst & Leung 1986). These models are consistent with our finding of the C2H peak close to NGC 6334 I(N) and much less emission toward the hot core NGC 6334 I or the HII region NGC 6334 E. Furthermore, Beuther et al. (2008) confirm that during ongoing evolution C2H abundances decrease toward star formation sites. Thus, C2H is a good tracer of gas that is not directly associated with active star formation.
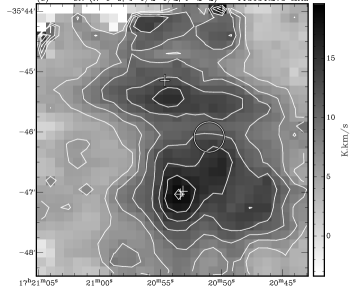
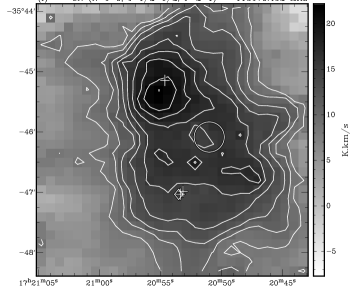
CN: The radical CN appears to be smoothly distributed over a region covering NGC 6334 I, E and I(N). One transition is slightly stronger at NGC 6334 I, and the other is slightly stronger at NGC 6334 I(N). However, these are weak peaks, over the extended emission and so it is not possible to tell if the difference in relative intensities is real or due to noise variations. CN, like C2H, appears to be a good tracer of gas not directly associated with active star formation.
12CO, 13CO, C18O and C17O: Carbon monoxide and its isotopologues are easily detected in our field of view. However, the spatial distribution is surprising because it does not trace clearly any of the two main massive star-forming regions, NGC 6334 I or I(N). The main emission peak is located approximately north-west of NGC 6334 I, closer to the UCHii region NGC 6334 E (but not coincident). We note that this peak does not appear pronounced in any other spectral line imaged in this work, nor does it feature prominently in the dust continuum map. Since only CO (1–0) transitions are prominent at this position (17 20 48.45, -35 46 30) and these transitions have a low effective critical density ( cm-3), we believe this line of sight contains a high column density of low density gas without any significant high density centre that might contain star formation. While 12CO, 13CO and C18O show weaker secondary peaks toward NGC 6334 I and I(N), these are barely detectable in the rarest isotopologue C17O. Based on the mm continuum maps (e.g., Sandell 2000, see also Figure 5) it is obvious that the highest gas column densities are toward NGC 6334 I and I(N), therefore, non-detection of these peaks in rare CO isotopologues cannot be explained by column density effects. The temperatures toward NGC 6334 I and I(N) exceed 100 K (Beuther et al., 2005) whereas the excitation temperatures of the upper energy levels of the carbon monoxide transitions are only of the order 5 K. With a typical Boltzmann distribution, one would expect, for example, the transitions to peak closer to the warm regions NGC 6334 I and I(N).
An additional interesting feature in the CO maps is the more extended north-south ridge. It would be useful to have larger maps to investigate to what extend this ridge is continuing, but a comparison with the mm continuum map indicates that this CO ridge has no direct counterpart in the dense gas and dust component.
N2H+: The well-known tracer of star formation at young evolutionary stages N2H+ exhibits its strongest peak toward the northern region NGC 6334 I(N). However, the molecule has additional – although progressively weaker – emission peaks associated with the more evolved region NGC 6334 I. N2H+ emission is at a local minimum at the position of NGC 6334 E, indicating that this ion tends to avoid the HII region environment. In addition to this, N2H+ clearly shows extended emission, which is positionally coincident with the main filament shown in dust continuum emission (Figure 5). Of all the spectral line species covered in this work, N2H+ most closely follows the dust continuum emission, showing it to be a good tracer of cold and dense material, including in star forming regions.
HCO+ and H13CO+: The HCO+ map clearly shows its main emission peaks associated with the dense cores NGC 6334 I and I(N). It shows an additional secondary peak associated with the main carbon monoxide peaks further to the east, as well as hints of the larger scale north-south ridge discussed for CO and its isotopologues above. For H13CO+ we cannot identify the north-south ridge anymore but the other features resemble those of the main isotopologue. It is interesting to note that the main intensity peaks for both isotopologues are associated with NGC 6334 I(N) and not the more prominent hot-core type region NGC 6334 I. This is reminiscent to the HC3N map published by Sollins & Megeath (2004).
CH3OH, thermal and class i/ii masers: The spectral setup covers many CH3OH and class i and class ii maser lines as shown in Table 1 (see also Müller et al. 2004). It is impossible to definitively claim detection of masers given the current observations with a beam larger than , and a spectral resolution of a few km/s. However, we can comment on the likelihood of any transition showing masing activity, based on the relative intensities of lines at the positions of I and I(N). It is likely, then, that NGC 6334 I(N) shows maser emission in the Class I transitions at 84.521 GHz and 95.169GHz, and in the Class II transition at 108.894 GHz. Val’tts et al. (2000) confirms the masing nature of the Class I transition at 95.169 GHz. NGC 6334 I, on the other hand, does not show strong emission in any of the masing transitions, except perhaps the Class II transition at 107.013 GHz. Cragg et al. (2001) and Val’tts et al. (1999) have both observed this Class II transition towards NGC 6334 I and confirm it is a maser.
The thermal methanol transitions appear to divide into two types, based on the strength of their emission. Methanol transitions showing strong emission at 95.914, the quadruplet at 96.7 and at 97.583 GHz all exhibit the bulk of their emission from NGC 6334 I(N). The methanol transitions at 100.639, 107.160 and 111.290 GHz all show weak emission that is only detected towards NGC 6334 I.
CH3CN: Methyl cyanide is detected in the rotational transitions and . Both integrated intensity maps show two comparably strong peaks toward NGC 6334 I and I(N). Methyl cyanide is potentially useful for temperature estimates, by comparing intensity ratios of components in the -ladders (Thorwirth et al., 2003). However, the low spectral resolution of these data do not allow us to distinguish individual -ladder elements. Of all the species mapped in this work, CH3CN appears to be the one that is most concentrated towards the two regions of active star formation: NGC 6334 I and NGC 6334 I(N).
12CS, 13CS, C34S and C33S: Carbon sulfide shows an interesting spatial variation going from the main isotopologue CS step by step through the rarer isotopologues 13CS and C34S to C33S. While the former main isotopologue peaks toward the southern hot core region NGC 6334 I, the northern peak NGC 6334 I(N) is of comparable brightness for 13CS and C34S. This is likely due to the main CS isotopologue being optically thick, which is then tracing a warmer environment around NGC 6334 I. The optically thin tracers 13CS and C34S show approximately equal brightnesses in I and I(N), suggesting the amount of CS is approximately equal in each. However, the rare isotopologue C33S is brighter in I. We would expect C33S to look similar to 13CS and C34S. This suprising result needs to be investigated further.
SO, OCS, H2CS and NS: Several sulfur-bearing species have been observed, and all of them show two peaks associated with NGC 6334 I and I(N). The general trend appears to be that the emission is stronger towards NGC 6334 I(N), rather than I. The one exception to this rule is OCS (8-7), where very little emission is detected towards NGC 6334 I(N), even though NGC 6334 I shows a bright peak. This is an unexpected result, especially in light of the fact that the two other OCS transitions clearly show NGC 6334 I(N) as a strong source of OCS emission.
HC3N, HNCO, HNC, HN13C, HCN, H13CN: There are several hydrogen-carbon-nitrogen chain molecules observed, and all of them show two strong peaks associated with NGC 6334 I and I(N). Except for HCN where the two peaks are of approximately the same strength, in all other lines the region I(N) is clearly the dominant one. For HC3N this has already previously been reported by Sollins & Megeath (2004). HC3N is unusual in that it shows extended emission which appears to follow the main filament seen in dust continuum emission (Figure 5), to the west of NGC 6334 E. Furthermore, the HC3N emission appears to surround NGC 6334 E, but very little emission is seen inside the ring denoting the extent of this HII region. Since its morphology closely resembles that of the dust continuum emission, we find that HC3N is a good tracer of quiescent, dense gas, as is the case for N2H+.
SiO: As previously reported by Megeath & Tieftrunk (1999), SiO emission is found strongly toward NGC 6334 I(N) and is weaker elsewhere in the field of view. In NGC 6334 I(N) the SiO emission is clearly associated with its molecular outflow(s) (Megeath & Tieftrunk 1999, Hunter et al. in prep.). Previous observations of the G333 giant molecular cloud Lo et al. (2007) have found SiO emission from a region that shows similar properties to NGC 6334 I(N) with an outflow associated with a very early stage of high mass star formation.
CH3OCHO: The dense core tracing molecule methyl formate is detected only toward the southern hot core region NGC 6334 I.
| Molecule | Transition | Frequency | Methanol | Integrated Intensity | |
|---|---|---|---|---|---|
| (MHz) | Maser | (K km/s) | |||
| Class | NGC 6334 I | NGC 6334 I(N) | |||
| H | 41 | 92034.442 | 26 | 333-upper limit | |
| C2H | , , | 87316.898 | 66 | 60 | |
| C2H | , , | 87328.585 | 38 | 32 | |
| C2H | , , | 87401.989 | 35444blend with C2H , , at 87407.165 MHz | 23b | |
| CN | , , | 113123.370 | 8.9 | 19 | |
| CN | , , | 113144.157 | 38 | 34 | |
| CN | , , | 113170.492 | 61 | 64 | |
| CN | , , | 113191.279 | 56 | 46 | |
| H13CN | 86339.922 | 61 | 57 | ||
| HCN | 88631.602 | 350 | 300 | ||
| HN13C | 87090.850 | 19 | 20 | ||
| HNC | 90663.568 | 100 | 110 | ||
| C18O | 109782.173 | 69 | 69 | ||
| 13CO | 110201.354 | 360 | 350 | ||
| C17O | 112359.284 | 19 | 21 | ||
| 12CO | 115271.202 | 930 | 680 | ||
| N2H+ | 93173.392 | 210 | 440 | ||
| H13CO+ | 86754.288 | 16 | 24 | ||
| HCO+ | 89188.525 | 170 | 150 | ||
| CH3OH– | 84521.169 | I | 80 | 180 | |
| CH3OH– | 95169.463 | I | 41 | 88 | |
| CH3OH– | 95914.309 | 16 | 32 | ||
| CH3OH– | 96741.375 | 150 | 370 | ||
| CH3OH– | 97582.804 | 9.5 | 24 | ||
| CH3OH– | 100638.900 | 4.9 | |||
| CH3OH– | 104300.414 | I | 5.5 | ||
| CH3OH– | 107013.803 | II | 15 | 2.7 | |
| CH3OH– | 107159.820 | 8.2 | |||
| CH3OH– | 108893.963 | II | 18 | 28 | |
| CH3OH– | 111289.550 | 1.9 | |||
| CH3CN | 91987.091 | 41555Integrated emission for all transitions | 35c | ||
| CH3CN | 91985.318 | ||||
| CH3CN | 91979.998 | ||||
| CH3CN | 91971.134 | ||||
| CH3CN | 110383.504 | 30666Integrated emission for all transitions | 32d | ||
| CH3CN | 110381.376 | ||||
| CH3CN | 110374.993 | ||||
| CH3CN | 110364.358 | ||||
| HNCO | 87925.237 | 25 | |||
| HNCO | 109905.749 | 12 | 23 | ||
| 13CS | 92494.308 | 36 | 32 | ||
| C34S | 96412.950 | 73 | 61 | ||
| C33S | 97172.064 | 21 | 14 | ||
| CS | 97980.953 | 290 | 210 | ||
| SiO | 86846.960 | 13 | 41 | ||
| NS | N=2-1, J=5/2-3/2 | 115153.835 | 8.5 | 17 | |
| F=7/2-5/2, -state | |||||
| Molecule | Transition | Frequency | Methanol | Integrated Intensity | |
|---|---|---|---|---|---|
| (MHz) | Maser | (K km/s) | |||
| Class | NGC 6334 I | NGC 6334 I(N) | |||
| H2CS | 101477.810 | 24 | 20 | ||
| H2CS | 104617.040 | 27 | 34 | ||
| SO | 86093.950 | 22 | 19 | ||
| SO | 99299.870 | 53 | 69 | ||
| SO | 109252.220 | 18 | 21 | ||
| HC3N | 90979.023 | 38 | 48 | ||
| HC3N | 100076.392 | 27 | 38 | ||
| HC3N | 109173.634 | 33 | 59 | ||
| OCS | 85139.103 | 12 | 17 | ||
| OCS | 97301.209 | 19 | 19 | ||
| OCS | 109463.063 | 19 | 25 | ||
| CH3OCHOe55footnotetext: Blend of A and E types | 111171.636 | 4.5 | |||
4.2 Comparison of NGC 6334I and I(N)
In §4.1, we described the morphology of emission for molecules, or groups of molecules. Here we synthesise this information to present a comparison of the two star forming sites NGC 6334 I and I(N). Based on previous work on this region (eg. Walsh et al. 1998), it is clear that NGC 6334 I appears to be more evolved than I(N): it contains a prominent UC HII region, as well as a strong infrared source, whereas only weak radio continuum (Rodriguez et al., 2007) and infrared emission (Walsh et al., 1999) has been found in the vicitiy of I(N). We also find evidence for an evolutionary difference in our data. Both the CS/N2H+ and CS/HNCO ratios are much larger for NGC 6334 I than for I(N). Previous work on the CS/N2H+ ratio (Zinchenko, Caselli & Pirogov, 2009) and CS/HNCO ratio (Martín et al., 2008) have indicated that CS is likely to be enhanced in abundance towards photodissociation regions (PDRs), whilst both N2H+ and HNCO are likely to be reduced in abundance towards PDRs. Thus, NGC 6334 I shows PDR-like ratios, presumably due to the UC HII region, whereas abundances of both N2H+ and HNCO do not appear to be reduced, compared to CS in NGC 6334 I(N), where a PDR is yet to form.
When comparing the non-masing lines of CH3OH, we find that the emission is stronger towards NGC 6334 I in the 100.638, 107.159 and 111.289 GHz transitions. CH3OH emission is stronger towards NGC 6334 I(N) in the 95.915, 96.741 (quadruplet) and 97.582 GHz transitions. The stronger transitions in NGC 6334 I all have upper energy levels between 103 and 304 K, whilst all the stronger transitions in NGC 6334 I(N) have upper energy levels no greater than 22 K. Thus, we can attribute the stronger emission in NGC 6334 I to hot CH3OH and the stronger emission in NGC 6334 I(N) to cold CH3OH emission. Whilst previous work has shown that both NGC 6334 I and I(N) have hot components, with temperatures in excess of 400 K (Beuther et al., 2007), it is clear that the large-scale CH3OH observed here has only had time to heat up in NGC 6334 I.
We detect CH3OCHO only towards NGC 6334 I. This molecule is thought to be produced only after a young star or protostar has heated up the surrounding material to above 100 K (Garrod & Herbst, 2006). This provides further evidence of the more evolved state of NGC 6334 I over that of I(N).
4.3 Line ratio maps
The ratio of integrated intensities for different spectral lines can potentially be used to identify physical and chemical characteristics of regions within the map. For example, a simple comparison of ratios for different lines of the same species might be used to map physical quantities such as density and temperature. However, most species detected in multiple spectral lines (ie. CN, CH3CN, HNCO, SO, HC3N and OCS) show only a narrow range of energy levels over the multiple spectral lines. Thus only small changes in line ratios are expected from different spectral lines of the same species. In addition to this, small differences in the relative position of maps made at different frequencies can lead to artifacts that can dominate line ratios. In the present study, these complicating factors make such line ratio maps too unreliable to interpret. The only exception to this is CH3OH, where clear differences in the intensities of lines are seen between NGC 6334 I and I(N), as discussed in §4.1.
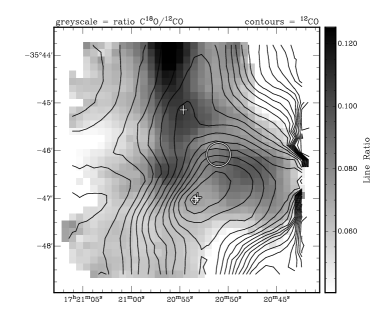
It is possible to compare line ratios between species, that have been observed simultaneously, as this eliminates any relative positional offsets, as well as any varying effects of weather. In Figure 15, we show images based on the ratio of line integrated intensities for different species.
 |
 |
 |
 |
The upper-left image shows the C18O/12CO line ratio map. The greatest ratio is found surrounding NGC 6334 I(N). A high ratio between these two lines means that the 12CO line is optically thick. We also see a secondary peak in the ratio to the south–west of NGC 6334 E, which is close to the peak 12CO peak integrated intensity (shown in contours). At this position, it is likely that there is a high column density of gas. At NGC 6334 I, the line ratio is relatively low. The 12CO gas is likely optically thick here since it is one of the centres of high column density gas in many other lines. The relatively low ratio, compared to that found in NGC 6334 I(N) indicates that the 12CO emission is likely to be optically thick along most lines of sight cvered in these observations.
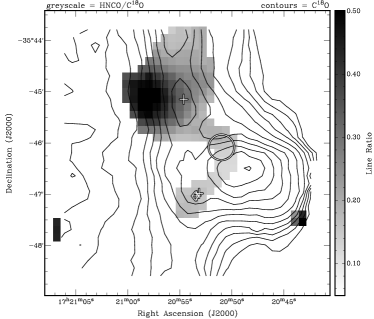
The upper-right image shows the HNCO/C18O line ratio map. As mentioned in §4.2, HNCO tends to be destroyed in PDRs. Thus, the line ratio map broadley shows two regions in the map: a region to the east of NGC 6334 I(N) which shows a high ratio (ie. not a PDR) and a region including NGC 6334 I and E, which appears to be a good candidate PDR, although low signal in HNCO limits our interpretation beyond a narrow strip joining NGC 6334 I and E.
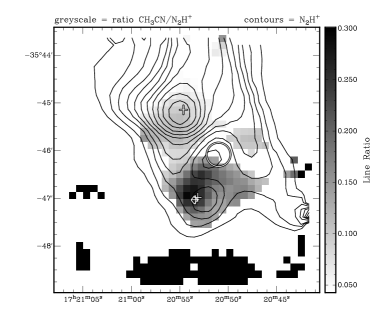
The lower-left image shows the CH3CN/N2H+ line ratio map. As mentioned in §4.1, the CH3CN emission is strongly confined to the centres of active star formation: NGC 6334 I and I(N), whereas N2H+ tends to trace ubiquitous and quiescent gas. The line ratio map clearly shows low line ratio towards NGC 6334 I, in contrast to a high ratio seen at NGC 6334 I(N). This demonstrates that I(N) is a more quiescent region, presumably with star formation at a younger stage.
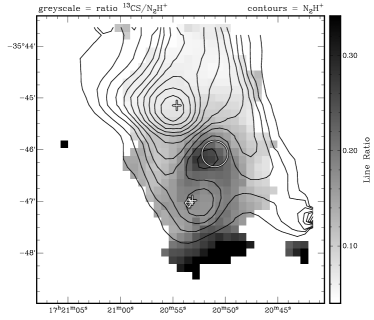
The lower-right image shows the 13CS/N2H+ line ratio map. Here, we see the highest line ratio at the position of the HII region NGC 6334 E. This is probably the result of N2H+ being destroyed by the HII region.
5 Conclusions
We have mapped a region, encompassing the high mass star formation sites NGC 6334 I and I(N). We have covered most of the 3 mm spectral window with these observations, using the Mopra radiotelescope. Our observations do not have sufficient spectral resolution to resolve spectral lines, but we compare morphologies of the various lines detected. We detect emission from 19 different moleules, ions and radicals, including multiple transitions of the same species and transitions from various isotopologues to yield a total of 52 spectral line detections.
We find that CH3CN most closely follows the sites of active star formation, although these sites feature prominently most other observed species. In contrast, emission from both CN and C2H appear to be widespread and are good tracers of gas that is not associated with active star formation. N2H+ and HC3N morphologies closely resemble that of dust continuum emission, indicating that these two species are good tracers of column density, associated with both star forming sites and quiescent gas.
Interpretation of the emission from common species and their isotopologues (ie. CO, HCO+, HCN and HNC) are difficult to interpret, which is likely due to some transitions being optically thick. All CO isotopologues show a peak of emission about 45″ to the south-west of the HII region NGC 6334 E. However, this peak is not prominent in any other tracer, including dust continuum emission. We are currently unable to provide an explanation for this.
CH3OH emission is seen in many transitions, including known Class I and II masers. Due to the low spatial resolution of these observations, we cannot conclude that we have detected any new masers amongst these new transitions. Thermal CH3OH transitions show a marked difference in their ocurrence: transitions with upper level kinetic temperatures above 100 K are found to be stronger towards NGC 6334 I and transitions with upper level kinetic temperatures below 22 K are found to be stronger towards NGC 6334 I(N). This supports the interpretation that NGC 6334 I is a more evolved site for star formation than I(N).
Acknowledgments
The authors would like to thank Göran Sandell for providing the SCUBA continuum images shown in Figure 5. The Mopra Telescope is part of the Australia Telescope and is funded by the Commonwealth of Australia for operation as a National Facility managed by CSIRO. The University of New South Wales Mopra Spectrometer Digital Filter Bank used for the observations with the Mopra Telescope was provided with support from the Australian Research Council, together with the University of New South Wales, University of Sydney, Monash University and the CSIRO. H.B. acknowledges financial support by the Emmy-Noether-Program of the Deutsche Forschungsgemeinschaft (DFG, grant BE2578). The authors would like to thank the anonymous referee whose comments and suggestions have greatly improved the quality of this paper.
References
- Bachiller & Cernicharo (1990) Bachiller, R. & Cernicharo, J. 1990, ApJ, 239, 276
- Beuther et al. (2005) Beuther, H., Thorwirth, S., Zhang, Q., Hunter, T. R., Megeath, S. T., Walsh, A. J. & Menten, K. M. 2005, ApJ, 627, 834
- Beuther et al. (2007) Beuther, H., Walsh, A. J., Thorwirth, S., Zhang, Q., Hunter, T. R., Megeath, S. T. & Menten, K. M. 2007, A&A, 466, 989
- Beuther et al. (2008) Beuther, H., Semenov, D., Henning, Th. & Linz, H. 2008 ApJL, 675, 33
- Carral et al. (2002) Carral, P., Kurtz, S. E., Rodríguez, L. F., Menten, K., Cantó, J. & Arceo, R. 2002, AJ, 123, 2574
- Cheung et al. (1978) Cheung, L., Frogel, J. A., Hauser, M. G. & Gezari, D. Y. 1978, ApJL, 226, 149
- Cragg et al. (2001) Cragg, D. M., Sobolev, A. M., Ellingsen, S. P., Caswell, J. L., Godfrey, P. D., Salii, S. V. & Dodson, R. G. 2001, MNRAS, 323, 939
- Garrod & Herbst (2006) Garrod, R. T. & Herbst, E. 2006, A&A, 457, 927
- Gezari (1982) Gezari, D. Y. 1982, ApJL, 259, 29
- Herbst & Leung (1986) Herbst, E. & Leung, C. M. 1986, MNRAS, 222, 689
- Hunter et al. (2006) Hunter, T. R., Brogan, C. L., Megeath, S. T., Menten, K. M., Beuther, H. & Thorwirth, S. 2006, ApJ, 649, 888
- Kraemer & Jackson (1999) Kraemer, K. E. & Jackson, J. M. 1999, ApJS, 124, 439
- Ladd et al. (2005) Ladd, N., Purcell, C., Wong, T. & Robertson, S. 2005, PASA, 22, 62
- Leurini et al. (2006) Leurini, S., Schilke, P., Parise, B., Wyrowski, F., Güsten, R. & Philipp, S. 2006, A&AL, 454, 83
- Lo et al. (2007) Lo, N., Cunningham, M., Bains, I., Burton, M. G. & Garay, G. 2007, MNRAS Lett., 381, 30
- Martín et al. (2008) Martín, S., Requena-Torres, M. A., Martín-Pintado, J. & Mauersberger, R. 2008, ApJ, 678, 245
- McBreen et al. (1979) McBreen, B., Fazio, G. G., Stier, M. & Wright, E. L. 1979, ApJL, 232, 183
- McCutcheon et al. (2000) McCutcheon, W. H., Sandell, G., Matthews, H. E., Kuiper, T. B. H., Sutton, E. C., Danchi, W. C. & Sato, T. 2000, MNRAS, 316, 152
- Megeath & Tieftrunk (1999) Megeath, S. T. & Tieftrunk, A. R. 1999, ApJL, 526, 113
- Millar & Nejad (1985) Millar, T. J. & Nejad, L. A. M. 1985, MNRAS, 217, 507
- Müller et al. (2001) Müller, H. S. P., Thorwirth, S., Roth, D. A. & Winnewisser, G. 2001, A&AL, 370, 49
- Müller et al. (2004) Müller, H. S. P., Menten, K. M. & Mäder, H. 2004, A&A, 428, 1019
- Müller et al. (2005) Müller, H. S. P., Schlöder, F., Stutzki, J. & Winnewisser, G. 2005 J. Mol. Struct., 742, 215
- Neckel (1978) Neckel, T. 1978, A&A, 69, 51
- Pickett et al. (1998) Pickett, H. M., Poynter, R. L., Cohen, E. A., Delitsky, M. L., Pearson, J. C. & Müller, H. S. P. 1998 J. Quant. Spectrosc. & Rad. Transfer, 60, 883
- Rodriguez et al. (1982) Rodriguez, L. F., Canto, J. & Moran, J. M. 1982, ApJ, 255, 103
- Rodriguez et al. (2007) Rodriguez, L. F., Zapata, L. A. & Ho, P. T. P. 2007, ApJL, 654, 143
- Sandell (2000) Sandell, G. 2000, A&A, 358, 242
- Schilke et al. (2006) Schilke, P., Comito, C., Thorwirth, S., Wyrowski, F., Menten, K. M., Güsten, R., Bergman, P. & Nyman, L.-Å. 2006, A&AL, 454, 41
- Sollins & Megeath (2004) Sollins, P. K. & Megeath, S. T. 2004, AJ, 128, 2374
- Thorwirth et al. (2003) Thorwirth, S., Winnewisser, G., Megeath, S. T. & Tieftrunk, A. R. 2003, ASP Conf, 287, 257
- Turner et al. (1999) Turner, B. E., Terzieva, R. & Herbst, E. 1999, ApJ, 518, 699
- Val’tts et al. (1999) Val’tts, I. E., Ellingsen, S. P., Slysh, V. I., Kalenskii, S. V., Otrupcek, R. & Voronkov, M. A. 1999, MNRAS, 310, 1077
- Val’tts et al. (2000) Val’tts, I. E., Ellingsen, S. P., Slysh, V. I., Kalenskii, S. V., Otrupcek, R. & Larionov, G. M. 2000, MNRAS, 317, 315
- Walsh et al. (1998) Walsh, A. J., Burton, M. G., Hyland, A. R., Robinson, G., 1998, MNRAS, 301, 640
- Walsh et al. (1999) Walsh, A. J., Burton, M. G., Hyland, A. R. & Robinson, G. 1999, MNRAS, 309, 905
- Zinchenko, Caselli & Pirogov (2009) Zinchenko, I., Caselli, P. & Pirogov, L. 2009, MNRAS, 395, 2234