Kubota et al.Suzaku and Optical Spectroscopic Observations of SS 433 \Received2009/11/11\Accepted2010/01/15
stars: individual (SS433) — binaries — accretion discs — ISM: jets and outflows — X-rays: individual (SS433)
Suzaku and Optical Spectroscopic Observations of SS 433 in the 2006 April Multiwavelength Campaign
Abstract
We report results of the 2006 April multi-wavelengths campaign of SS 433, focusing on X-ray data observed with Suzaku at two orbital phases (in- and out-of- eclipse) and simultaneous optical spectroscopic observations. By analyzing the FeXXV K lines originating from the jets, we detect rapid variability of the Doppler shifts, day-1, which is larger than those expected from the precession and/or nodding motion. This phenomenon probably corresponding to “jitter” motions observed for the first time in X-rays, for which significant variability both in the jet angle and intrinsic speed is required. From the time lag of optical Doppler curves from those of X-rays, we estimate the distance of the optical jets from the base to be cm. Based on the radiatively cooling jet model, we determine the innermost temperature of the jets to be = 132 keV and 163 keV (the average of the blue and red jets) for the out-of-eclipse and in-eclipse phase, respectively, from the line intensity ratio of FeXXV K and FeXXVI K. While the broad band continuum spectra over the 5–40 keV band in eclipse is consistent with a multi-temperature bremsstrahlung emission expected from the jets, and its reflection component from cold matter, the out-of-eclipse spectrum is harder than the jet emission with the base temperature determined above, implying the presence of an additional hard component.
1 Introduction
SS 433 is a unique Galactic binary system that exhibits continuous relativistic jets, and hence is an ideal target to study fundamental problems of astrophysical jets, including the acceleration/collimation mechanism, structure, and influence on the environment (for a review, refer to e.g., [Margon (1984), Fabrika (2004)]). The intrinsic speed of the jets is 0.26 ( is the light speed), and the jet axis precesses with a period of 162 days. The optical and X-ray spectra show several pairs of Doppler shifted lines from the bipolar jets. The strong emission lines, such as H and lines from ionized heavy elements, give direct evidence that the jets mainly contain baryonic plasmas. Most recently, Kubota et al. (2010) constrains the mass of the compact object to be 1.9–4.9 , indicating that the supercritical accretion star is most likely a low mass black hole, although a possibility of a massive neutron star cannot be ruled out. The inclination angle and orbital period are accurately measured to be (Margon & Anderson, 1989) and =13.082 days (Goranskii et al., 1998), respectively.
Soon after the discovery of SS 433, many efforts were done to determine the kinematic model and parameters of the jets, by tracing the Doppler shifts of emission lines in the optical spectra. Margon et al. (1979) for the first time proposed a kinetic model, where the jets of about 1/4 the light speed make precession, with a period of 162.15 days, according to the latest value obtained by Gies et al. (2002). In superposition to the “precession” motion, another regular periodicity of the Doppler shifts is observed as a “nodding” motions with an amplitude of and a period of 6.28 days. They are caused by the tidal torques from the companion star. Furthermore, faster random variability of Doppler shifts were sometimes reported (see e.g., Ciatti et al. (1981); Katz & Piran (1982); Iijima (1993); Collins & Garasi (1994)). These phenomena are called as “jitter”, which contains an important clue to understand the collimation mechanism of the jets. The origins of “jitter” have not been understood, in particular whether they are caused by the change of the speed or orientation due to insufficient observational quality (Collins & Garasi, 1994).
SS 433 is also a target of great interest in high energy astrophysics, and has been observed by many satellites from early on (e.g., with EXOSAT, Watson et al. (1986); Tenma, Matsuoka et al. (1986); Ginga, Kawai et al. (1989)). The ASCA satellite, which carried X-ray CCD cameras for the first time, detected many pairs of Doppler shifted emission lines from ionized metals such as Si, S, Ar, Ca, Fe and Ni originating from the twin jets (Kotani et al., 1994). By detailed analysis of the line intensities of FeXXVI K to FeXXV K, Kotani et al. (1996) estimated the length of the X-ray jets and temperature of the jet base to be 1013 cm and 20 keV, respectively. The emission lines are resolved with the Chandra HETGS, which are found to have Doppler widths of 1000–5000 km s-1 (Marshall et al., 2002; Namiki et al., 2003; Lopez et al., 2006). The broad band continuum (up to 100 keV) is approximated by a thermal bremsstrahlung spectrum with a temperature of 10–30 keV, depending whether in- or out-of-eclipse (Kawai et al., 1989; Cherepashchuk et al., 2005). Basically, hydrodynamical radiative plasma flow models are found to successfully apply to the data (Brinkmann et al., 1991; Kotani et al., 1996). Additional complex features are detected from the XMM spectra, however, which could be Compton scattered emission from the jet base (Brinkmann et al., 2005) or an iron-K absorption edge due to partial covering (Kubota et al., 2007). From the width of an eclipse in the 25–50 keV band with INTEGRAL, Cherepashchuk et al. (2007) and Krivosheyev et al. (2009) propose that a hot extended corona around the accretion disk is responsible for the hard X-ray emission via thermal Comptonization with a temperature of 20 keV. High quality X-ray spectra covering the broad band are critical to establish the interpretation of the high energy spectra of SS 433.
Simultaneous, multi-wavelength observations of this source are particularly important to reveal the structure of the jets. Previous studies revealed that X-rays are emitted from a region close to the base of the jets ( cm; Kotani et al. (1996)), while the optical emission originates far away from the jet base at a distance of cm (Fabrika, 2004). Radio synchrotron emission is observed on a larger scale ( cm). Comparison of (quasi) simultaneous data enables us to trace the evolution of the same matter traveling along the jets on a spatial scale of many orders of magnitudes.
For this purpose, we organized a multi-wavelength observation campaign in the period from 2006 March 29 to April 15. The campaign includes two Suzaku observations performed in- and out-of eclipse phase and a large set of optical spectroscopy, optical/IR photometry and radio observations. As for details of this campaign, refer to the papers by Kotani et al. (2006, 2008). In this paper, we present the results from the Suzaku observations and those from optical spectroscopy. Suzaku, the 5th Japanese X-ray satellite, covers the wide energy band from 0.2–600 keV. The large effective area below 10 keV with good energy resolution, and high sensitivity above 10 keV, provides us the best opportunity to investigate time variability of the wide band spectrum of SS 433. § 2 describes the observations and data reduction. The results based on the Suzaku data of out-of-eclipse are summarized in § 3, and those of in-eclipse are in § 4. We discuss our results in § 5, including the comparison of the X-ray and optical data.
2 Observations and Data Reduction
2.1 Suzaku
We observed SS 433 with Suzaku on two occasions, on 2006 April 4–5 and April 8–9 for a net exposure of 40 ks each. Suzaku (Mitsuda et al., 2007) carries the four X-ray Imaging Spectrometers (XIS-0, 1, 2 and 3) coupled with the X-ray Telescopes (XRTs) and the Hard X-ray Detector (HXD), which covers the 0.2–10 keV and 10–600 keV bands, respectively. The XIS-0, 2, and 3 are front-side illuminated CCDs (XIS-FI), while the XIS-1 is a back-side illuminated one (XIS-BI). The energy resolution of the XISs is 130 eV (FWHM) at 6 keV. The first observation was performed at the orbital phase of (as calculated from the ephemeris by Goranskii et al. (1998)), during the midst of an eclipse by the companion star, while the second was at after the source recovered from the eclipse. From our optical observations, the precession phase is found to be (as calculated from the ephemeris by Gies et al. (2002)), when we see the accretion disk in almost an edge-on view. At this precession phase, the directions of the twin jets with respect to the line-of-sight are inverted from those observed at most of the precession phases, and both show redshifts. In this paper, we call the jet with a larger redshift as “red” jet and the other as “blue” jet. The XIS was operated in the normal clock/editing mode without an window option. The target was observed at the XIS nominal position. Table 1 gives the log of the X-ray observations.
2.1.1 XIS data
We analyze the XIS data in a standard manner with the HEAsoft111http://heasrc.nasa.gov/lheasoft version 6.6.2 software package. Photon events are extracted from a circular region centered at the target with a radius of 6 mm (). The background is taken from the surrounding annulus region. For spectral analysis, we make the response matrix file (RMF) and ancillary response file (ARF) using xisrmfgen and xissimarfgen (Ishisaki et al., 2007), respectively. The spectra of all the XIS sensors are combined to improve the statistics, together with the corresponding responses. We screen out events suffering from telemetry saturation, using GTI filters provided by the Suzaku team222http://www-cr.scphys.kyoto-u.ac.jp/menber/hiroya/xis/gtifile.html.
2.1.2 HXD/PIN data
The HXD is a non-imaging collimated X-ray sensor consisting of two
main detection parts; silicon -intrinsic- diodes (hereafter PIN)
and gadolinium silicate crystals (Ce-doped Gd2SiO5; GSO). They
cover the energy range of keV (PIN) and keV (GSO)
with low background levels (Takahashi et al., 2007). In the present
study, we concentrate on the PIN data, since the signals from SS 433
above 40 keV is below the sensitivity of the GSO. Since the
observations were performed in the normal mode of the HXD, we simply
extract the spectra from the PIN event data, following the standard
analysis
procedure333http://heasarc.gsfc.nasa.gov/docs/suzaku/analysis/abc/.
We subtract the non X-ray background (NXB) from the data, utilizing
the modeled NXB distributed by the Suzaku team
444http://www.astro.isas.ac.jp/suzaku/analysis/hxd/pinnxb/. The
version keyword of the NXB files is METHOD=LCFITDT
(i.e., so-called the “tuned background”), which gives the best
reproductivity of the PIN NXB (0.34% systematic error in the
15–40 keV for a 40 ksec exposure; Fukazawa et al. (2009)).
In addition to the NXB, two kinds of diffuse/extended background should be subtracted before the spectral analysis; the cosmic X-ray background (CXB) and the Galactic X-ray background (GXB). The GXB is particularly important because a target source is close to the Galactic plane. Since the surface brightness of the GXB varies field to field, we estimate its spectrum using the PIN data in a near-by field, (OBSID 500009020), located 11 away from SS 433. This region is free from bright X-ray sources and has been well studied with Chandra, from which hundreds of faint point sources are detected below 10 keV (Ebisawa et al., 2005; Revnivtsev & Sazonov, 2007). They cannot be resolved with the PIN, and hence contribute to the PIN signal as a part of the GXB emission. To estimate the summed GXB+CXB flux, we analyze the PIN spectra in this region by subtracting the NXB in the same manner as above. We find the GXB+CXB spectrum can be well fit with a single power-law model in the 12–40 keV band and obtain the best-fit and flux of erg cm-2 s-1. Thus, assuming that the GXB (and the CXB) is the same between this region and that around SS 433, we subtract the modeled GXB+CXB spectrum from the PIN data of SS 433, in addition to the NXB. Figure 1 shows the total and source spectra of SS 433 after the background subtraction for the eclipse and out-of-eclipse phase. The contribution of the NXB, and the sum of the GXB and the CXB are separately plotted. We find that the flux level of the GXB+CXB is only 0.3 times that of the NXB. To evaluate the possible uncertainties in the estimated GXB flux, we refer to the spatial distribution of the GXB obtained from the Galactic ridge survey with the INTEGRAL/IBIS (Krivonos et al., 2007), which covers almost the same energy band as the HXD/PIN. We confirm that the systematic errors by using the different field separated by 10 degrees are smaller than the statistical errors, and hence do not affect our conclusions. Figure 2 shows the light curves of the HXD/PIN in the 12–40 keV from which the NXB is subtracted.
2.2 Optical Spectroscopy
We organized quasi-simultaneous optical spectroscopic observations of SS 433 using ground-based telescopes around the epochs of the Suzaku observations, aiming to trace the evolution of the jet structure from the X-ray and optical data. From 2006 April 2 to 12, four observatories participated in this campaign: the Special Astrophysical Observatory (SAO), the Gunma Astronomical Observatory (GAO), the Nishi-Harima Astronomical Observatory (NHAO), and the Asiago Observatory of the University Padova. Table 2 gives the logs of the optical observations. We observed SS 433 with the 6-m Russian telescope555http://w0.sao.ru/Doc-en/Telescopes/bta/descrip.htm with the Multi Pupil Fiber Spectrograph 666http://w0.sao.ru/Doc-en/Telescopes/bta/instrum/ at the SAO (PI: Fabrika). At the GAO, the 150 cm telescope equipped with GLOWS777http://www.astron.pref.gunma.jp/instruments/device_bcldsi.html (Gunma LOW Resolution spectrograph and imager, =400–500) was used (PI: Kinugasa). At the NHAO, having the 2-m Nayuta telescope888http://www.nhao.go.jp/nhao/telescopes/nayuta.html, we employed the optical spectrograph (Ozaki & Tokimasa, 2005) with a low dispersion mode (1000) for our observations (PI: Ozaki). The Galileo 122-cm telescope was used at the Padova-Asiago Observatory (PI: Iijima, =800). We also took additional spectral data of SS 433 at the GAO about 1-month before and 1 and 2-months after the Suzaku observations. From these data, we determine the Doppler shift of both receding and approaching jets using the H emission lines. Note that we were not able to detect H originating from the jets on April 2 (at GAO) and April 12 (at NHAO) due to the limited signal-to-noise ratio.
3 Suzaku Results I. (out of Eclipse)
In this section, we present the results obtained from the Suzaku data on 2006 April 8–9 (out of eclipse phase). For spectral fitting, we use the XSPEC package999http://heasarc.nasa.gov/docs/xanadu/xspec/ version 11.3.2ag (Arnaud et al., 2006).
3.1 Light Curves
Figure 3 shows the summed XIS light curves of the four sensors in the three energy bands, 0.5–2 keV, 2–5 keV, and 5–10 keV for the XIS-FI (0.3–2 keV, 2–5 keV, and 5–8 keV for the XIS-BI). As noticed, significant variability is found especially in the hard band above the 5 keV. We confirm that this tendency also appear in hard X-ray band light curve in the 12–40 keV band obtained with the HXD/PIN (see Figure 2). For the subsequent analysis, we divide the time region into two, epoch A (the first half), when the intensity and spectrum was almost stable, and epoch B, when the spectrum exhibited a drastic change. Figure 4 shows the XIS spectra in epoch A and B. It is seen that the average spectrum, in particular the iron-K emission line profiles, is very different in the two epochs.
3.2 Individual Spectral Analysis
In this subsection, we study the properties of emission lines originating from the blue and red jets and their evolution based on only the XIS data. To examine the spectral variability, we divide the one day data into eight parts (data number 1 to 8) with an equal interval, and perform spectral fitting to each spectrum. To focus on the iron-K band by making the best use of the energy resolution of the XIS, we only analyze the 5.0–10 keV band.
The fitting model consists of a bremsstrahlung continuum and 11 emission lines, modified by the interstellar absorption. It is expressed as a function of energy :
where is the photo-electric cross section and is the hydrogen column density toward the source. We fix at , which is converted with the formula by Predehl & Schmitt (1995) from =8, a typical extinction for SS 433 (Fabrika, 2004). In this study, for simplicity, we adopt a single temperature bremsstrahlung model for the continuum, considering the limited energy band; although a more complicated model is applied for the analysis of the broad band spectra in the next subsection, the results on the emission lines are little affected. The model includes 11 narrow Gaussian lines, five pairs of Doppler-shifted lines from , , , and from the two jets, and one stationary line of . The Doppler shifts of the red and blue jets are free parameters that are linked together among all the lines originating from the same jet. The velocity dispersion (1 width) of the emission lines is fixed at 1500 km s-1, which is found by Lopez et al. (2006) when the precession phase is the closest to ours among available Chandra HETGS observations.
First, we fit the first four spectra (epoch A) simultaneously, which exhibit little variability. In this fit, the intensities of the 6.4 keV lines are linked one another among all the spectra. Then, we perform spectral fitting to the last four spectra (epoch B) separately. For these spectra, we fix the intensity of the line at the best-fit value obtained from the epoch A data, , since five emission lines (including four jet lines) are blended around 6.4 keV and it is difficult to separate its contribution in epoch B.
Figure 5 plots the time variability of the center energies of the lines emitted from the twin jets. As noticed, we detect rapid variability of the Doppler shifts from data number 6 to 8, with a corresponding rate of 0.019/0.33 day-1. Below we analyze the summed spectra only from data number 1–4 (epoch A), where the change of the line energies is smaller than 20 eV.
3.3 Broad Band Spectra
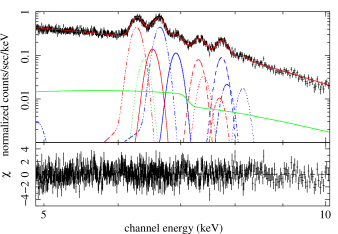
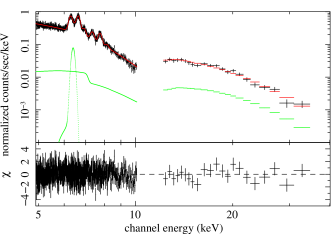
We have obtained the simultaneous, broad band X-ray spectrum of SS 433 covering up to 40 keV with the XIS and HXD/PIN . This gives us an ideal opportunity to investigate the origin of the continuum emission. In this subsection, we perform a simultaneous fitting to the XIS and PIN spectrum in the 5–10 keV and 12–40 keV band, respectively. It is beyond the scope of this paper to apply a fully analytic spectral model of the jets that includes both continuum and line emission by self-consistent calculation. Instead, we only consider a continuum model, over which the 11 emission lines are superposed as independent parameters.
We adopt a multi-temperature bremsstrahlung model for the continuum; assuming a power law dependence of the temperature of the jet on the distance from the jet base , we can compute a model spectrum according to the expected relation between the differential emission measure and temperature. Here we consider a stationary jet model consisting of radiatively cooling, expanding plasmas (e.g., Kotani et al. (1996)). The jets are assumed to move in a truncated cone with a constant velocity. Hence, the density changes as . This model predicts approximately , where is the adiabatic index (5/3 for non relativistic particles). Since we cannot well constrain the power law index from our data, we assume according to this model. The free parameters are the innermost temperature and its normalization.
We also consider a reflection component from cold matter, which is indicated by the presence of the fluorescence 6.4 keV iron K emission line, although it has been neglected in most of previous studies. For this we adopt the reflection code by Magdziarz & Zdziarski (1995), available as reflect model on XSPEC applicable for any incident spectrum. The free parameter is the the reflection strength , where is the solid angle seen by the X-ray emitter (i.e., the jets). We fix solar metal abundances and an inclination angle of 79∘, assuming that the reflection mainly takes place in outer parts of the accretion disk.
The fitting results for the epoch A spectra are shown in Figures 6 and 7. The best-fit parameters are summarized in Table 3. In the analysis, the relative normalization between the XIS and HXD/PIN is fixed at 0.923, based on the calibration using the Crab Nebula (Ishida et al., 2007). We obtain the innermost jet temperature of keV. To make the reflection parameter physically meaningful, we limit in the fitting and finally obtain . The equivalent width of the 6.4 keV line with respect to the reflection component turns out to be 1.0 keV at the best-fit value, well consistent with theoretical calculations (Matt et al., 1991) within a possible range of viewing angle and an iron abundance.
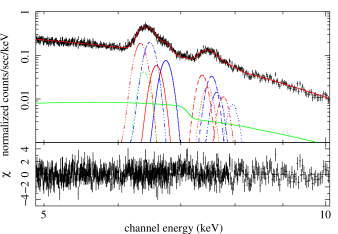
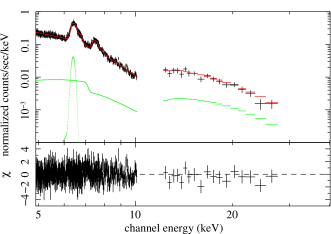
4 Suzaku Results II. (in Eclipse)
The same analysis as in the previous section is applied for the data of the first Suzaku observation (in-eclipse). Figure 8 shows the X-ray light curves on 2006 April 4–5 in the three energy bands. A long term variability is clearly seen, as expected from the eclipse of the jets by the companion star. Similarly to the out-of-eclipse data, we make 8 time-sliced spectra and perform spectral fitting to each one, using the same spectral model described in § 3. In this period, since the spectra around 6.4 keV are very crowded and hence the intensity of the FeI K line cannot be determined, we fix it at , a value that is estimated from the analysis of the broad-band spectra with a reflection component, as described below. Figure 9 shows the evolution of the line center energies of the lines. We do not detect significant variability of the Doppler shifts which were observed in the out-of-eclipse phase (Figure 5).
We also make simultaneous fit to the XIS and HXD/PIN spectra to constrain the continuum model, using the same multi-temperature jet model with a reflection component as described in the previous subsection. We limit and fix the equivalent width of the fluorescence FeI K line with respect to the reflection component at 1.0 keV, based on the result of the out-of-eclipse data, since it is difficult to constrain the absolute intensity from the data. We obtain keV and . Figures 10 and 11 show the data and best-fit model. The best fit parameters are summarized in Table 3.
5 Discussion
5.1 X-ray and Optical Doppler Shift Curves
Figure 12 shows the Doppler shifts of the SS 433 jets measured with the Suzaku XIS (circles) and optical spectroscopy (crosses). The two dot lines correspond to the 162.15 days period sinusoidal curves for the blue and red jets expected from the precession motion (Gies et al., 2002), which is shifted by –5.5 days to fit the observational points. From this figure, it is confirmed that the Suzaku observations were performed at a precession phase when the jets axis are almost perpendicular to the line of sight.
Figure 13 is a blow-up of Figure 12 around the Suzaku observation epoch. It is clearly seen that the observed Doppler shift curves both from the X-ray and optical data show strong deviation from the precession curve with a 162.15 days period. Except for the data around 2006 April 8 (MJD 53834), both amplitude and periodicity of this deviation are consistent with the nodding motion of the jets, expressed as a sinusoidal curve with a 6.28 days period and a semi-amplitude of 0.012 at our precession phase (Fabrika, 2004).
As mentioned above, in the Suzaku XIS data on 2006 April 8, we detect rapid variability of the Doppler shifts, 0.019/0.33 day-1. This is larger than those expected from the precession and/or nodding motion of the jets; the maximum variability from the nodding motion is 0.004/0.33 day-1 (Fabrika, 2004). Hence, we interpret that our Suzaku result corresponds to a jitter which was previously reported only from the optical spectroscopy (e.g., Iijima (1993)), observed for the first time in X-rays. The origin of these phenomena will be discussed in the next subsection.
Utilizing our quasi simultaneous X-ray and optical spectroscopic data, we can determine a time lag between the epochs when same jet material emits X-rays and optical lights, assuming that the Doppler shift remains constant in traveling along the jet. Based on the optical data points on MJD 53834.8 and previous X-ray curves, the lag in the red and blue jet is estimated to be 0.640.08 day and 0.380.08 day, respectively. Assuming that the jets speed is constant at , we estimate the distance of the optical jets measured from the X-ray jets to be cm (red) and cm (blue). Thus, the H emitting region may not be at the symmetric location between the twin jets, depending on the efficiency of the cooling determined by the plasma density. The order of the jet size is well consistent with previous estimates (Fabrika, 2004).
The jitter observed in X-rays on 2006 April 8–9 is confirmed in the optical spectra taken after this event. Since the length of the optical jets is 1000 times larger than that of the X-ray jets, fast time variability observed in X-rays is significantly smeared out in the optical band. Thus, soon after a rapid change of Doppler shifts is observed in X-rays, the optical emission lines become broad (if unresolved), by including the contribution from jet material ejected at different epochs. This is called a “projection effect”, previously observed from nodding motions (Borisov & Fabrika, 1987). Thus, we investigate the change of the width of H lines originating from the jets before and after the second Suzaku observation (out-of-eclipse). The optical spectra observed at the GAO are plotted in Figure 14. We find that while the H line width of the blue and red jets was 40 Å (FWHM) and 58 Å on April 7, the lines became significantly broader with a FWHM of 188 Å and 315 Å, respectively, on April 9. This change of the H line width corresponds to =0.023 (blue jet) and =0.039 (red jet), which is larger only by =0.005 than the total observed change of the Doppler shifts of X-ray lines. Thus, the broadening of the H lines seen in the April 9 spectrum is mainly attributable to the rapid change of the Doppler shifts occurring close to the jet base.
5.2 Origin of the X-ray Jitter
We have detected the fastest variability of Doppler shifts of X-ray emission lines ever observed from SS 433, which can be interpreted as jitter motions of the jets, not the nodding motions where much slower change of redshifts is expected. Assuming that the twin jets are always symmetric, we can estimate the orientation and intrinsic speed of the jets from the observed Doppler shifts of blue and red components. The results are plotted in Figure 15. As noticed from the figure, we detect a significant change in both angle and speed of the jets during the latter interval. From the former half toward the end of the observation, the jet speed increased by a factor of %. Recall that in the same epoch, the X-ray spectra became softer and hence the temperature of the jet decreased. This anti-correlation between the jet speed and temperature must be explained in theoretical models of jets.
Considering the smooth evolution of flux and line center energy, we infer that the X-ray jitter originates from a continuous change of the jet kinetic parameters, not reflecting the production of discrete jets with largely different Doppler shifts. Since the length of the X-ray jets is cm corresponding to a traveling time of only sec, we simply measure the flux-weighted average of Doppler shifts of jets emitted during the integration time ( sec) of each spectrum. If jets with very different Doppler shifts are emitted within each exposure, we would expect broadening of the emission lines. We check the line widths of the emission lines from the 8 time-sliced spectra on 2006 April 8–9. The same fitting model as in § 3 is used, by making the width of Gaussian lines free. We find that the width is almost constant over the observation at eV (the average from the blue jet) and eV (red jet), which are comparable to the observed line width resolved with Chandra/HETGS (Namiki et al., 2003; Lopez et al., 2006). No significant line broadening is observed in epoch B. Thus, we favor the continuously changing jet model, although we cannot exclude the possibility of many discrete jets with slightly different kinetic parameters. In the optical jets, by contrast, the evolution of emission lines from discrete plasmoids were sometimes observed on a time scale of 0.1–0.3 days (Panferov & Fabrika, 1993). The relation of these phenomena to the X-ray jitter is not clear.
5.3 Broad Band X-ray Spectra
We obtain for the first time simultaneous broad band spectra of SS 433 covering up to 40 keV including those observed with CCD resolution below 10 keV with Suzaku. This gives us a unique opportunity to investigate the origin of the spectra not only from the emission lines but also from the continuum shape. We find that the spectrum in eclipse is consistent with the emission from optically thin plasmas in the twin jets as reported in previous works (Brinkmann et al., 1991; Kotani et al., 1996), although the out-of-eclipse spectrum may need an additional hard component to self-consistently explain both emission lines and continuum.
From the line intensities, we can estimate the innermost temperature of the jets based on the radiatively cooling jet model, as done in Kotani et al. (1996). The innermost temperature derived from the ratio of the FeXXV and FeXXVI K emission lines are summarized in Table 3 as “Jet Temperature” . The averaged temperature of the blue and red jets is found to be 13 keV and 16 keV, respectively. Due to the confusion with the 6.4 keV line under the limited energy resolution, these could be a systematic uncertainty in the line intensity of FeXXV. We conservatively estimate the possible systematic errors in the line ratio of FeXXV and FeXXVI to be 10%, which corresponds to 15% (2–3 keV) in the innermost temperature. If we take into account this uncertainty, the averaged innermost temperature is consistent with each other between the out-of-eclipse and in-eclipse phase. In our precession phase (edge-on), the region size obscured by the outer rim of the accretion disk and that by the companion star is similar, and hence there is no large difference in between the two Suzaku observations.
Independently, we are able to constrain the innermost temperature , listed in Table 3, directly from the continuum shape based on the same jet model, thanks to the high quality hard X-ray spectra obtained with the HXD/PIN. We find that in the eclipse phase, this value (211 keV) is close to (163 keV, the average of the blue and red jets). In the out-of-eclipse phase, however, determined from the continuum (272 keV) is significantly higher than that determined from the Fe line ratio (132 keV). These facts suggest that the out-of-eclipse spectrum may be contaminated by an additional hard X-ray component that is hidden in eclipse. The spectrum must be very hard and/or heavily absorbed since its contribution should not be large below 7 keV, where the ratio of the continuum intensity between the out-of-eclipse and in-eclipse phases is similar to that of the iron emission lines originating from the jets. The presence of such a hard component not directly related to the jets was suggested by the comparison of in- and out-of-eclipse spectra observed with Ginga (Brinkmann et al., 1991; Yuan et al., 1995). This may be related to the extended corona around the accretion disk discussed in Krivosheyev et al. (2009) or a reflection feature of the emission from the inner disk by the outer wall of the funnel (Medvedev & Fabrika, 2009). To constrain its origin, analysis of broad band data utilizing a fully self-consistent model for the thermal jets (including both continuum and emission lines) would be required, which we leave for future studies.
Acknowledgment
This work was partly supported by the Grant-in-Aid for JSPS Fellows for young researchers (KK), the Grants-in-Aid for Scientific Research 20540230 (YU), and the Grant-in-Aid for the Global COE Program “The Next Generation of Physics, Spun from Universality and Emergence” from from the Ministry of Education, Culture, Sports, Science and Technology (MEXT) of Japan.
References
- Arnaud et al. (2006) Arnaud, K., Dorman, B., & Gordon, C. 2006, XSPEC: An X-ray Spectral Fitting Package User’s Guide for 12.3.0, HEASARC
- Borisov & Fabrika (1987) Borisov, N. V., & Fabrika, S. N. 1987, Soviet Astronomy Letters, 13, 200
- Brinkmann et al. (1991) Brinkmann, W., Kawai, N., Matsuoka, M., & Fink, H. H. 1991, A&A, 241, 112
- Brinkmann et al. (2005) Brinkmann, W., Kotani, T., & Kawai, N. 2005, A&A, 431, 575
- Cherepashchuk et al. (2007) Cherepashchuk, A. M. et al. 2007, in ESA Special Publication, Vol. 622, ESA Special Publication, 319
- Cherepashchuk et al. (2005) Cherepashchuk, A. M. st al. 2005, A&A, 437, 561
- Ciatti et al. (1981) Ciatti, F., Mammano, A., & Vittone, A. 1981, A&A, 94, 251
- Collins & Garasi (1994) Collins, II, G. W., & Garasi, C. J. 1994, ApJ, 431, 836
- Ebisawa et al. (2005) Ebisawa, K. et al. 2005, ApJ, 635, 214
- Fabrika (2004) Fabrika, S. 2004, Astrophysics and Space Physics Reviews, 12, 1
- Fukazawa et al. (2009) Fukazawa, Y. et al. 2009, PASJ, 61, 17
- Gies et al. (2002) Gies, D. R., McSwain, M. V., Riddle, R. L., Wang, Z., Wiita, P. J., & Wingert, D. W. 2002, ApJ, 566, 1069
- Goranskii et al. (1998) Goranskii, V. P., Esipov, V. F., & Cherepashchuk, A. M. 1998, Astronomy Reports, 42, 209
- Iijima (1993) Iijima, T. 1993, ApJ, 410, 295
- Ishida et al. (2007) Ishida, M., Suzuki, K., & Someya, K. 2007, JX-ISAS-SUZAKU-MEMO-2007-11
- Ishisaki et al. (2007) Ishisaki, Y. et al. 2007, PASJ, 59, 113
- Katz & Piran (1982) Katz, J. I., & Piran, T. 1982, Astrophys. Lett., 23, 11
- Kawai et al. (1989) Kawai, N., Matsuoka, M., Pan, H.-C., & Stewart, G. C. 1989, PASJ, 41, 491
- Kotani et al. (2008) Kotani, T. et al. 2008, in VII Microquasar Workshop: Microquasars and Beyond
- Kotani et al. (1994) Kotani, T. et al. 1994, PASJ, 46, L147
- Kotani et al. (1996) Kotani, T., Kawai, N., Matsuoka, M., & Brinkmann, W. 1996, PASJ, 48, 619
- Kotani et al. (2006) Kotani, T. et al. 2006, in VI Microquasar Workshop: Microquasars and Beyond
- Krivonos et al. (2007) Krivonos, R., Revnivtsev, M., Churazov, E., Sazonov, S., Grebenev, S., & Sunyaev, R. 2007, A&A, 463, 957
- Krivosheyev et al. (2009) Krivosheyev, Y. M., Bisnovatyi-Kogan, G. S., Cherepashchuk, A. M., & Postnov, K. A. 2009, MNRAS, 394, 1674
- Kubota et al. (2007) Kubota, K., Kawai, N., Kotani, T., Ueda, Y., & Brinkmann, W. 2007, in Astronomical Society of the Pacific Conference Series, Vol. 362, The Seventh Pacific Rim Conference on Stellar Astrophysics, ed. Y. W. Kang, H.-W. Lee, K.-C. Leung, & K.-S. Cheng, 121
- Kubota et al. (2010) Kubota, K., Ueda, Y., Fabrika, S., Medvedev, A., Barsukova, E. A., Sholukhova, O., & Goranski, V. P. 2010, ApJ, 709, 1374
- Lopez et al. (2006) Lopez, L. A., Marshall, H. L., Canizares, C. R., Schulz, N. S., & Kane, J. F. 2006, ApJ, 650, 338
- Magdziarz & Zdziarski (1995) Magdziarz, P., & Zdziarski, A. A. 1995, MNRAS, 273, 837
- Margon (1984) Margon, B. 1984, ARA&A, 22, 507
- Margon & Anderson (1989) Margon, B., & Anderson, S. F. 1989, ApJ, 347, 448
- Margon et al. (1979) Margon, B., Grandi, S. A., Stone, R. P. S., & Ford, H. C. 1979, ApJ, 233, L63
- Marshall et al. (2002) Marshall, H. L., Canizares, C. R., & Schulz, N. S. 2002, ApJ, 564, 941
- Matsuoka et al. (1986) Matsuoka, M., Takano, S., & Makishima, K. 1986, MNRAS, 222, 605
- Matt et al. (1991) Matt, G., Perola, G. C., & Piro, L. 1991, A&A, 247, 25
- Medvedev & Fabrika (2009) Medvedev, A., & Fabrika, S. 2009, MNRAS, 1921
- Mitsuda et al. (2007) Mitsuda, K. et al. 2007, PASJ, 59, 1
- Namiki et al. (2003) Namiki, M., Kawai, N., Kotani, T., & Makishima, K. 2003, PASJ, 55, 281
- Ozaki & Tokimasa (2005) Ozaki, S., & Tokimasa, N. 2005, Annual Report of the Nishi-Harima Astronomical Observatory (ISSN 0917-6926), No. 15, p. 15 - 29 (2005), 15, 15
- Panferov & Fabrika (1993) Panferov, A. A., & Fabrika, S. N. 1993, Astronomy Letters, 19, 41
- Predehl & Schmitt (1995) Predehl, P., & Schmitt, J. H. M. M. 1995, A&A, 293, 889
- Revnivtsev & Sazonov (2007) Revnivtsev, M., & Sazonov, S. 2007, A&A, 471, 159
- Takahashi et al. (2007) Takahashi, T. et al. 2007, PASJ, 59, 35
- Watson et al. (1986) Watson, M. G., Stewart, G. C., King, A. R., & Brinkmann, W. 1986, MNRAS, 222, 261
- Yuan et al. (1995) Yuan, W., Kawai, N., Brinkmann, W., & Matsuoka, M. 1995, A&A, 297, 451


| Start | End | Exposure | Remark | ||
|---|---|---|---|---|---|
| (MJD) | (MJD) | (ks) | |||
| Observatory: Suzaku | |||||
| 2006/04/04 14:40 | (53829.6108) | 2006/04/05 12:47 | (53830.5326) | 38.68 | Eclipse |
| 2006/04/08 11:04 | (53833.4610) | 2006/04/09 10:59 | (53834.4578) | 40.20 | |
| Start | Exposure | Remark | |
|---|---|---|---|
| (MJD) | (s) | ||
| Telescope: BTA 6 m. Observatory: SAO. PI: S. Fabrika. | |||
| 2006/04/06 00:45:35 | (53831.0317) | 590 | |
| Telescope: 150 cm. Observatory: Gunma. PI: K. Kinugasa. | |||
| 2006/03/07 19:57:47 | (53801.8297) | 600(the sum of 1205) | |
| 2006/04/02 18:47:00 | (53827.7826) | 900(the sum of 1805) | Line not detected. |
| 2006/04/05 19:15:28 | (53830.8024) | 900(the sum of 1805) | |
| 2006/04/06 18:39:53 | (53831.7777) | 900(the sum of 1805) | |
| 2006/04/07 18:40:42 | (53832.7783) | 900(the sum of 1805) | |
| 2006/04/09 18:38:27 | (53834.7783) | 1080(the sum of 1806) | |
| 2006/05/03 18:16:07 | (53858.7612) | 720(the sum of 1804) | |
| 2006/05/20 17:35:43 | (53875.7441) | 900(the sum of 1805) | |
| Telescope: Nayuta 2 m. Observatory: Nishi-Harima. PI: S. Ozaki. | |||
| 2006/04/03 18:04:52 | (53828.7534) | 1800 | |
| 2006/04/05 17:55:00 | (53830.7465) | ||
| 2006/04/07 17:48:03 | (53832.7417) | 592, 540 | |
| 2006/04/12 08:07:16 | (53837.3384) | 1800 | Line not detected. |
| Telescope: 122 cm. Observatory: Padova-Asiago. PI: T. Iijima. | |||
| 2006/04/12 03:12:57 | (53837.1340) | 1200 | |
| 2006/04/14 02:37:01 | (53839.1090) | 1200 | |
| Parameter | April 8–9 | April 4–5 | ||
|---|---|---|---|---|
| Continuum | ||||
| (keV) | ||||
| R∗ | ||||
| EW∗∗ | (fixed) | |||
| Line Flux: | ||||
| (rest-frame line energy) | Red | Blue | Red | Blue |
| 3.7 (fixed) | ||||
| Jet Temperature∗∗∗ (keV) | ||||
| Redshift | ||||
): , where is the
solid angle of the reflector seen from the emitter (i.e., jets).
): The equivalent width of an FeI K line with respect to the
reflection component.
): Determined from the line intensity ratio between
and based
on a multi-temperature jet model (see text).