AGN population in Hickson’s Compact Groups. I. Data and Nuclear Activity Classification
Abstract
We have conducted a new spectroscopic survey to characterize the nature of nuclear activity in Hickson Compact Groups (HCGs) galaxies and establish its frequency. We have obtained new intermediate resolution optical spectroscopy for 200 member-galaxies and corrected for underlying stellar population contamination using galaxy templates. Spectra for 11 additional galaxies have been acquired from the ESO and 6dF public archives and emission line ratios have been taken from the literature for 59 galaxies more. Here we present the results of our classification of the nuclear activity for 270 member-galaxies, which belong to a well defined sample of 64 HCGs. We found a large fraction of galaxies, 63%, with emission lines. Using standard diagnostic diagrams, 45% of the emission line galaxies were classified as pure AGNs, 23% as Transition Objects (TOs) and 32% as Star Forming Nuclei (SFNs). In the HCGs, the AGN activity appears as the most frequent activity type. Adopting the interpretation that in TOs a Low Luminosity AGN coexists with circumnuclear star formation, the fraction of galaxies with an AGN could rise to 42% of the whole sample. The low frequency (20%) of SFNs confirms that there is no star formation enhancement in HCGs. After extinction correction we found a median AGN H luminosity of 7.11039 erg s-1, which implies that AGNs in HCG have a characteristically low luminosity. This result added to the fact, that there is an almost complete absence of Broad Line AGNs in Compact Groups (CGs) as found by Martínez et al. (2008a) and corroborated in this study for HCGs, is consistent with very few gas left in these galaxies. In general, therefore, what may characterize the level of activity in CGs is a severe deficiency of gas.
1 Introduction
From observations and theoretical simulations it is recognized that gravitational interactions between galaxies must play a fundamental role in the evolution of galaxies. Through star formation, galaxy-galaxy interactions and mergers can influence the mass assembly of galaxies and generate morphological transformations. These processes may also play some role in determining the type of AGN (Active Galactic Nuclei) activity.
The connection between gravitational interactions and enhancement in star formation in galaxies is already well documented (Kennicutt et al., 1987; Keel, 1993; Barton et al., 2000; Woods & Geller, 2007; Lonsdale et al., 1984; Lin et al., 2007). However not all galaxy-galaxy interactions are equally efficient in producing an enhancement of star formation (Bergvall et al., 2003). Simulations (Di Matteo et al., 2008, and references therein) have shown that this depends on various parameters describing the initial conditions of the interactions, like the disk stability of the interacting galaxies, the total mass or relative mass of the interacting components (Cox et al., 2008), the gas content of the galaxies or their relative orbit parameters (Di Matteo et al., 2007).
Many authors have also found evidence suggesting a connection between circumnuclear starburts and AGN (see Storchi-Bergmann, 2008, for review, and references therein). This connection is supported by theoretical considerations. Simulations of interacting galaxies and mergers (Byrd et al., 1987; Springel et al., 2005; Di Matteo et al., 2005) suggest that apart from a central burst of star formation the inflow of gas towards the nucleus of the galaxies could have a positive feed back on a preexisting black hole, increasing its activity. Simulations have shown also that tidal torques, produced during slow galaxy encounters, can transport gas efficiently towards the center of the galaxies (Mihos & Hernquist, 1996; Springel et al., 2005; Di Matteo et al., 2007). However, it is still not clear what fraction of the gas will form stars, increasing the bulges of the galaxies, and what fraction will go deeper to the center of the galaxy to nourish a black hole. Neither it is clear if these processes are really simultaneous or competitive. In particular, we do not know yet if there are physical conditions or galaxy environments under which AGNs may be favored over star formation.
Early works on AGNs suggested that Seyfert activity, without discriminating between Seyfert 1 and Seyfert 2 (hereafter Sy1 and Sy2), appears more frequently in optically disturbed and interacting systems (Adams, 1977; Dahari, 1985; Keel et al., 1985). The results of more recent studies seem less clear on this issue. Some authors (i.e. Moles et al., 1995; Laurikainen & Salo, 1995; Domingue et al., 2005; Woods & Geller, 2007; Kuo et al., 2008) find excesses of AGNs in interacting galaxies, whereas others claim the opposite (Bushouse, 1987; Fuentes-Williams & Stocke, 1988; Schmitt, 2001; Ho et al., 2003; Miller et al., 2003). Different studies propose that the discrepancy can be explained taking into account the scale of the environment, discriminating between small ( 100 kpcs) and large scales (typically until 1 Mpc), and the type of nuclear activity (Dultzin-Hacyan et al., 1999; Koulouridis et al., 2006; Sorrentino et al., 2006; González et al., 2008). On large scales, they found that no difference between the environments of the different AGN types can be seen. On small scales, however, they found that there is a statistically significant higher fraction of Sy2 than Sy1 with close companions. On this matter, we recently found that the environment may be more important than previously thought. Indeed, we report (Martínez et al., 2008a), that there is a remarkable deficiency of broad-line AGNs as compared to narrow-line AGNs in two different samples of Compact Groups of galaxies (CGs), suggesting that tidal or group interaction effects could influence in the AGNs in CGs.
Recent observational studies have shown that a significant fraction of nearby galaxies host an AGN and this fraction increases as the luminosity of the AGN goes down (Ho et al., 1997; Miller et al., 2003; Ho, 2008; Del Olmo et al., 2008; Martínez et al., 2008b). However, as we mention before the relationship between galaxy interaction and nuclear activity is open to debate. To explore further this possible connection we have undertaken a new spectroscopic survey of galaxies in Hickson Compact Groups (Hickson, 1982, HCGs). The main goals of our study are: 1) to characterize the type of nuclear activity present in the galaxy members of HCGs and estimate more reliably its actual frequency; and 2) to establish the relation this activity may have with the properties of the host galaxies and its level of evolution in the group, as well as with the dynamical properties of the group itself.
The present article concentrates on the first goal. We present the classification of nuclear activity for a sample of 270 member-galaxies in 64 HCGs. For this study, we have obtained new long-slit intermediate resolution optical spectroscopic observations for 200 galaxies. All these new spectra were corrected for stellar population contamination subtracting proper galaxy templates. Spectra for eleven additional galaxies were acquired from the ESO and 6dF public archives. To complete our information we also used line measurements for 59 member-galaxies more as determined in previous studies (Kim et al., 1995; Aoki et al., 1996; Verdes-Montenegro et al., 1997; Coziol et al., 1998, 2000; Shimada et al., 2000; Coziol et al., 2004). A following article will be dedicated to the analysis of the relationship between the detected nuclear activity and the properties of the host galaxies and their parent groups, as well as the comparison with other environments.
The organization of this paper is the following: in Section 2 we explain the selection of the sample; in Section 3 we present the new spectroscopic observations and give a general description of the reduction processes used; in Section 4 we present the results obtained for the whole sample of 270 galaxies; the final nuclear activity classification adopted is presented in Section 5, followed by our conclusions in Section 6.
2 Description of the sample
In 1982, Hickson (1982) produced a catalogue of 100 CGs selected from the Palomar Sky Survey. The three criteria used by Hickson to define CGs form today the basis (with some variance) of many subsequent studies on the same subject. The first criterion is one of population and magnitude concordance: the groups must be composed of at least four galaxies, with a difference, at most, of three magnitudes. The second criterion is one of isolation: the radius of the smallest circle containing all the galaxies in a group should be three times smaller than the distance from the group center to the nearest galaxy with less than 3 magnitudes in difference. The last criterion is one of compactness, expressed in terms of surface brightness: the mean surface brightness of the group should be brighter than 26 mag arcsec-2. Subsequent spectroscopic observations (Hickson et al., 1992; Hickson, 1997) have shown that not all galaxies in the original HCGs have concordant redshifts. Therefore, only 92 HCGs have three o more galaxies with concordant redshift. A detailed description of this new whole sample as well as the possible biases introduced by the visual search procedure and the original criteria used is reviewed in Hickson (1997) and references therein.
To carry out our analysis we have selected a well defined sample of 65 HCGs, starting with the 92 HCGs with concordant redshifts and using two additional constraints to minimize the effects of incompleteness in mean group surface brightness and redshift. Hickson (1982) found in the original sample that the catalog becomes incomplete for mean group surface brightness fainter than about 24 mag/arcsec-2. As it can be seen in Figure 1, where we have plotted the mean surface brightness distribution for the whole sample (92 groups), there is a clear deficit of low surface brightness groups and the catalog appears incomplete for groups with about . Also the redshift distribution, plotted in Figure 2, shows that the catalog becomes clearly incomplete for groups with redshifts higher than 0.045. Both limits are marked with an arrow in each respective figure. For our sample we have therefore excluded all groups with mag/arcsec2 (regardless of the redshift) and those groups with z , obtaining a final sample of 65 HCG groups.
Based on the original Hickson (1982) catalogue, these 65 groups contained in total 290 galaxies. However, after later revision (Hickson et al., 1992), only 269 member galaxies remained. For completeness sake, we have rechecked the membership of the galaxies in our sample using our own spectral observations. We found that H3c () and H5d () have concordant redshifts compared to their respective parent groups, and should not have been excluded. The same was found to be true of H48c (), H51f (), H51g () and H72f ().
In the case of HCG43, considered as a quintet by Hickson et al. (1992), we found a discrepant redshift for H43e, namely compared to for its parent group. This makes HCG43 a quartet. We also confirmed that H95b is a foreground galaxy, as pointed out already by Iglesias-Páramo & Vílchez (1998).
Some new members have also been added. We have included NGC1208, with a projected distance of 270 kpc and a with respect to the group velocity, as a member of HCG23. In HCG31, we confirm the membership of H31G as noted by Rubin et al. (1990), and H31Q and H31AN505 as in Verdes-Montenegro et al. (2005), making it a sextet. Barton et al. (1998) found H57h to belong to the group, which we confirm with our spectroscopy. In our sample we have also included NGC7320c in HCG92, as was previously suggested by Moles et al. (1997) and Sulentic et al. (2001), H97-2 in HCG97, as suggested by de Carvalho et al. (1997) and H100d as suggested by Hickson (1993). HCG21 was considered a quintet in Hickson (1982) and a triplet in Hickson et al. (1992). We have considered this group as a quintet, because the excluded galaxies (H21d and H21e) have a difference in radial velocity of less than 1000 km/s with respect to that of the group.
To summarize, after revision of the membership, we added 16 galaxies and excluded 2 (H43e and H95b) obtaining a total of 283 galaxies.
In Table 1 the selected groups are listed with their main characteristics. Columns 2 and 3 contain the position coordinates and (J2000) respectively. In column 4 we give the number of galaxies considered by us as members in each group. In column 5 we give the number of galaxies for which we have obtained spectroscopic observations and identify those for which the spectral information comes from the bibliography or public archives. Since no spectrum was available for any of the galaxy member of the southern group HCG63 (a triplet), our final sample is reduced to 280 galaxies in 64 groups. The mean radial velocity for each group in column 6, was recalculated taking into account the new obtained redshifts and final member-galaxies.
The final selected sample of 64 HCGs contains 54 multiplets (84%) and 10 triplets. A similar percentage is found for the whole HCG catalogue. The morphological type of the galaxies were obtained from the HyperLeda database (Paturel et al., 2003). We find 53% early-type (E or S0, T0), 32% early spirals (S0a-Sbc, 0 T 5) and 15% late spirals (T 5, i.e. Sc). Therefore, early-type galaxies are dominant in our sample, as in the HCG catalog. We also find that 82% of the galaxies are brighter than M, with a median value of magnitudes. The group velocity range goes from 1387 km/s to 12966 km/s.
A value of H0 = 70 km s-1 Mpc-1 is used throughout this article.
3 Observations and Data Reduction
3.1 Spectroscopic Observations
Two-dimensional long-slit spectroscopy were obtained for 200 galaxies in our sample. Four telescopes were used, during various observing runs from 2003 to 2007: 1) the 2.2m telescope in Calar-Alto (CAHA111The Centro Astronómico Hispano Alemán is operated jointly by the Max-Planck Institut fur Astronomie and the IAA-CSIC., Spain); 2) the 2.56m NOT222ALFOSC is owned by the IAA and operated at the Nordic Optical Telescope (NOT), under agreement between IAA and the NBIfAFG of the Astronomical Observatory of Copenhagen. at the Observatorio del Roque de los Muchachos (ORM) in La Palma (Spain); 3) the 2.12m telescope at the Observatorio Astronómico Nacional in San Pedro Mártir (SPM) in Baja California (México); 4) and the 1.5m telescope333The 1.5m is operated by the IAA in the Sierra Nevada Observatory. at Sierra Nevada Observatory (OSN) en el Observatorio de Sierra Nevada in Granada (Spain).
We obtained medium resolution spectroscopy in the optical range 3600-7200 Å, which includes the main nebular emission lines used for standard spectroscopic classification: namely, from [OIII] Å to [SII] Å doublet, including [OI] Å, [NII] Å and the Balmer H and H lines.
Depending on the telescope and the weather conditions, a long slit with a width varying between 1 and 2.5 arcseconds was placed across the nucleus of each galaxy. Except for the SPM observations, where the slit was kept in the E-W direction, the slit was usually oriented along the major axis of the galaxies. In some groups, however, the slit was rotated in order to be able to observe more than one galaxy at a time. In these cases, both galaxies were located near enough to be observed together, but were sufficiently spatially separated in the slit to be clearly resolved. In most cases, the galaxies also have similar magnitudes, which allows reaching comparable signal to noise ratio with the same exposure time.
In Table 2 we summarize for each observatory (column 1) and telescope (column 2), the spectrograph (column 3) and detector used (column 4), as well as the setup for the observation, including the CCD characteristics, like the pixel size (column 5) and total CCD dimension (column 6). The plate scale appears in column 7, followed by the grating (column 8), the corresponding coverage in wavelength (column 9), and reciprocal spectral dispersion (column 10). Whereas only one grating was used to cover the full spectral range at the ORM, SPM and OSN, for the CAHA observations two different gratings, B100 and G100, were necessary to get the same spectral coverage, with similar spectral dispersion.
Exposure times were estimated considering the corresponding magnitudes of the individual galaxies in order to reach a signal to noise ratio (S/N) in the continuum greater than 10. The total exposure time required was usually split in three exposures to reduce the number of cosmic rays, and eliminate them by combining the different exposures of the same galaxy.
In Table 3 we present the journal of the observations. For each galaxy we list the date of the observation in column 2. Note that some galaxies were observed more than once using different telescopes. This was done to check the consistency of our results and in some cases, when the previous observations were judge insufficient, to repeat the observation. For each observation we identify the grating used (column 3), the position angle (PA) of the slit (column 4), the total exposure time (column 5), the effective airmass (column 6) and the slit width used (column 7). In column 8, we give the final aperture, in kpcs, adopted to extract the nuclear spectrum from the original two dimensional data. Reduced unidimensional spectra were used to obtain the spectral activity classification. In column 9 we have also included information about the presence or absence of emission lines in each galaxy.
In the subsequent subsections we explain in more details the observation made in each observatory.
3.1.1 CAHA
Most of the data were obtained in four runs from 2004 to 2006 with the CAFOS spectrograph at the 2.2m of Calar Alto (CAHA), equipped with a SITE elements CCD detector having a pixel size of m. Two grating settings were used to cover the full spectral range. The B100 grating provides a wavelength coverage from 3200Å to 5800Å and the G100 grating one from 4900Å to 7800Å. Both have a reciprocal dispersion of 2 Å/pixel and spectral resolution of 4.8Å. In the spatial direction along the slit, a single pixel on the detector has a projection of 0.53” on the sky. A slit width of 1.5-2” was used according to the seeing condition, which was generally better than 1.2 arcseconds.
In all, we have observed 96 galaxies of our sample with this telescope: 64 galaxies were observed using both configurations (B100 and G100) and 32 using only the G100 grating. Note that due to the redshift of the galaxies, even using only the G100, it was possible, in the majority of the cases, to measure the H and [OIII]Å lines necessary for spectral classification. All the spectra obtained in CAHA have been used to classify the nuclear activity.
3.1.2 ORM
The observations using the 2.56m Nordic Optical Telescope (NOT) were mainly obtained during two runs, in November 2005 and April 2006. But we have also included here previous observations, not yet published, which were made in 1999 (seven galaxies in H26) and 2000 (nine galaxies in different groups). All of our observation used the ALFOSC spectrograph. This spectrograph is equipped with a E2V CCD detector, with a pixel size of m and plate scale of 0.19”/pixel. We used the GR4 grism, with spectral coverage of 3200-9100Å and spectral resolution of 8Å. Some galaxies have also been observed with the GR8 grism, which covers the H region from 5800Å to 8300Å, with a spectral resolution of 3Å.
A total of 55 galaxies of our sample were obtained with this telescope: 53 were observed with the GR4 grism, two galaxies (H26a, H40c) with the GR8 and one (H40d) has been observed with both grisms.
3.1.3 SPM
Observations with the 2.12m telescope of SPM were obtained during three runs: two campaigns in 2004 and one in May 2005. The Boller & Chivens spectrograph used was equipped with a SITE CCD detector, with a pixel size of m and a plate scale of 1.05”/pixel. With only one grating, R300, we could cover the whole spectral range, from 3500-7500Å, at a spectral resolution of 11Å.
The long slit was centered on the most luminous part of the galaxies and aligned in the east-west direction, to minimize errors introduced by guiding. We have observed with this telescope 57 galaxies belonging to the sample.
3.1.4 OSN
We have also obtained spectra during several runs from 2005 to 2007 with the 1.5m telescope at the Observatory of Sierra Nevada in Spain. The ALBIREO spectrograph was equipped with a Loral/Lesser CCD detector with a pixel size of m and a plate scale of 0.9”/pixel. With only one grism, Red4, we could observe the whole spectral range, from 3600 Å to 7500 Å at a spectral resolution of 5Å.
We have observed 65 galaxies of the sample with this configuration. Most of them were observed previously with other telescopes, but in some cases under bad weather conditions. Repeating the observations were consequently considered important to confirm their spectral classification.
3.2 Reduction procedures
The spectra were reduced using the two-dimensional spectrum reduction package in IRAF444IRAF is distributed by the National Optical Astronomy Observatories, which are operated by AURA, Inc., under contract with the National Science Foundation, following standard procedures.
We have built one bias for each night for each observational campaign by combining 10-20 biases taken each night. This bias was subtracted from individual spectra after overscan removal. Flat-field correction was done using a composite flat. Our flat-field reduction takes into account the pixel-to-pixel sensitivity variations of the CCD used and the non-homogeneous illumination effect produces by the slit (using twilight flat-fields). After flat-field correction a median 2D spectrum was obtained for each galaxy by combining the different exposures, eliminating in this way most of the cosmic rays.
Wavelength calibration was done in a standard bidimensional way in IRAF, using comparison lamp observations done at the same telescope position as the galaxies. Flux calibration was performed using STANDARD and SENSFUNC tasks in IRAF. Several spectrophotometric standard stars from the lists of Oke (1990); Hamuy et al. (1992, 1994); Massey et al. (1988) were observed each night for this purpose. When the nights were photometric we calculated a new extinction curve to obtain a better absolute flux calibration, using 3-4 spectrophotometric standard stars with different airmasses. The flux calibration was applied to each galaxy on the two dimensional spectrum. After flux calibration, a two dimensional spectrum without sky contribution was obtained using the APALL subroutine. This step also allows correcting for spatial curvature along the slit. However, this correction is not important in our observations because the galaxies are located at the central spatial sections on the slit. Once we obtained the spectrum of each galaxy, corrected from instrumental response and calibrated in wavelength and flux, we extracted the one-dimensional spectrum in order to measure the flux of the emission lines needed to do the spectral nuclear classification.
The one-dimensional extracted spectra for all the observed galaxies are represented in the Figure Set 3.
3.3 Template subtraction and line measurement
Nuclear spectra of galaxies can be contaminated by absorption features produced by stellar populations in the host galaxy, having intermediate and older ages. When we have emission, this contamination dilute the flux of the more important lines, affecting their ratios and, consequently, their classification. For instance, as the contribution of the bulge component becomes more important, absorption features can hide the presence of weak emission lines, the effect increasing with the aperture of the slit. Usually this contamination should affect only the Balmer lines, but due to the broadness and intensity of some of the absorption features and to the spectral resolution used, it can also affect nearby emission lines, like [NII]6548,6584Å. In CGs, the majority of the galaxies show Balmer absorption lines and correction for the contamination by underlying stellar population is especially important. In particular, many of the galaxies with apparently no or very weak emission features, show, after template subtraction to correct for the absorption dilution, evidence consistent with low luminosity AGNs (hereafter LLAGN; Coziol et al., 1998; Martínez et al., 2008a). Therefore, to obtain a more solid classification of the type of activity present in the galaxies in our sample, we have systematically applied a template correction. As templates, we used the spectra of galaxies without emission which were observed at the same time with the same setup as the emission line galaxies.
We use four different templates for each telescope configuration. These templates show no emission lines, as verified by subtracting the other templates, and have high S/N. Usually they correspond to non-emission galaxies of the HCG observed sample. In some observing runs we also used as template the non-emission galaxy NGC1023, which was frequently used by other authors for such purpose (i.e. Ho et al., 1997). After inspection of all the spectra for each run and setup, the galaxies selected as templates were: H7b, H57c, H93d and NGC1023 for the CAHA observations; H3d, H48a, H79c and H97d for the ORM; H61d, H97a, H98c and NGC1023 for the OSN; and H57f, H82a, H92b and H99b for the SPM observations. The four templates are subtracted from the spectra of each target galaxy, which yields four different corrected spectra per galaxy.
The method to subtract the templates is described in Coziol et al. (1998, 2004). All the spectra are first shifted to zero redshift. Then, two spectral regions of interest for classification, namely one centered on H line, with range 4500-5500Å, and one centered on H, with range 6350-6850Å, are extracted. Each spectrum is then normalized by the corresponding fitted continuum in the equivalent regions of each galaxy and the templates are subtracted. Finally, we multiply each subtracted spectrum by the previously fitted continuum to obtain the original calibrated flux units and measure the line fluxes. Although in principle this procedure is not necessary for those galaxies with strong emissions, or those not showing emission lines, we have performed it to all the spectra for consistency sake and also to verify that no weak emission lines were missed.
After template subtraction, the emission line fluxes were measured in an interactive way using the SPLOT routine in IRAF. The lines measured are the following: H, [OIII]Å, [OI]Å, [NII]Å, H and the doublet [SII]Å. Because the [OI] and the two [SII] lines are not affected by absorption features they were measured without template subtraction and their errors were obtained by quadratic addition of the photo-counting errors and one sigma error of the local continuum. All the other lines were measured after the template subtraction. The emission lines were measured directly over the spectrum without template subtraction for H26a and H40c, two SFN galaxies only observed in the [NII] and H region with GR8 grating, because no templates were available for this setup.
The lines were measured by fitting a Gaussian. In the case of the two [NII] lines and H line, we used the deblend option in the SPLOT task, constraining our fit by using the same FWHM that was obtained for the [SII] lines. When the [SII] lines were too noisy or not available, due mainly to the presence of the atmospheric absorption band, we used the FWHM of the [OIII]Å as a constraint. When a single gaussian fitting did not seemed to be sufficient, we used the NGAUSFIT procedure in IRAF to perform a multiple fit Gaussian components. This task was also used to check for the presence of possible broad components as explained in Martínez et al. (2008a). The final flux was estimated by calculating the median of the four obtained values after template subtraction, adopting the average deviation as the uncertainty.
For each galaxy with emission lines, we list in Table 4 the emission line ratios, in log scale, that were used to determine the nuclear classification: [OIII]/H (column 2), [OI]/H (column 3), [NII]/H (column 4) and [SII]/H (column 5). In column 6 we also include the H flux. In column 7 the observed H luminosity, without extinction correction, is also estimated. Finally in column 8, we list the nuclear classification we adopted, based on the different standard diagnostic diagrams (see Section 5.2).
4 Archive spectra and data from the literature
We have inspected several spectroscopic public archives to complete the number of available spectra of galaxies in our sample. We found spectroscopic data for eleven more galaxies: six in the ESO public archive (H4b, H4d, H32a, H32b, H32d, H91d) and five in the 6dF Archive (H21a, H21b, H21d, H91a, H91b). These spectra have only relative flux calibration. Six galaxies show emission: H4b, H4d, H21a, H21b, H91a and H91b. For these galaxies we have measured the emission line intensities without a template subtraction. The corresponding measured emission line ratios and nuclear classification are given in Table 5. For H32a, H32b, H32d, and H91d only the blue part of the spectrum, within the range 4000-6000Å, seemed available. Because the spectra show no obvious signs of emission, these galaxies were classified as non-emission. For the 6dF spectra, only the red part of the spectrum, within the range 5500-8000Å, is available. H21d was classified as non-emission. H21a, H21b and H91b show evidence of narrow emission lines. In H91a we also detected a broad component for H emission line. For this galaxy, the blue spectrum in the ESO archive shows a broad H component. In fact, this galaxy was already classified as a Seyfert 1.2 by Dahari (1985). It is important to note that this is the only galaxy in our sample which shows the presence of genuine broad emission lines.
For 59 galaxies in our sample, we have collected the line emission ratios from the literature. For 55 galaxies, we took the values listed in Coziol et al. (1998, 2004). The line ratios for H92c and H96a were taken from Aoki et al. (1996) and Kim et al. (1995) respectively, and for H96d they were taken from Verdes-Montenegro et al. (1997). For H21c no published ratios seem available in the literature. since it was observed previously by Coziol et al. (2000), we have adopted their nuclear classification.
In Table 5 we give the line ratios for the extra galaxies taken from the literature, together with the ones we measured on archive spectra (as marked by an asterisk).
5 Nuclear Activity Classification
Adding to our own spectroscopic observations (200 galaxies) the 11 archive spectra and the emission line ratios of the 59 galaxies as found in the literature, we obtained spectral information for 270 of the 280 galaxies (96%) of our HCG sample. The remaining 10 galaxies without spectra turned out to be the fainter (m 17) members of their parent group (H13e, h24d, h24e, h74e, h76g, h94e, h94g) and/or to be unobservable from the north (h21e, h32c, h91c). No data could be found in the literature or in archives.
Of the 270 galaxies, 63% (169 galaxies) show emission lines: 122 are new observations, 6 are measurements from the archive spectra and 41 come from the literature. In this section we describe the process we followed for classifying these galaxies.
5.1 Spectral classification throught Diagnostic Diagrams
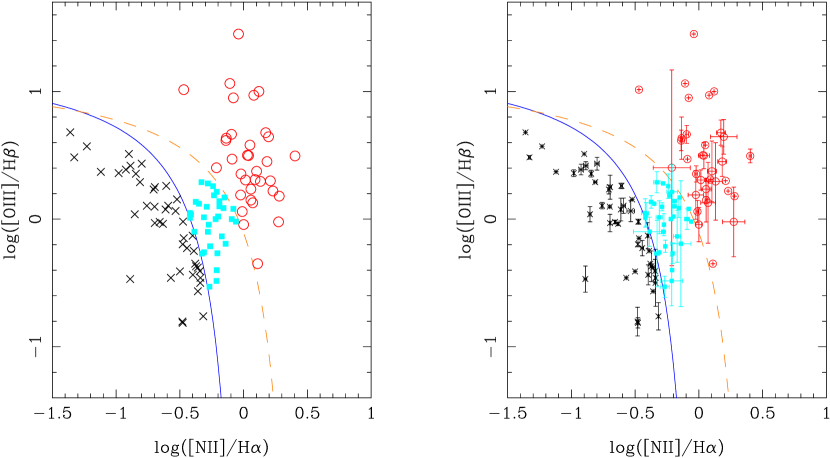
The standard method for narrow emission-line galaxy classification is based on the empirical diagnostic diagrams of line ratios, first introduced by Baldwin et al. (1981) and subsequently refined by Veilleux & Osterbrock (1987). These last authors established different empirical separation sequences using published data for known giant HII regions, Sy2 and LINERs. The most useful diagrams are those that use the ratios of very close emission lines, for example [OIII]5007/H, [NII]6584/H, [SII](/H and [OI]6300 /H. This choice makes them insensitive to reddening and errors in flux calibration. The different empirical separation sequences allow to distinguish between different ionization mechanisms, which are responsible for producing the emission. In particular, they allow to separate photo-ionization by massive OB stars, typical of Star Formation Nuclei (SFNs), from more energetic sources like AGNs (Sy2 or LINER). The most used diagram relates [OIII]/H with [NII]/H, and is recognized as the BPT diagram. There exist other useful diagrams like [OIII]/H versus [OI]/H, hereafter identified as the [OI]-diagram, and [OIII]/H versus [SII]/H, hereafter identified as the [SII]-diagram.
Although diagnostic diagrams are useful in identifying the main source of ionization in galaxies following the empirical distributions devised by Veilleux & Osterbrock (1987), there remains some uncertainty for objects occupying the border regions, or for galaxies that can be classified differently according to one or another diagnostic diagram. In particular, Veron et al. (1997) and Ho et al. (1997) introduced the term Transition Objects (TOs) to characterize emission-line galaxies with line ratios intermediate between SFNs and AGNs. They suggested that in TOs galaxies an AGN (Seyfert or LINER) coexists with circumnuclear star formation regions. The coexistence of star formation in the circumnuclear region of these galaxies dilutes the AGN signature producing the TO spectrum. This interpretation is partly supported by high spatial resolution data. In studies of nearby circumnuclear star formation regions, for example, some authors distinguish a transition in the emission line ratios from the central AGN regime to the SFN one (Bennert et al., 2006; Zuther et al., 2007). Although the physical origin of TOs continues to be an open discussion (Shields et al., 2007), optical and radio observations strongly suggests that TOs harbor AGNs (Filho et al., 2004; Nagar et al., 2005; Ho, 2008).
Sequences defined by Veilleux & Osterbrock (1987) have been extensively used during many years. However, more recently, some authors have defined new separation sequences that can be used in diagnostic diagrams. In Kewley et al. (2001, hereafter Ke01) a combination of stellar population synthesis models and detailed photo-ionization models were used to establish theoretical maximum star formation limit for each diagnostic diagram (BPT, [OI]-diagram and [SII]-diagram). According to Ke01, galaxies lying above these sequences are obviously dominated by an AGN. Later, Kauffmann et al. (2003, hereafter Ka03) showed that the Ke01 line is well above the star formation sequence delineated by a sample of SDSS star forming galaxies and used this characteristic to define a new empirical curve for pure star forming galaxies. Any galaxies below this curve are obviously dominated by star formation. In Kewley et al. (2006), the authors have subsequently defined a new classification scheme (see their Fig. 1), based on the two previously defined sequences (Ke01 and Ka03), to discriminate between SFNs, AGNs and TOs. According to Stasińska et al. (2006), there is effectively a region below the Ke01 sequence which cannot be explained by star formation models with any realistic combination of metallicity, ionization parameters and extinction. They suggested that even below the Ka03 sequence there might be galaxies with an AGN contributing up to 3% in H. Based on a large SDSS sample and using a grid of photo-ionization models, Stasińska et al. (2006) asserted that the BPT diagram is the best diagnostic to distinguish between SFN and AGN galaxies, whereas [OI]- and [SII]- diagrams are less efficient. They also claimed that it is usually possible to distinguish between SFN and AGN using the [NII]/H ratio only.
We will base our classification on the criteria suggested by Kewley et al. (2006) and Stasińska et al. (2006). In Fig. 4 we present an empty BPT diagram to illustrate the classification criteria we have adopted in this study. The two curves correspond respectively to the Ka03 (solid line) and the Ke01 (dashed line) limits. Using both sequences, we have classified the galaxies as pure AGNs if they are located above the Ke01 sequence and as SFNs if they lie below the Ka03 sequence. Galaxies located between the two sequences were consequently classified as TOs. The two vertical lines in the bottom part of the diagram correspond to values for log([NII]/H) of -0.4 and -0.1 respectively. We have used these limits to classify those galaxies for which we have confident values only for the [NII]/H ratio. We have classified as SFNs those galaxies with log([NII]/H) -0.4 and as pure AGNs those with log([NII]/H) -0.1 (corresponding to a [NII]/Hα ratio of 0.8). Again, galaxies with line ratios in between were classified as TOs. The adopted value for the SFNs (-0.4) is the same as in Stasińska et al. (2006). However, we have restricted a bit more the AGN limit (-0.1 instead of their -0.2). This appears more realistic if we take into account the observed value of this ratio for our TOs with all four lines in the BPT diagram (see Fig 5).
Although we did not impose any restriction to the S/N on the lines, all the identified emission galaxies have lines detected at more than 3 confidence level.
5.2 Nuclear Activity for the HCG sample
The majority (111 or 66%) of the 169 emission line galaxies in our sample, have accurate measurements at least for the four most important emission lines: H, [OIII], H and [NII]. For 21 galaxies (12% of the emission galaxies) we obtained valid measurements for [OIII], H and [NII] lines, and in many cases also for the [SII] lines, but H emission is missing due mainly to the weakness of the line compared to the strong stellar absorption. In 33 galaxies (19%) we only acquired measurements for the red lines, in particular for the [NII] and H lines, due to a relatively low S/N in the blue range of their spectrum or because they were observed only with the red grism, so they can not be located in the BPT diagram. For the remaining galaxies (3%) we could not calculate any line ratio: in three galaxies the most conspicuous line corresponds to H and for one, from the literature, only the [NII]6583Å line was detected.
The assigned nuclear activity classification for each galaxy is listed in the last column of tables 4 and 5 respectively for the new observed galaxies and for those coming from the archives and literature. Emission galaxies have been classified as SFNs, AGNs, and TOs according to the criteria described in the previous section.
The 111 galaxies having four line measured are represented on the BPT diagram in Figure 5, using crosses for the SFNs, open circles for pure AGNs and filled squares for the TOs. In the figure on the right is showed the location of each galaxy with the error bars determined, as estimated in section 3.3. According to this diagram, 34 galaxies are AGNs, 33 are TOs and 44 SFNs.
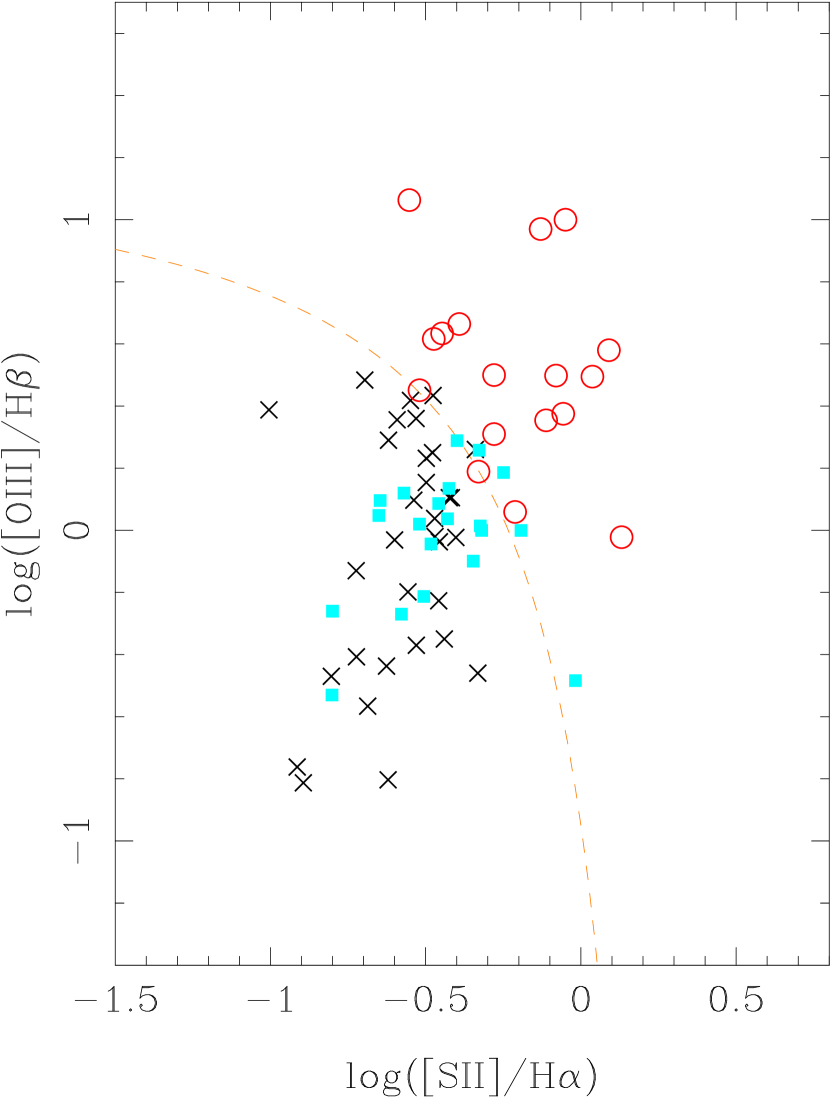
Although our classification is based mainly on the BPT diagram, we have also used the [SII]- and [OI]- diagrams, in the case of reliable detection. 70 of the 111 galaxies from the BPT diagram have measurements for the [SII] lines. Figure 6 shows the location of these galaxies in the [SII]-diagram, where the symbols correspond to the activity type as determined by the BPT diagram. In this figure the dashed line represents the Ke01 sequence, which mainly separates AGNs from the other activity types. As can be seen from the comparison of both figures, there is good concordance between the diagrams. Basically both AGNs and SFNs in the BPT diagram maintain their classification in the [SII]-diagram. We have reclassified 4 TOs from the [NII]-diagram into TO/AGNs taking into account the derived [SII]/H ratios, and the general behavior of their spectra. Their [SII]/H values place them above the Ke01 sequence in the [SII]-diagram, suggesting that the AGN component is the dominant feature.
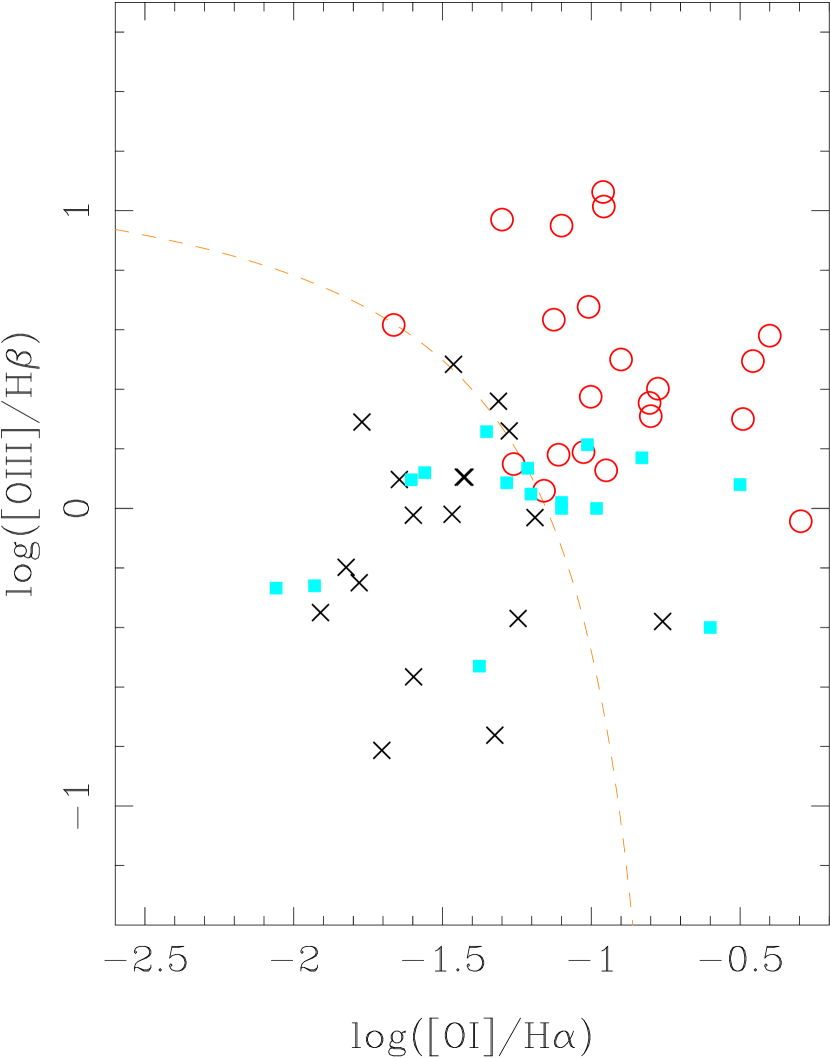
Figure 7 shows the [OI]-diagram for 55 of the 111 galaxies from the BPT diagram with value of the [OI] line. The symbols again correspond to the activity type as determined based on the BPT diagram. The dashed curve represents the corresponding Ke01 sequence in this diagnostic diagram. As in the previous [SII]-diagram, the majority of the galaxies maintain their BPT classification in the [OI]-diagram. We have reclassified 7 TOs from the [NII]-diagram as TO/AGN, taking into account the [OI]/H ratios, which place them well into the AGN region. One of these galaxies was already classified as TO/AGN using the [SII]-diagram. Hereafter, we will count the 10 TO/AGNs as AGNs.
Summarizing our classification, for 111 galaxies with the four main emission lines measured we find 44 SFNs, 23 TOs and 44 AGNs.
For galaxies classified as AGNs we can further distinguish between Sy2 and LINER. Using the same criterion as in Coziol et al. (1998) to separate low from high excitation AGNs, we count about 37% of Sy2. We found the same proportion using the sequence proposed by Kauffmann et al. (2003). Therefore our data indicate that 37% of the AGN population in the sample host Seyfert activity type.
For the 21 emission galaxies with values for [OIII], H and [NII] lines, but without direct measurement of the H line, and for the 33 galaxies without data for the [OIII] and H lines, we have based our classification on the [NII]/H ratio alone, as explained in section 5.1. We find 8 SFNs, 16 TOs and 30 AGNs.
For the remaining 4 galaxies, one (H21c) comes from the literature and the other three (H52b, H76f and H95d) have been observed by us. Coziol et al. (2000) classified H21c as LLAGN, with only [NII]6583 detected. H76f and H95d show only H as the more conspicuous line over the continuum and we classify them as SFNs. In H52b we detect four emission lines: [NII]6548Å, H and the two [SII] lines while [NII]6583Å is inside the atmospheric band, due to the redshift of the galaxy. To obtain its nuclear classification we have estimated the [NII]6583Å flux as 3 times the measured [NII]6548Å intensity, obtaining a [NII]/H ratio of 1.56 which corresponds to an AGN.
Summarizing our results, 63% of the galaxies (169 of 270) in our HCG sample shows emission lines. Using different diagnostic diagrams, we classify 54 as SFNs, 39 as TOs and 76 as AGNs. These represent respectively 32%, 23% and 45% of the emission line galaxies. This confirm that AGN is the most frequent activity type in HCGs. For the whole sample, 37% show no emission, 20% are SFN, 15% are TOs, 28% are AGNs.
5.3 AGN luminosity
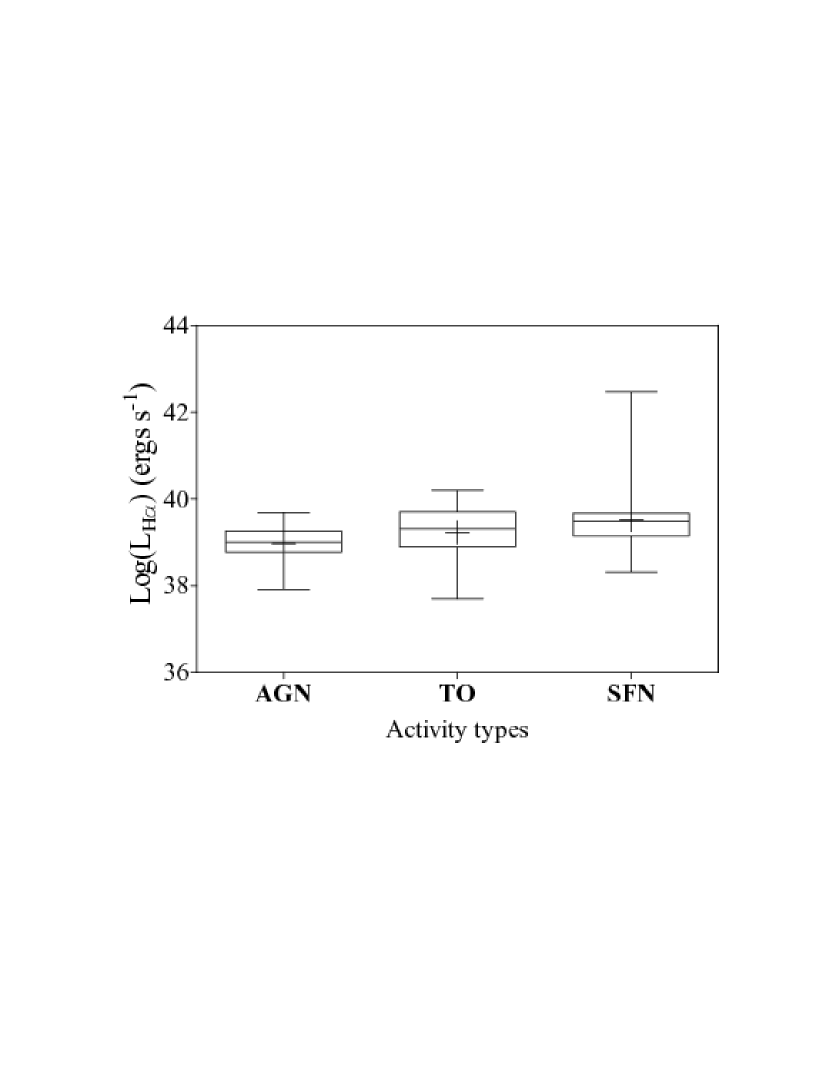
We have estimated the observed nuclear luminosity of the emission line galaxies in our sample by using their measured H fluxes together with their corresponding redshifts. From the 200 new observations, 122 have emission lines and from them 118 have absolute flux calibration. From this subsample, 39 galaxies are classified as SFNs, 26 as TOs and 53 as AGNs. In Figure 8 we show the box-whisker plot for the distribution of luminosity separated by activity types. The SFNs with a median log(LHα) of 39.5 seem to be slightly more luminous than the AGNs, log(LHα) =39.0, while the TOs with a median value of 39.3 look intermediate between the two. A non parametric statistical test (Kruskall-Wallis) confirms an extremely significant difference (P ) between the AGNs and SFNs at a 95% confidence level. No significant statistical differences are accounted from the test between the AGNs and TOs or SFNs and TOs.
In Coziol et al. (1998, 2004), and Martínez et al. (2008a, b), it was pointed out that AGNs in CGs are mostly LLAGNs. Our more complete sample allows us to confirm this claims for the HCGs. The observed H luminosity for the 53 AGNs ranges from 8.31037 to 4.91039erg s-1, with a median of 1.01039erg s-1. These values are below the upper limits of 1040-1041 erg s-1 (Ho et al., 1997; Zhang et al., 2007) which are used to define LLAGNs. This is also verified if we include the 26 TOs. For the resulting 79 galaxies, the observed H luminosity ranges from 5.01037 to 1.581040erg s-1 with a median value of 1.11039erg s-1, confirming that they also would correspond to Low Luminosity AGNs.
For all galaxies hosting an AGN, 43 galaxies have direct measurement of H. For these galaxies we have estimated the extinction corrected H luminosity. Using the extinction law from Cardelli et al. (1989) and an intrinsic relation H/H=3.1, to correct from internal extinction, the corrected LHα ranges from 7.41037 to 9.01040erg s-1, with a median value of 7.11039erg s-1. Even after extinction correction the AGNs are still below the upper limits suggested for the LLAGNs.
In our whole sample, we have found only one genuine Sy1, H91a. Martínez et al. (2008a) showed, using two different samples of CGs, that there is a significant deficiency of broad-line AGNs compared to other environments. This results suggests that in CGs AGNs have broad line regions which are too small to be detected, or, more simply, they do not have such regions. Our present results show that not only BLAGNs are deficient in HCGs but so are high luminosity AGNs in general.
6 Summary and Conclusions
In this paper we presented the nuclear spectral classification for 270 galaxies in 64 HCGs. For this classification we have obtained new spectroscopic observations for 200 member-galaxies, added 11 spectra from ESO and 6dF Archives and for 59 galaxies collected emission line ratios from the literature. After template subtraction we found that a large fraction of these galaxies, 63%, show emission lines, confirming previous spectroscopic results based on smaller samples: 62% of emission for 91 galaxies in 27 HCGs (Coziol et al., 1998, 2004) or 70% on a limited number of the 63 brightest galaxy members in 28 HCGs (Shimada et al., 2000). Comparable fractions of emission line galaxies was also found in other samples of compact groups: 72% in the South Compact Group Catalogue (Coziol et al., 2000) and 68% in Compact Groups from the Update Zwicky Catalogue (Martínez et al., 2007; Martínez, 2008c). In general, therefore, CGs are not deficient in emission-line galaxies.
Using standard diagnostic diagrams we have classified 45% of the emission-line galaxies as AGNs, 32% as SFNs and 23% as TOs. This makes AGN the most frequent activity type encountered in HCG emission galaxies. As we mentioned in Section5.1, recent observations of TOs show the presence of radio and X-ray compact cores (Filho et al., 2002, 2004; Nagar et al., 2005; Ho, 2008) and clear indications that the majority of TOs harbor an AGN (see e.g. review by Ho, 2008, and references therein). Thus, considering that TOs also host AGNs in their nuclei, the fraction of AGNs in HCGs emission galaxies rise to 68% and for the whole sample AGNs form 43%, non-emission galaxies form 37% and SFNs form only 20%.
To realize how important AGNs are in HCGs, one has to compare with what is found in other environments. To do this comparison we consider the fraction of galaxies hosting an AGNs (pure AGNs plus TOs) over the emission galaxy population found in other studies. One important spectroscopic survey of the general field in the nearby Universe is the Palomar sample, with galaxies brighter than 12.5mag in B and mainly located in loose groups, low-density environment and Virgo cluster. For this survey (Ho et al., 1997) reports rates of 50% AGNs (35% AGNs + 15% TOs) and 50% SFNs. Similar results were found by Carter et al. (2001) based on the 15R-North galaxy redshift survey. Kauffmann et al. (2003) using a wide sample of narrow-line AGN from the SDSS and using classification criterions comparable to ours, obtain 40% AGNs compared to 60% SFNs. Miller et al. (2003) reported 26% to 40% AGNs based on a similarly selected sample. The AGN ratio decrease even more if we consider isolated galaxies; Sabater et al. (2008, 2009) found that the fraction of FIR and optical selected AGN-candidates over a sample of isolated galaxies range between 7% and 22%.
Indeed the AGN fraction (68%) we found in the HCGs is therefore significantly higher than what is found in the general field or in isolated galaxies. When going to galaxy clusters, which constitute the opposite end of environment, the difference is even greater. Dressler et al. (1985, 1999) evaluated the fraction of AGNs to be only 1% over the whole sample, percentage that increases to 5-8% when X-ray data are also included (Martini et al., 2007). AGNs seem to avoid galaxy clusters. However these percentages should be taken with caution due the lack of enough comparable optical data available for cluster galaxies.
But what happens if one constrains further the environment?. For two different samples of close galaxy pairs, Woods & Geller (2007) and Focardi et al. (2008) report that the fraction of AGNs can reach 40% of the emission galaxies. This rate, thought enhanced respect to isolated galaxies, is similar to that found in the field and clearly lower than what we detect in compact groups. Therefore AGNs inhabit more frequently in HCGs than in close pairs. Even if galaxy-galaxy encounters also occur in pairs of galaxies, this only mechanism could not be so efficient to feed the AGN activity in pairs as in compact group environment, suggesting that direct galaxy-galaxy interaction alone will be not enough to explain the AGN fraction found in HCGs and that other parameters, like for example the evolutionary state of the structure must be considered.
A high number of AGNs seem, therefore, like a proper trait of the HCGs. However, another important trait seems to be the low luminosity of these AGNs. After extinction correction we found a median AGN H luminosity of LHα=7.11039 erg s-1, which confirms that AGNs in HCGs correspond mainly to Low Luminosity AGNs (Coziol et al., 2004; Martínez et al., 2008b; Martínez, 2008c). From the 76 galaxies classified as AGN, only two (H5a and H91a) show broad components: H5a is a Sy1.9 (almost a Sy 2) and H91a a Sy 1.2. This gives a ratio of broad to narrow line AGNs of only 3%, which makes HCGs deficient in such AGNs. This is in agreement with the deficit of BLAGNs found Martínez et al. (2008a) based in a smaller sample of HCGs. An extensive discussion about biases and detection limits can be found in that work.
The low percentage of galaxies hosting SFNs, only 20% of the total sample and 32% of the emission galaxies, is also quite remarkable. It clearly indicates that there is no enhancement of star formation in HCGs (Iglesias-Páramo & Vílchez, 1999; Coziol et al., 2000). This result is in good agreement with the truncation of star formation previously detected in early-type HCG galaxies (de la Rosa et al., 2007), the nearly complete suppression of star formation reported in groups like H79 and H92 (Durbala et al., 2008; Sulentic et al., 2001) and the relatively low FIR emission observed in HCGs in general (Verdes-Montenegro et al., 1998). Also, spiral galaxies in HCGs seem particularly deficient in HI, with a mean value of only 24% of the expected gas content observed (Verdes-Montenegro et al., 2001). So, in terms of activity, the main characteristic of HCGs seems related to a general absence or severe deficiency of gas. The low luminosity of the AGNs and absence of Broad Line Regions could be a direct consequence of this characteristic. The few gas remaining in the nuclei is not enough for broad line regions to form and the resulting low accretion rates originate a low luminosity AGN.
References
- Adams (1977) Adams, T. F. 1977, ApJS, 33, 19
- Aoki et al. (1996) Aoki, K., Ohtani, H., Yoshida, M., & Kosugi, G. 1996, AJ, 111, 140
- Baldwin et al. (1981) Baldwin, J. A., Phillips, M. M., & Terlevich, R. 1981, PASP, 93, 5
- Barton et al. (1998) Barton, E. J., de Carvalho, R. R., & Geller, M. J. 1998, AJ, 116, 1573
- Barton et al. (2000) Barton, E. J., Geller, M. J., & Kenyon, S. J. 2000, ApJ, 530, 660
- Bennert et al. (2006) Bennert, N., Jungwiert, B., Komossa, S., Haas, M., & Chini, R. 2006, A&A, 456, 953
- Bergvall et al. (2003) Bergvall, N., Laurikainen, E. & Aalto, S. 2003, A&A, 405, 31
- Bushouse (1987) Bushouse, H. A. 1987, ApJ, 320, 49
- Byrd et al. (1987) Byrd, G. G., Sundelius, B., & Valtonen, M. 1987, A&A, 171, 16
- Cardelli et al. (1989) Cardelli, J. A., Clayton, G. C., & Mathis, J. S. 1989, ApJ, 345, 245
- Carter et al. (2001) Carter, B. J., Fabricant, D. G., Geller, M. J., Kurtz, M. J., & McLean, B. 2001, ApJ, 559, 606
- Cox et al. (2008) Cox, T. J., Jonsson, P., Somerville, R.S., Primack, J.R. & Dekel, A. 2008, MNRAS, 384, 386
- Coziol et al. (1998) Coziol, R., Ribeiro, A. L. B., de Carvalho, R. R., & Capelato, H. V. 1998, ApJ, 493, 563
- Coziol et al. (2000) Coziol, R., Iovino, A., & de Carvalho, R. R. 2000, AJ, 120, 47
- Coziol et al. (2004) Coziol, R., Brinks, E., & Bravo-Alfaro, H. 2004, AJ, 128, 68
- Dahari (1985) Dahari, O. 1985, ApJS, 57, 643
- de Carvalho et al. (1997) de Carvalho, R. R., Ribeiro, A. L. B., Capelato, H. V., & Zepf, S. E. 1997, ApJS, 110, 1
- de la Rosa et al. (2007) de la Rosa, I. G., de Carvalho, R. R., Vazdekis, A., & Barbuy, B. 2007, AJ, 133, 330
- Del Olmo et al. (2008) Del Olmo, A., Martínez, M. A., Focardi, P., & Perea, J. 2008, Revista Mexicana de Astronomia y Astrofisica Conference Series, 32, 174
- Di Matteo et al. (2005) Di Matteo, T., Springel, V., & Hernquist, L. 2005, Nature, 433, 604
- Di Matteo et al. (2007) Di Matteo, P., Combes, F., Melchior, A.-L., & Semelin, B. 2007, A&A, 468, 61
- Di Matteo et al. (2008) Di Matteo, P., Bournaud, F., Martig, M., Combes, F., Melchior, A.L. & Semelin, B. 2008, A&A, 492, 31
- Domingue et al. (2005) Domingue, D. L., Sulentic, J. W., & Durbala, A. 2005, AJ, 129, 2579
- Dressler et al. (1985) Dressler, A., Thompson, I. B., & Shectman, S. A. 1985, ApJ, 288, 481
- Dressler et al. (1999) Dressler, A., Smail, I., Poggianti, B. M., Butcher, H., Couch, W. J., Ellis, R. S., & Oemler, A. J. 1999, ApJS, 122, 51
- Dultzin-Hacyan et al. (1999) Dultzin-Hacyan, D., Krongold, Y., Fuentes-Guridi, I., & Marziani, P. 1999, ApJ, 513, L111
- Durbala et al. (2008) Durbala, A., del Olmo, A., Yun, M. S., Rosado, M., Sulentic, J. W., Plana, H., Iovino, A., Perea, J., Verdes-Montenegro, L., & Fuentes-Carrera, I. 2008, AJ, 135, 130
- Filho et al. (2002) Filho, M. E., Barthel, P. D., & Ho, L. C. 2002, ApJS, 142, 223
- Filho et al. (2004) Filho, M. E., Fraternali, F., Markoff, S., Nagar, N. M., Barthel, P. D., Ho, L. C., & Yuan, F. 2004, A&A, 418, 429
- Focardi et al. (2008) Focardi, P., Zitelli, V., & Marinoni, S. 2008, A&A, 484, 655
- Fuentes-Williams & Stocke (1988) Fuentes-Williams, T., & Stocke, J. T. 1988, AJ, 96, 1235
- González et al. (2008) González, J. J., Krongold, Y., Dultzin, D., Hernández-Toledo, H. M., Huerta, E. M., Olguín, L., Marziani, P., & Cruz-González, I. 2008, Revista Mexicana de Astronomia y Astrofisica Conference Series, 32, 170
- Hamuy et al. (1992) Hamuy, M., Walker, A. R., Suntzeff, N. B., Gigoux, P., Heathcote, S. R., & Phillips, M. M. 1992, PASP, 104, 533
- Hamuy et al. (1994) Hamuy, M., Suntzeff, N. B., Heathcote, S. R., Walker, A. R., Gigoux, P., & Phillips, M. M. 1994, PASP, 106, 566
- Hickson (1982) Hickson, P. 1982, ApJ, 255, 382
- Hickson et al. (1992) Hickson, P., Mendes de Oliveira, C., Huchra, J. P., & Palumbo, G. G. 1992, ApJ, 399, 353
- Hickson (1993) Hickson, P. 1993, Atlas of compact groups of galaxies (New York: Gordon and Breach Science Publishers)
- Hickson (1997) Hickson, P. 1997, ARA&A, 35, 357
- Ho et al. (1997) Ho, L. C., Filippenko, A. V., & Sargent, W. L. W. 1997, ApJS, 112, 315
- Ho et al. (2003) Ho, L. C., Filippenko, A. V., & Sargent, W. L. W. 2003, ApJ, 583, 159
- Ho (2008) Ho, L. C. 2008, ARA&A, 46, 475
- Iglesias-Páramo & Vílchez (1998) Iglesias-Páramo, J., & Vílchez, J. M. 1998, AJ, 115, 1791
- Iglesias-Páramo & Vílchez (1999) Iglesias-Páramo, J., & Vílchez, J. M. 1999, ApJ, 518, 94
- Kauffmann et al. (2003) Kauffmann, G., et al. 2003, MNRAS, 346, 1055
- Keel et al. (1985) Keel, W. C., Kennicutt, R. C., Jr., Hummel, E., & van der Hulst, J. M. 1985, AJ, 90, 708
- Keel (1993) Keel, W. C. 1993, AJ, 106, 1771
- Kennicutt et al. (1987) Kennicutt, R. C., Jr., Roettiger, K. A., Keel, W. C., van der Hulst, J. M., & Hummel, E. 1987, AJ, 93, 1011
- Kewley et al. (2001) Kewley, L. J., Dopita, M. A., Sutherland, R. S., Heisler, C. A., & Trevena, J. 2001, ApJ, 556, 121
- Kewley et al. (2006) Kewley, L. J., Groves, B., Kauffmann, G., & Heckman, T. 2006, MNRAS, 372, 961
- Kim et al. (1995) Kim, D.-C., Sanders, D. B., Veilleux, S., Mazzarella, J. M., & Soifer, B. T. 1995, ApJS, 98, 129
- Koulouridis et al. (2006) Koulouridis, E., Plionis, M., Chavushyan, V., Dultzin-Hacyan, D., Krongold, Y., & Goudis, C. 2006, ApJ, 639, 37
- Kuo et al. (2008) Kuo, C.-Y., Lim, J., Tang, Y.-W., & Ho, P. T. P. 2008, ApJ, 679, 1047
- Laurikainen & Salo (1995) Laurikainen, E., & Salo, H. 1995, A&A, 293, 683
- Lin et al. (2007) Lin, L., et al. 2007, ApJ, 660, L51
- Lonsdale et al. (1984) Lonsdale, C. J., Persson, S. E., & Matthews, K. 1984, ApJ, 287, 95
- Martínez et al. (2007) Martínez, M. A., del Olmo, A., Focardi, P., & Perea J. 2007 Highlights of Spanish Astrophysics IV ”Proceedings of the VII Scientific Meeting of the Spanish Astronomical Society” ,Springer, Eds.: F. Figueras, J.M. Girart, M. Hernanz, C. Jordi, (astroph/0611099)
- Martínez et al. (2008a) Martínez, M. A., del Olmo, A., Coziol, R., & Focardi, P. 2008a, ApJ, 678, L9
- Martínez et al. (2008b) Martínez, M. A., Del Olmo, A., Coziol, R., & Perea, J. 2008b, Revista Mexicana de Astronomia y Astrofisica Conference Series, 32, 164
- Martínez (2008c) Martínez, M. A. 2008c, Ph.D. Thesis
- Martini et al. (2007) Martini, P., Mulchaey, J. S., & Kelson, D. D. 2007, ApJ, 664, 761
- Massey et al. (1988) Massey, P., Strobel, K., Barnes, J. V., & Anderson, E. 1988, ApJ, 328, 315
- Mihos & Hernquist (1996) Mihos, J. C., & Hernquist, L. 1996, ApJ, 464, 641
- Miller et al. (2003) Miller, C. J., Nichol, R. C., Gómez, P. L., Hopkins, A. M., & Bernardi, M. 2003, ApJ, 597, 142
- Moles et al. (1995) Moles, M., Marquez, I., & Perez, E. 1995, ApJ, 438, 604
- Moles et al. (1997) Moles, M., Sulentic, J. W., & Marquez, I. 1997, ApJ, 485, L69
- Nagar et al. (2005) Nagar, N. M., Falcke, H., & Wilson, A. S. 2005, A&A, 435, 521
- Oke (1990) Oke, J. B. 1990, AJ, 99, 1621
- Paturel et al. (2003) Paturel, G., Petit, C., Prugniel, P., Theureau, G., Rousseau, J., Brouty, M., Dubois, P., & Cambrésy, L. 2003, A&A, 412, 45
- Rubin et al. (1990) Rubin, V. C., Hunter, D. A., & Ford, W. K. J. 1990, ApJ, 365, 86
- Sabater et al. (2008) Sabater, J., Leon, S., Verdes-Montenegro, L., Lisenfeld, U., Sulentic, J., & Verley, S. 2008, A&A, 486, 73
- Sabater et al. (2009) Sabater, J., Leon, S., Verdes-Montenegro, L., Lisenfeld, U., Sulentic, J., & Verley, S. 2009, arXiv:0909.3793
- Schmitt (2001) Schmitt, H. R. 2001, AJ, 122, 2243
- Shields et al. (2007) Shields, J. C., et al. 2007, ApJ, 654, 125
- Shimada et al. (2000) Shimada, M., Ohyama, Y., Nishiura, S., Murayama, T., & Taniguchi, Y. 2000, AJ, 119, 2664
- Sorrentino et al. (2006) Sorrentino, G., Radovich, M., & Rifatto, A. 2006, A&A, 451, 809
- Springel et al. (2005) Springel, V., Di Matteo, T., & Hernquist, L. 2005, ApJ, 620, L79
- Stasińska et al. (2006) Stasińska, G., Cid Fernandes, R., Mateus, A., Sodré, L., & Asari, N. V. 2006, MNRAS, 371, 972
- Storchi-Bergmann (2008) Storchi-Bergmann, T. 2008, Revista Mexicana de Astronomia y Astrofisica Conference Series, 32, 139
- Sulentic et al. (2001) Sulentic, J. W., Rosado, M., Dultzin-Hacyan, D., Verdes-Montenegro, L., Trinchieri, G., Xu, C., & Pietsch, W. 2001, AJ, 122, 2993
- Veilleux & Osterbrock (1987) Veilleux, S., & Osterbrock, D. E. 1987, ApJS, 63, 295
- Verdes-Montenegro et al. (1997) Verdes-Montenegro L., del Olmo A., Perea J.,et al. 1997, A&A, 321, 409
- Verdes-Montenegro et al. (1998) Verdes-Montenegro, L., Yun, M. S., Perea, J., del Olmo, A., & Ho, P. T. P. 1998, ApJ, 497, 89
- Verdes-Montenegro et al. (2001) Verdes-Montenegro, L., Yun, M. S., Williams, B. A., Huchtmeier, W. K., Del Olmo, A., & Perea, J. 2001, A&A, 377, 812
- Verdes-Montenegro et al. (2005) Verdes-Montenegro L., del Olmo A., Yun M.S. & Perea J.,2005, A&A, 430, 443
- Veron et al. (1997) Veron, P., Goncalves, A. C., & Veron-Cetty, M.-P. 1997, A&A, 319, 52
- Woods & Geller (2007) Woods, D. F., & Geller, M. J. 2007, AJ, 134, 527
- Zhang et al. (2007) Zhang, X.-G., Dultzin-Hacyan, D., & Wang, T.-G. 2007, MNRAS, 374, 691
- Zuther et al. (2007) Zuther, J., Iserlohe, C., Pott, J.-U., Bertram, T., Fischer, S., Voges, W., Hasinger, G., & Eckart, A. 2007, A&A, 466, 451


| Name | Ng | Ns | Vr | Name | Ng | Ns | Vr | |||||
|---|---|---|---|---|---|---|---|---|---|---|---|---|
| J2000 | J2000 | (km/s) | J2000 | J2000 | (km/s) | |||||||
| H1 | 00 26 00.2 | +25 43 05 | 4 | 4 | 10158 | H56 | 11 32 39.6 | +52 56 25 | 5 | 5 | 8116 | |
| H3 | 00 34 27.4 | -07 35 35 | 4 | 4 | 7835 | H57 | 11 37 50.5 | +21 59 06 | 8 | 8 | 9087 | |
| H4 | 00 34 15.9 | -21 26 48 | 3 | 3 | 7770 | H59 | 11 48 26.6 | +12 42 40 | 4 | 4 | 4113 | |
| H5 | 00 38 54.3 | +07 03 36 | 4 | 4 | 12405 | H61 | 12 12 24.9 | +29 11 21 | 3 | 3 | 3919 | |
| H6 | 00 39 10.1 | -08 23 43 | 4 | 4 | 11118 | H62 | 12 53 08.1 | -09 13 27 | 4 | 4 | 4148 | |
| H7 | 00 39 23.9 | +00 52 41 | 4 | 4 | 4243 | H63 | 13 02 10.0 | -32 46 05 | 3 | 0 | 9316 | |
| H10 | 01 26 13.0 | +34 42 41 | 4 | 4 | 4794 | H64 | 13 25 43.3 | -03 51 28 | 3 | 3 | 10699 | |
| H13 | 01 32 22.1 | -07 52 52 | 5 | 4 | 12436 | H67 | 13 49 03.5 | -07 12 20 | 4 | 4 | 7385 | |
| H16 | 02 09 31.3 | -10 09 31 | 4 | 4 | 3901 | H68 | 13 53 40.9 | +40 19 07 | 5 | 5 | 2382 | |
| H21 | 02 45 17.1 | -17 37 10 | 5 | 4 | 8051 | H69 | 13 55 30.7 | +25 03 46 | 4 | 4 | 8914 | |
| H22 | 03 03 31.3 | -15 40 32 | 3 | 3 | 2679 | H72 | 14 47 55.2 | +19 03 27 | 5 | 5 | 12773 | |
| H23 | 03 07 06.5 | -09 35 08 | 5 | 5 | 4731 | H74 | 15 19 28.2 | +20 53 37 | 5 | 4 | 11960 | |
| H24 | 03 20 18.9 | -10 51 53 | 5 | 3 | 9447 | H75 | 15 21 33.8 | +21 11 00 | 6 | 6 | 12482 | |
| H26 | 03 21 54.2 | -13 38 45 | 7 | 7 | 9457 | H76 | 15 31 41.9 | +07 18 29 | 7 | 6 | 10015 | |
| H28 | 04 27 19.5 | -10 19 00 | 3 | 3 | 11452 | H79 | 15 59 11.9 | +20 45 31 | 4 | 4 | 4418 | |
| H30 | 04 36 28.6 | -02 49 57 | 4 | 4 | 4545 | H80 | 15 59 12.3 | +65 13 33 | 4 | 4 | 9112 | |
| H31 | 05 01 38.3 | -04 15 25 | 6 | 6 | 3917 | H82 | 16 28 22.1 | +32 49 25 | 4 | 4 | 10756 | |
| H32 | 05 01 42.9 | -15 25 12 | 4 | 3 | 12242 | H85 | 18 50 22.3 | +73 21 00 | 4 | 4 | 11705 | |
| H33 | 05 10 47.9 | +18 02 05 | 4 | 4 | 7824 | H86 | 19 51 59.2 | -30 49 34 | 4 | 4 | 5804 | |
| H34 | 05 21 47.4 | +06 40 37 | 4 | 4 | 9164 | H87 | 20 48 11.9 | -19 50 35 | 3 | 3 | 8855 | |
| H37 | 09 13 35.6 | +30 00 51 | 5 | 5 | 6538 | H88 | 20 52 22.8 | -05 45 28 | 4 | 4 | 6023 | |
| H38 | 09 27 38.8 | +12 16 51 | 3 | 3 | 8626 | H90 | 22 02 05.6 | -31 58 00 | 4 | 4 | 2624 | |
| H40 | 09 38 54.5 | -04 51 07 | 5 | 5 | 6526 | H91 | 22 09 10.4 | -27 47 45 | 4 | 3 | 7128 | |
| H42 | 10 00 21.8 | -19 38 57 | 4 | 4 | 4025 | H92 | 22 35 57.5 | +33 57 36 | 5 | 5 | 6634 | |
| H43 | 10 11 13.8 | -00 01 54 | 4 | 4 | 9928 | H93 | 23 15 24.2 | +18 58 59 | 4 | 4 | 5070 | |
| H44 | 10 18 00.5 | +21 48 44 | 4 | 4 | 1387 | H94 | 23 17 16.5 | +18 43 11 | 7 | 5 | 12444 | |
| H46 | 10 22 12.8 | +17 51 30 | 4 | 4 | 7976 | H95 | 23 19 31.8 | +09 29 31 | 3 | 3 | 11778 | |
| H47 | 10 25 48.4 | +13 43 54 | 4 | 4 | 9610 | H96 | 23 27 58.3 | +08 46 27 | 4 | 4 | 8802 | |
| H48 | 10 37 45.6 | -27 04 50 | 4 | 4 | 3394 | H97 | 23 47 22.9 | -02 19 34 | 6 | 6 | 6838 | |
| H49 | 10 56 36.5 | +67 10 45 | 4 | 4 | 10044 | H98 | 23 54 12.7 | +00 22 24 | 3 | 3 | 7886 | |
| H51 | 11 22 20.9 | +24 17 35 | 7 | 7 | 7881 | H99 | 00 00 43.7 | +28 23 20 | 5 | 5 | 8655 | |
| H52 | 11 26 18.7 | +21 05 21 | 3 | 3 | 12966 | H100 | 00 01 20.8 | +13 07 57 | 4 | 4 | 5275 | |
| H54 | 11 29 15.5 | +20 35 06 | 4 | 4 | 1472 |
Note. — Group radial velocities have been calculated using galaxy radial velocity extracted from our spectra, otherwise, radial velocity was taken from HYPERLEDA database.
| Obs. | Tel. | Spectrograph | Detector | pixel | Dimension | Scale | Grism | Range | Disp. |
|---|---|---|---|---|---|---|---|---|---|
| m/px | “/px | Å | Å/px | ||||||
| CAHA | 2.2m | CAFOS | SITE | 24 | 20482048 | 0.53 | B100 | 3600-6200 | 2 |
| G100 | 4300-7800 | 2.12 | |||||||
| ORM | 2.5m | ALFOSC | E2V | 15 | 20482048 | 0.19 | GR4 | 3600-8000 | 3 |
| (NOT) | GR8 | 5825-8350 | 1.24 | ||||||
| OSN | 1.5m | ALBIREO | Loral/Leser | 15 | 20482048 | 0.90 | Red4 | 3600-7500 | 2 |
| SPM | 2.1m | Boller-Chivens | SITE | 24 | 10241024 | 1.05 | R300 | 3800-7500 | 4.3 |
| Id. | Date | Conf | PA | Texp | Aimass | Slitwidth | Ap. | Emission |
|---|---|---|---|---|---|---|---|---|
| (o) | (s) | (“) | (kpc) | |||||
| H1a | 18 Nov 2004 | B100+G100 | 36.2 | 2400+2400 | 1.04 | 1.5 | 1.13 | Yes |
| H1b | 18 Nov 2004 | B100+G100 | 36.2 | 2400+2400 | 1.04 | 1.5 | 1.13 | No |
| H1c | 19 Nov 2004 | B100+G100 | 84.5 | 3200+3400 | 1.02 | 2.0 | 1.11 | Yes |
| H1d | 19 Nov 2004 | B100+G100 | 84.5 | 3200+3400 | 1.02 | 2.0 | 1.11 | Yes |
| H3a | 01 Nov 2005 | GR4 | 148.3 | 2400 | 1.30 | 1.0 | 1.00 | Yes |
| H3b | 01 Nov 2005 | GR4 | 148.3 | 2400 | 1.30 | 1.0 | 1.00 | Yes |
| H3c | 01 Nov 2005 | GR4 | 84.1 | 3000 | 1.24 | 1.0 | 1.00 | Yes |
| H3d | 01 Nov 2005 | GR4 | 84.1 | 3000 | 1.24 | 1.0 | 1.00 | No |
| H5a | 17 Nov 2004 | B100+G100 | 176.6 | 2700+2700 | 1.16 | 1.5 | 1.34 | Yes |
| H5b | 16 Nov 2004 | B100+G100 | 152.0 | 4500+3600 | 1.17 | 1.5 | 1.35 | Yes |
| H5c | 16 Nov 2004 | B100+G100 | 152.0 | 4500+3600 | 1.17 | 1.5 | 1.38 | No |
| H5d | 17 Nov 2004 | B100+G100 | 176.6 | 2700+2700 | 1.16 | 1.5 | 1.39 | Yes |
| H6a | 03 Nov 2005 | GR4 | 64.2 | 2700 | 1.28 | 1.0 | 1.00 | No |
| H6b | 03 Nov 2005 | GR4 | 64.2 | 2700 | 1.28 | 1.0 | 1.00 | Yes |
| H6c | 03 Nov 2005 | GR4 | 118.9 | 4200 | 1.41 | 1.0 | 1.00 | No |
| H6d | 03 Nov 2005 | GR4 | 118.9 | 4200 | 1.41 | 1.0 | 1.00 | Yes |
| H7a | 13 Nov 2004 | B100+G100 | 154.0 | 1800+1800 | 1.30 | 2.0 | 1.08 | Yes |
| H7b | 14 Nov 2004 | B100+G100 | 170.4 | 2700+2160 | 1.24 | 1.5 | 1.09 | No |
| H7c | 15 Nov 2004 | B100+G100 | 133.0 | 3300+2700 | 1.39 | 1.5 | 1.04 | Yes |
| H7d | 14 Nov 2004 | B100+G100 | 170.4 | 2700+2160 | 1.24 | 1.5 | 1.06 | Yes |
| H10a | 15 Nov 2004 | B100+G100 | 56.0 | 1800+1800 | 1.21 | 2.0 | 1.04 | Yes |
| H10b | 30 Sep 2006 | Red4 | 90.0 | 1800 | 1.08 | 2.0 | 0.91 | No |
| H10c | 17 Nov 2004 | B100+G100 | 45.0 | 2700+2340 | 1.07 | 1.5 | 1.11 | Yes |
| H10d | 19 Nov 2004 | B100+G100 | 146.0 | 2700+2700 | 1.17 | 2.0 | 1.10 | Yes |
| H13a | 02 Nov 2005 | GR4 | 127.9 | 2700 | 1.30 | 1.0 | 1.00 | Yes |
| H13b | 02 Nov 2005 | GR4 | 127.9 | 2700 | 1.30 | 1.0 | 1.00 | Yes |
| H13c | 02 Nov 2005 | GR4 | 127.9 | 2700 | 1.30 | 1.0 | 1.00 | Yes |
| H13d | 03 Nov 2005 | GR4 | 178.6 | 3900 | 1.29 | 1.0 | 1.00 | No |
| H23b | 01 Nov 2005 | Red4 | 90.0 | 3600 | 1.46 | 2.0 | 0.92 | Yes |
| H23N | 02 Nov 2005 | Red4 | 90.0 | 2700 | 1.60 | 2.0 | 0.81 | Yes |
| H24a | 02 Nov 2005 | Red4 | 90.0 | 3600 | 1.50 | 2.0 | 1.73 | No |
| H24b | 04 Nov 2005 | Red4 | 90.0 | 3600 | 1.53 | 2.5 | 1.71 | Yes |
| H24c | 18 Sep 2006 | Red4 | 90.0 | 6000 | 1.53 | 2.0 | 1.74 | No |
| H26a | 09 Nov 1999 | GR8 | 70.4 | 3600 | 1.46 | 1.2 | 1.00 | Yes |
| H26b | 09 Nov 1999 | GR4 | 147.2 | 1200 | 1.62 | 1.2 | 1.00 | Yes |
| H26c | 10 Nov 1999 | GR4 | 118.3 | 900 | 2.18 | 1.2 | 1.00 | No |
| H26d | 09 Nov 1999 | GR4 | 147.2 | 1200 | 1.62 | 1.2 | 1.00 | No |
| H26e | 05 Sep 1999 | GR4 | 46.5 | 2700 | 1.40 | 1.2 | 1.00 | Yes |
| H26f | 10 Nov 1999 | GR4 | 118.3 | 900 | 2.18 | 1.2 | 1.00 | Yes |
| H26g | 05 Sep 1999 | GR4 | 46.5 | 2700 | 1.40 | 1.2 | 1.00 | Yes |
| H28a | 02 Nov 2005 | GR4 | 86.0 | 2700 | 1.30 | 1.0 | 1.00 | Yes |
| H28b | 02 Nov 2005 | GR4 | 128.4 | 3000 | 1.30 | 1.0 | 1.00 | Yes |
| H28c | 02 Nov 2005 | GR4 | 128.4 | 3000 | 1.30 | 1.0 | 1.00 | No |
| H30a | 14 Nov 2004 | B100+G100 | 128.0 | 1660+1440 | 1.31 | 2.0 | 1.03 | No |
| H30b | 14 Nov 2004 | B100+G100 | 30.0 | 1800+1440 | 1.40 | 2.0 | 1.10 | Yes |
| H30c | 16 Nov 2004 | B100+G100 | 128.2 | 3600+2400 | 1.43 | 2.0 | 1.08 | Yes |
| H30d | 16 Nov 2004 | B100+G100 | 128.2 | 3600+2400 | 1.43 | 2.0 | 1.11 | No |
| H31a | 19 Nov 2004 | B100+G100 | 90.0 | 3300+2520 | 1.34 | 2.0 | 1.04 | Yes |
| H31b | 15 Nov 2004 | B100+G100 | 35.0 | 2700+2340 | 1.38 | 2.0 | 1.07 | Yes |
| H31c | 19 Nov 2004 | B100+G100 | 90.0 | 3300+2520 | 1.34 | 2.0 | 1.05 | Yes |
| H31G | 02 Nov 2005 | GR4 | 135.7 | 3600 | 1.24 | 1.0 | 1.00 | Yes |
| 01 Nov 2005 | Red4 | 90.0 | 4500 | 1.34 | 2.0 | 0.75 | ||
| H31Q | 02 Nov 2005 | Red4 | 90.0 | 5400 | 1.34 | 2.0 | 0.76 | Yes |
| H31An | 29 Nov 2005 | Red4 | 90.0 | 3600 | 1.38 | 2.0 | 0.74 | Yes |
| H33a | 13 Nov 2004 | B100+G100 | 57.5 | 3600+2700 | 1.06 | 2.0 | 1.10 | Yes |
| H33b | 13 Nov 2004 | B100+G100 | 8.0 | 2700+2400 | 1.20 | 1.5 | 1.03 | No |
| H33c | 17 Nov 2004 | G100 | 45.0 | 1800 | 1.06 | 1.5 | 1.01 | Yes |
| H33d | 13 Nov 2004 | B100+G100 | 57.5 | 3600+2700 | 1.06 | 2.0 | 1.14 | No |
| H34a | 17 Nov 2004 | B100+G100 | 122.2 | 4800+3600 | 1.19 | 1.5 | 0.99 | Yes |
| H34b | 18 Nov 2004 | B100+G100 | 145.4 | 3300+2700 | 1.16 | 1.5 | 1.06 | Yes |
| H34c | 18 Nov 2004 | B100+G100 | 145.4 | 3300+2700 | 1.16 | 1.5 | 1.03 | Yes |
| H34d | 17 Nov 2004 | B100+G100 | 122.2 | 4800+3600 | 1.19 | 1.5 | 1.13 | No |
| H37c | 13 Mar 2005 | G100 | 163.4 | 3600 | 1.04 | 1.5 | 1.08 | Yes |
| 17 Mar 2005 | B100 | 163.4 | 3600 | 1.03 | 1.5 | 1.08 | ||
| H37e | 13 Mar 2005 | G100 | 163.4 | 3600 | 1.04 | 1.5 | 1.05 | Yes |
| 17 Mar 2005 | B100 | 163.4 | 3600 | 1.03 | 1.5 | 1.05 | ||
| H38a | 16 Nov 2004 | B100+G100 | 152.0 | 2700+2700 | 1.23 | 2.0 | 1.13 | Yes |
| H38b | 06 Mar 2004 | R300 | 90.0 | 2700 | 1.06 | 2.5 | 4.15 | Yes |
| 15 Nov 2004 | B100+G100 | 85.1 | 2700+2160 | 1.12 | 2.0 | 1.12 | ||
| H38c | 15 Nov 2004 | B100+G100 | 85.1 | 2700+2160 | 1.12 | 2.0 | 1.13 | Yes |
| H40a | 20 Nov 2006 | Red4 | 16.0 | 3600 | 1.48 | 2.0 | 1.24 | No |
| H40b | 20 Nov 2006 | Red4 | 160.0 | 3600 | 1.48 | 2.0 | 1.28 | No |
| H40c | 28 Apr 2000 | GR8 | 122.0 | 1800 | 1.48 | 1.2 | 1.00 | Yes |
| H40d | 28 Apr 2000 | GR4+GR8 | 68.3 | 1200 | 1.79 | 1.2 | 1.00 | Yes |
| H40e | 18 Nov 2004 | G100 | 54.0 | 3600 | 1.48 | 1.5 | 1.09 | Yes |
| H43a | 06 Mar 2006 | G100 | 69.5 | 2700 | 1.26 | 1.5 | 1.12 | Yes |
| 25 Mar 2006 | Red4 | 90.0 | 4500 | 1.48 | 2.0 | 1.90 | ||
| H43b | 06 Mar 2006 | G100 | 69.5 | 2700 | 1.26 | 1.5 | 1.11 | Yes |
| 25 Mar 2006 | Red4 | 90.0 | 4500 | 1.51 | 2.0 | 1.89 | ||
| H43c | 08 Mar 2006 | B100+G100 | 176.1 | 3600+3300 | 1.40 | 1.5 | 1.09 | No |
| H43d | 08 Mar 2006 | B100+G100 | 176.1 | 3600+3300 | 1.40 | 1.5 | 1.09 | Yes |
| H43e* | 16 Apr 2007 | Red4 | 90.0 | 7200 | 1.26 | 2.0 | 1.80 | Yes |
| H44a | 05 Mar 2004 | R300 | 90.0 | 2700 | 1.01 | 2.5 | 0.79 | Yes |
| H44b | 05 Mar 2004 | R300 | 90.0 | 2700 | 1.05 | 2.5 | 0.84 | No |
| H44c | 07 Mar 2004 | R300 | 90.0 | 2700 | 1.02 | 2.5 | 0.70 | Yes |
| H44d | 06 Mar 2006 | G100 | 139.0 | 1500 | 1.15 | 1.5 | 1.07 | Yes |
| H46a | 06 May 2005 | R300 | 90.0 | 2700 | 1.03 | 2.5 | 3.62 | Yes |
| 01 Apr 2006 | GR4 | 118.1 | 3000 | 1.16 | 1.2 | 1.00 | ||
| 28 Mar 2006 | Red4 | 90.0 | 3960 | 1.20 | 2.0 | 1.41 | ||
| H46b | 06 May 2005 | R300 | 12.0 | 2700 | 1.08 | 2.5 | 3.49 | Yes |
| 01 Apr 2006 | GR4 | 118.1 | 3000 | 1.16 | 1.2 | 1.00 | ||
| H46c | 06 May 2005 | R300 | 12.0 | 2700 | 1.08 | 2.5 | 2.95 | Yes |
| 01 Apr 2006 | GR4 | 81.8 | 3000 | 1.04 | 1.2 | 1.00 | ||
| H46d | 08 May 2005 | R300 | 90.0 | 2700 | 1.03 | 2.5 | 3.14 | No |
| 01 Apr 2006 | GR4 | 81.8 | 3000 | 1.04 | 1.2 | 1.00 | ||
| H47a | 07 May 2005 | R300 | 144.0 | 2700 | 1.06 | 2.5 | 3.90 | Yes |
| 18 Mar 2006 | G100 | 40.5 | 2700 | 1.12 | 1.5 | 1.06 | ||
| H47b | 07 May 2005 | R300 | 144.0 | 2700 | 1.06 | 2.5 | 3.86 | Yes |
| 18 Mar 2006 | G100 | 40.5 | 2700 | 1.12 | 1.5 | 1.04 | ||
| H47c | 07 May 2005 | R300 | 132.0 | 2700 | 1.12 | 2.5 | 4.20 | Yes |
| 18 Mar 2006 | G100 | 51.8 | 3600 | 1.09 | 1.5 | 1.05 | ||
| H47d | 07 May 2005 | R300 | 132.0 | 2700 | 1.12 | 2.5 | 3.02 | Yes |
| 18 Mar 2006 | G100 | 51.8 | 3600 | 1.09 | 1.5 | 1.05 | ||
| H48a | 02 Apr 2006 | GR4 | 189.0 | 2700 | 1.95 | 1.2 | 1.00 | No |
| H48b | 02 Apr 2006 | GR4 | 189.0 | 2700 | 1.95 | 1.2 | 1.00 | Yes |
| H48c | 02 Apr 2006 | GR4 | 199.7 | 4200 | 1.78 | 1.2 | 1.00 | No |
| H48d | 02 Apr 2006 | GR4 | 199.7 | 4200 | 1.78 | 1.2 | 1.00 | No |
| H49a | 25 Apr 2000 | GR4 | 81.1 | 4200 | 1.29 | 1.2 | 1.00 | Yes |
| H49b | 25 Apr 2000 | GR4 | 150.3 | 1800 | 1.53 | 1.2 | 1.00 | Yes |
| H49c | 26 Apr 2000 | GR4 | 111.4 | 1800 | 1.43 | 1.2 | 1.00 | Yes |
| H49d | 26 Apr 2000 | GR4 | 111.4 | 1800 | 1.43 | 1.2 | 1.00 | Yes |
| H51a | 03 May 2005 | R300 | 90.0 | 2700 | 1.01 | 2.5 | 4.60 | No |
| 17 Mar 2005 | G100 | 3.8 | 3700 | 1.05 | 1.5 | 1.13 | ||
| H51b | 04 May 2005 | R300 | 90.0 | 2700 | 1.01 | 2.5 | 3.61 | Yes |
| 17 Mar 2005 | G100 | 168.8 | 3600 | 1.03 | 1.5 | 1.05 | ||
| H51c | 03 May 2005 | R300 | 90.0 | 2700 | 1.09 | 2.5 | 4.23 | Yes |
| 17 Mar 2005 | G100 | 4.9 | 3600 | 1.11 | 1.5 | 1.14 | ||
| H51d | 03 May 2005 | R300 | 90.0 | 2700 | 1.03 | 2.5 | 2.91 | Yes |
| 17 Mar 2005 | G100 | 4.9 | 3600 | 1.11 | 1.5 | 1.11 | ||
| H51e | 04 May 2005 | R300 | 90.0 | 2700 | 1.02 | 2.5 | 3.14 | Yes |
| 17 Mar 2005 | G100 | 168.8 | 3600 | 1.03 | 1.5 | 1.13 | ||
| H51f | 17 Mar 2005 | G100 | 3.8 | 2700 | 1.05 | 1.5 | 1.11 | No |
| 02 Apr 2006 | GR4 | 164.6 | 3300 | 1.42 | 1.2 | 1.00 | ||
| 24 Mar 2006 | Red4 | 90.0 | 3600 | 1.04 | 2.0 | 1.41 | ||
| H51g | 02 Apr 2006 | GR4 | 164.6 | 3300 | 1.42 | 1.2 | 1.00 | No |
| 24 Mar 2006 | Red4 | 90.0 | 4500 | 1.06 | 2.0 | 1.41 | ||
| H52a | 18 Mar 2005 | G100 | 178.3 | 3600 | 1.07 | 2.0 | 1.43 | No |
| 08 Mar 2006 | B100 | 178.3 | 3300 | 1.04 | 2.0 | 1.43 | ||
| H52b | 18 Mar 2005 | G100 | 66.0 | 3600 | 1.20 | 2.0 | 1.44 | Yes |
| 28 Mar 2006 | Red4 | 90.0 | 4500 | 1.05 | 2.0 | 2.44 | ||
| H52c | 18 Mar 2005 | G100 | 178.3 | 3600 | 1.07 | 2.0 | 1.39 | Yes |
| 08 Mar 2006 | B100 | 178.3 | 3300 | 1.04 | 2.0 | 1.39 | ||
| H57a | 29 Feb 2004 | R300 | 131.0 | 2700 | 1.02 | 2.5 | 7.70 | Yes |
| 16 May 2006 | Red4 | 90.0 | 2700 | 1.13 | 2.0 | 3.23 | ||
| H57b | 08 May 2005 | R300 | 14.0 | 2700 | 1.02 | 2.5 | 3.98 | Yes |
| 13 Mar 2005 | B100+G100 | 163.4 | 2700+2700 | 1.08 | 1.5 | 0.99 | ||
| H57c | 06 May 2005 | R300 | 131.0 | 2700 | 1.09 | 2.5 | 4.31 | No |
| 13 Mar 2005 | B100+G100 | 163.4 | 2700+2700 | 1.08 | 1.5 | 1.00 | ||
| H57d | 29 Feb 2004 | R300 | 131.0 | 2700 | 1.02 | 2.5 | 5.18 | Yes |
| H57e | 08 May 2005 | R300 | 90.0 | 2700 | 1.07 | 2.5 | 3.54 | Yes |
| 16 Mar 2005 | G100 | 168.3 | 3600 | 1.11 | 1.5 | 0.99 | ||
| H57f | 08 May 2005 | R300 | 90.0 | 2700 | 1.18 | 2.5 | 3.74 | No |
| 16 Mar 2005 | G100 | 168.3 | 3600 | 1.11 | 1.5 | 1.06 | ||
| 25 Mar 2006 | Red4 | 90.0 | 3960 | 1,05 | 2.0 | 1.79 | ||
| H57g | 08 May 2005 | R300 | 14.0 | 2700 | 1.02 | 2.5 | 3.83 | No |
| H57h | 25 Mar 2006 | Red4 | 90.0 | 3600 | 1.05 | 2.0 | 1.73 | Yes |
| H59a | 05 Apr 2005 | Red4 | 90.0 | 2700 | 1.15 | 2.0 | 0.77 | Yes |
| H59b | 06 Mar 2006 | B100+G100 | 72.1 | 2900+3400 | 1.13 | 2.0 | 1.08 | Yes |
| 07 May 2005 | Red4 | 90.0 | 3960 | 1.10 | 2.5 | 0.73 | ||
| H59c | 05 Apr 2005 | Red4 | 90.0 | 4500 | 1.10 | 2.0 | 0.81 | Yes |
| H59d | 06 Mar 2006 | B100+G100 | 72.1 | 2900+3400 | 1.13 | 2.0 | 1.06 | Yes |
| H61a | 05 Mar 2004 | R300 | 90.0 | 2700 | 1.00 | 2.5 | 2.18 | Yes |
| 20 Apr 2006 | Red4 | 90.0 | 1800 | 1.03 | 2.0 | 0.71 | ||
| H61c | 05 Mar 2004 | R300 | 90.0 | 2700 | 1.04 | 2.5 | 3.49 | Yes |
| 20 Apr 2006 | Red4 | 90.0 | 1620 | 1.09 | 2.0 | 0.74 | ||
| H61d | 07 Mar 2004 | R300 | 90.0 | 2700 | 1.00 | 2.5 | 2.70 | No |
| 01 May 2006 | Red4 | 90.0 | 4800 | 1.01 | 2.0 | 0.74 | ||
| H62b | 30 Apr 2006 | Red4 | 90.0 | 2700 | 1.48 | 2.0 | 0.68 | No |
| H64a | 01 Apr 2006 | GR4 | 176.8 | 2700 | 1.34 | 1.2 | 1.00 | Yes |
| H64b | 01 Apr 2006 | GR4 | 176.8 | 2700 | 1.34 | 1.2 | 1.00 | Yes |
| H64c* | 01 Apr 2006 | GR4 | 2.4 | 2700 | 1.21 | 1.2 | 1.00 | Yes |
| H64d | 01 Apr 2006 | GR4 | 2.4 | 2700 | 1.21 | 1.2 | 1.00 | No |
| H67c | 02 Apr 2006 | GR4 | 28.9 | 2700 | 1.24 | 1.2 | 1.00 | Yes |
| H67d | 02 Apr 2006 | GR4 | 28.9 | 2700 | 1.24 | 1.2 | 1.00 | Yes |
| H68d | 06 May 2005 | Red4 | 90.0 | 2700 | 1.00 | 2.5 | 0.45 | Yes |
| H68e | 06 May 2005 | Red4 | 90.0 | 2700 | 1.01 | 2.5 | 0.45 | No |
| H69a | 29 Feb 2004 | R300 | 90.0 | 2700 | 1.01 | 2.5 | 8.72 | Yes |
| 07 May 2006 | Red4 | 90.0 | 6000 | 1.05 | 2.0 | 1.66 | ||
| H69b | 28 Feb 2004 | R300 | 90.0 | 2700 | 1.00 | 2.5 | 8.27 | Yes |
| H69c | 28 Feb 2004 | R300 | 90.0 | 2700 | 1.00 | 2.5 | 5.80 | No |
| 08 May 2006 | Red4 | 90.0 | 6000 | 1.05 | 2.0 | 1.60 | ||
| H69d | 29 Feb 2004 | R300 | 90.0 | 2700 | 1.01 | 2.5 | 4.35 | No |
| H72a | 07 May 2005 | R300 | 90.0 | 2700 | 1.04 | 2.5 | 4.24 | No |
| 06 May 2005 | Red4 | 90.0 | 2700 | 1.12 | 2.5 | 2.34 | ||
| H72b | 07 May 2005 | R300 | 90.0 | 2700 | 1.04 | 2.5 | 2.52 | No |
| 16 Mar 2005 | G100 | 131.1 | 3600 | 1.06 | 1.5 | 1.36 | ||
| H72c | 07 May 2005 | R300 | 112.0 | 2700 | 1.13 | 2.5 | 4.43 | No |
| 17 Mar 2005 | G100 | 19.8 | 3600 | 1.06 | 1.5 | 1.44 | ||
| H72d | 07 May 2005 | R300 | 112.0 | 2700 | 1.13 | 2.5 | 4.69 | No |
| 16 Mar 2005 | G100 | 131.1 | 3600 | 1.06 | 1.5 | 1.38 | ||
| H72f | 17 Mar 2006 | G100 | 19.8 | 3600 | 1.06 | 1.5 | 1.54 | No |
| H75a | 04 May 2005 | R300 | 157.0 | 2700 | 1.02 | 2.5 | 5.11 | No |
| 05 Apr 2005 | Red4 | 90.0 | 3600 | 1.11 | 2.0 | 2.34 | ||
| H75b | 04 May 2005 | R300 | 157.0 | 2700 | 1.02 | 2.5 | 3.32 | Yes |
| 05 Apr 2005 | Red4 | 90.0 | 3960 | 1.04 | 2.0 | 2.29 | ||
| H75c | 04 May 2005 | R300 | 86.0 | 2700 | 1.04 | 2.5 | 4.17 | Yes |
| 16 May 2006 | Red4 | 90.0 | 5280 | 1.05 | 2.0 | 2.30 | ||
| 16 May 2006 | B100+G100 | 126.0 | 3600+3600 | 1.21 | 1.5 | 1.35 | ||
| H75d | 08 May 2005 | R300 | 90.0 | 2700 | 1.02 | 2.5 | 5.86 | Yes |
| 16 May 2006 | B100+G100 | 126.0 | 3600+3600 | 1.21 | 1.5 | 1.36 | ||
| H75e | 04 May 2005 | R300 | 90.0 | 2700 | 1.04 | 2.5 | 4.17 | No |
| 23 May 2006 | B100+G100 | 111.0 | 3600+3600 | 1.06 | 2.0 | 1.35 | ||
| H75f | 04 May 2005 | R300 | 157.0 | 2700 | 1.02 | 2.5 | 4.88 | No |
| 23 May 2006 | B100+G100 | 111.0 | 3600+3600 | 1.06 | 2.0 | 1.44 | ||
| H76a | 08 Mar 2006 | G100 | 135.1 | 2340 | 1.18 | 1.5 | 1.11 | No |
| 25 Mar 2006 | Red4 | 90.0 | 4500 | 1.19 | 2.0 | 1.88 | ||
| H76b | 08 Mar 2006 | G100 | 135.1 | 2340 | 1.18 | 1.5 | 1.10 | Yes |
| 01 Apr 2006 | GR4 | 18.8 | 2700 | 1.08 | 1.2 | 1.00 | ||
| 27 Mar 2006 | Red4 | 90.0 | 3600 | 1.16 | 2.0 | 1.87 | ||
| H76c | 01 Apr 2006 | GR4 | 18.8 | 2700 | 1.08 | 1.2 | 1.00 | No |
| 25 Mar 2006 | Red4 | 90.0 | 3960 | 1.24 | 2.0 | 1.99 | ||
| H76d | 02 Apr 2006 | GR4 | 78.5 | 3000 | 1.09 | 1.2 | 1.00 | No |
| 20 Apr 2006 | Red4 | 90.0 | 3000 | 1.15 | 2.0 | 1.90 | ||
| H76e | 02 Apr 2006 | GR4 | 78.5 | 3000 | 1.09 | 1.2 | 1.00 | No |
| H76f | 17 Apr 2007 | Red4 | 90.0 | 6000 | 1.16 | 2.0 | 1.91 | Yes |
| H79b | 25 Apr 2000 | GR4 | 25.1 | 1800 | 1.04 | 1.2 | 1.00 | Yes |
| H79c | 26 Apr 2000 | GR4 | 150.5 | 1800 | 1.08 | 1.2 | 1.00 | No |
| H79d | 27 Apr 2000 | GR4 | 127.3 | 1800 | 1.03 | 1.2 | 1.00 | Yes |
| H80a | 05 Mar 2004 | R300 | 90.0 | 2700 | 1.22 | 2.5 | 7.60 | Yes |
| 6-7 May 2005 | Red4 | 65.0 | 5280 | 1.17 | 2.5 | 1.68 | ||
| H80b | 16 May 2006 | B100+G100 | 87.7 | 3600+3600 | 1.15 | 1.5 | 1.06 | Yes |
| 02 Apr 2006 | GR4 | 80.0 | 4800 | 1.24 | 1.2 | 1.00 | ||
| 07 May 2005 | Red4 | 86.8 | 6000 | 1.20 | 2.5 | 1.79 | ||
| H80c | 13 May 2005 | Red4 | 71.5 | 5280 | 1.13 | 2.5 | 1.79 | Yes |
| H80d | 16 May 2006 | B100+G100 | 87.7 | 3600+3600 | 1.15 | 1.5 | 1.00 | Yes |
| 02 Apr 2006 | GR4 | 80.0 | 4800 | 1.24 | 1.2 | 1.00 | ||
| 01 May 2006 | Red4 | 90.0 | 6000 | 1.16 | 2.0 | 1.70 | ||
| H82a | 18 Mar 2005 | G100 | 98.3 | 2700 | 1.03 | 2.0 | 1.23 | No |
| 03 May 2005 | R300 | 86.0 | 2700 | 1.03 | 2.5 | 4.55 | ||
| H82b | 18 Mar 2005 | G100 | 98.3 | 2700 | 1.03 | 2.0 | 1.15 | Yes |
| 05 May 2005 | R300 | 86.0 | 2700 | 1.05 | 2.5 | 4.25 | ||
| H82c | 05 May 2005 | R300 | 90.0 | 2700 | 1.01 | 2.5 | 6.17 | Yes |
| 20 Jun 2005 | G100 | 31.0 | 2700 | 1.52 | 1.5 | 1.11 | ||
| 02 Sep 2005 | B100 | 31.0 | 3300 | 1.21 | 1.5 | 1.11 | ||
| H82d | 05 May 2005 | R300 | 90.0 | 2700 | 1.00 | 2.5 | 4.76 | No |
| 20 Jun 2005 | G100 | 129.0 | 3600 | 1.18 | 1.5 | 1.29 | ||
| H85a | 02 Sep 2003 | B100+G100 | 123.5 | 3600+2700 | 1.24 | 1.5 | 1.23 | No |
| 18 Sep 2006 | Red4 | 90.0 | 4800 | 1.27 | 2.0 | 2.09 | ||
| H85b | 02 Sep 2003 | B100+G100 | 123.5 | 3600+2700 | 1.24 | 1.5 | 1.34 | Yes |
| 20 Sep 2006 | Red4 | 90.0 | 2400 | 1.25 | 2.0 | 2.27 | ||
| H85c | 02 Sep 2003 | G100 | 138.0 | 4800 | 1.27 | 1.5 | 1.31 | No |
| 23 Sep 2006 | Red4 | 90.0 | 7200 | 1.26 | 2.0 | 2.23 | ||
| H85d | 02 Sep 2003 | G100 | 138.0 | 4800 | 1.27 | 1.5 | 1.31 | No |
| 30 Sep 2006 | Red4 | 90.0 | 7200 | 1.26 | 2.0 | 2.23 | ||
| H88a | 17 Sep 2004 | R300 | 90.0 | 2700 | 1.26 | 2.5 | 3.07 | Yes |
| H88d | 17 Sep 2004 | R300 | 90.0 | 2700 | 1.27 | 2.5 | 3.68 | Yes |
| H92b | 18 Sep 2004 | R300 | 90.0 | 2700 | 1.01 | 2.5 | 2.74 | No |
| H92d | 18 Sep 2004 | R300 | 90.0 | 2700 | 1.06 | 2.5 | 2.93 | No |
| H92e | 20 Sep 2004 | R300 | 90.0 | 2700 | 1.03 | 2.5 | 3.14 | No |
| H92N | 20 Sep 2006 | Red4 | 90.0 | 7200 | 1.01 | 2.0 | 2.25 | Yes |
| H93a | 16 Nov 2004 | B100+G100 | 103.5 | 2160+1800 | 1.09 | 1.5 | 1.04 | Yes |
| H93b | 17 Nov 2004 | B100+G100 | 155.0 | 1800+1800 | 1.06 | 1.5 | 1.03 | Yes |
| H93c | 16 Nov 2004 | B100+G100 | 103.5 | 2160+1800 | 1.09 | 1.5 | 1.04 | Yes |
| H93d | 18 Nov 2004 | B100+G100 | 171.0 | 2700+2700 | 1.06 | 2.0 | 1.04 | No |
| H93e* | 18 Nov 2004 | B100+G100 | 171.0 | 2700+2700 | 1.06 | 2.0 | 1.14 | Yes |
| H94a | 23 Sep 2004 | Red4 | 90.0 | 2700 | 1.34 | 2.0 | 2.25 | No |
| H94b | 1O Oct 2006 | Red4 | 90.0 | 3600 | 1.34 | 2.0 | 2.24 | No |
| H94c | 1O Oct 2006 | Red4 | 90.0 | 4800 | 1.13 | 2.0 | 2.27 | No |
| H94f | 08 Sep 2005 | Red4 | 90.0 | 7500 | 1.32 | 2.0 | 2.42 | No |
| H95a | 14 Nov 2004 | B100+G100 | 82.0 | 2520+2160 | 1.21 | 1.5 | 1.31 | No |
| 20 Sep 2006 | Red4 | 90.0 | 3600 | 1.39 | 2.5 | 2.22 | ||
| H95c | 13 Nov 2004 | B100+G100 | 109.0 | 2700+2700 | 1.14 | 2.0 | 1.27 | Yes |
| H95d | 23 Sep 2006 | Red4 | 90.0 | 6000 | 1.13 | 2.0 | 2.31 | Yes |
| H96b | 01 Sep 2005 | B100+G100 | 115.3 | 3600+3200 | 1.23 | 1.5 | 1.11 | No |
| H96c | 01 Sep 2005 | B100+G100 | 115.3 | 3600+3200 | 1.23 | 1.5 | 1.12 | Yes |
| H97a | 17 Sep 2004 | R300 | 90.0 | 2700 | 1.20 | 2.5 | 3.52 | No |
| 30 Sep 2006 | Red4 | 90.0 | 3600 | 1.29 | 2.0 | 1.29 | ||
| H97b | 21 Sep 2004 | R300 | 90.0 | 2700 | 1.02 | 2.5 | 3.30 | Yes |
| H97c | 21 Sep 2004 | R300 | 90.0 | 2700 | 1.22 | 2.5 | 2.44 | No |
| 01 Nov 2005 | Red4 | 90.0 | 3600 | 1.39 | 2.0 | 1.12 | ||
| H97d | 03 Nov 2005 | GR4 | 48.7 | 3200 | 1.37 | 1.0 | 1.00 | No |
| 08 Sep 2005 | Red4 | 90.0 | 3600 | 1.29 | 2.0 | 1.17 | ||
| H97e | 03 Nov 2005 | GR4 | 48.7 | 3200 | 1.37 | 1.0 | 1.00 | No |
| 02 Nov 2005 | Red4 | 90.0 | 5400 | 1.30 | 2.0 | 1.23 | ||
| H97-2 | 04 Nov 2005 | Red4 | 90.0 | 3600 | 1.33 | 2.5 | 1.26 | No |
| H98a | 01 Oct 2006 | Red4 | 90.0 | 1800 | 1.25 | 2.0 | 1.47 | No |
| H98c | 18 Sep 2006 | Red4 | 90.0 | 4800 | 1.29 | 2.0 | 1.52 | No |
| H99a | 20 Sep 2004 | R300 | 172.0 | 2700 | 1.00 | 2.5 | 4.43 | No |
| 19 Nov 2004 | B100+G100 | 172.0 | 2700+2240 | 1.03 | 1.5 | 1.12 | ||
| H99b | 20 Sep 2004 | R300 | 90.0 | 2700 | 1.01 | 2.5 | 4.20 | No |
| 07 Sep 2003 | G100 | 86.6 | 2700 | 1.09 | 1.5 | 1.14 | ||
| 30 Sep 2006 | Red4 | 90.0 | 3600 | 1.04 | 2.0 | 1.65 | ||
| H99c | 20 Sep 2004 | R300 | 90.0 | 2700 | 1.01 | 2.5 | 3.35 | Yes |
| 07 Sep 2003 | G100 | 86.6 | 2700 | 1.09 | 1.5 | 1.06 | ||
| H99d | 02 Sep 2005 | B100+G100 | 75.1 | 4800+4800 | 1.25 | 1.5 | 1.11 | No |
| H99e | 02 Sep 2005 | B100+G100 | 75.1 | 4800+4800 | 1.25 | 1.5 | 0.99 | No |
| H100a | 02 Sep 2005 | B100+G100 | 140.6 | 2700+2340 | 1.14 | 1.5 | 1.07 | Yes |
| H100b | 03 Sep 2005 | G100 | 152.6 | 2700 | 1.11 | 1.5 | 1.06 | Yes |
| 04 Nov 2005 | Red4 | 0 | 3600 | 1.10 | 2.5 | 0.98 | ||
| H100c | 02 Sep 2005 | B100+G100 | 140.6 | 2700+2340 | 1.14 | 1.5 | 1.10 | Yes |
| H100d | 18 Sep 2006 | Red4 | 90.0 | 3600 | 1.11 | 2.0 | 1.05 | Yes |
| Gal. | log | log | log | log | F(H) | L(H) | Cla |
|---|---|---|---|---|---|---|---|
| H01a | -0.0200.019 | -1.4680.045 | -0.4750.004 | -0.4700.045 | 0.46E-14 | 40.07 | SFN |
| H01c | 0.4980.103 | - | 0.0390.043 | -0.0800.065 | 0.11E-14 | 39.44 | AGN |
| H01d | - | - | 0.1330.052 | -0.3780.072 | 0.36E-15 | 38.95 | AGN |
| H03a | 0.6770.099 | -1.0090.071 | 0.1730.035 | - | 0.49E-15 | 38.80 | AGN |
| H03b | -0.1930.493 | - | -0.1410.079 | - | 0.18E-14 | 39.43 | TO |
| H03c | -0.8130.040 | -1.7040.048 | -0.4780.007 | -0.8940.048 | 0.15e-14 | 39.31 | SFN |
| H05a | 0.4950.054 | -0.4570.049 | 0.4030.009 | 0.0370.049 | 0.14E-14 | 39.69 | AGN |
| H05b | - | - | 0.4100.192 | - | 0.22E-16 | 37.91 | AGN |
| H05d | 0.0140.129 | - | -0.3110.024 | -0.3240.057 | 0.31E-15 | 39.07 | TO |
| H06b | - | - | -0.1910.054 | -0.4570.087 | 0.43E-15 | 39.13 | TO |
| H06d | - | -1.1370.055 | -0.5390.023 | - | 0.17E-15 | 38.74 | SFN |
| H07a | 0.0960.032 | -1.6050.046 | -0.2890.007 | -0.6470.046 | 0.37E-13 | 40.20 | TO |
| H07c | -0.8030.113 | - | -0.4810.006 | -0.6210.046 | 0.94E-14 | 39.65 | SFN |
| H07d | -0.2270.060 | - | -0.4440.011 | -0.4580.048 | 0.19E-14 | 38.91 | SFN |
| H10a | - | - | 0.1500.030 | -0.0390.060 | 0.29E-14 | 39.28 | AGN |
| H10c | -0.4070.091 | - | -0.3430.008 | -0.7230.047 | 0.79E-14 | 39.61 | SFN |
| H10d | - | - | -0.1940.028 | -0.6570.055 | 0.74E-15 | 38.59 | TO |
| H13a | - | - | 0.3610.043 | 0.0360.083 | 0.26E-15 | 38.99 | AGN |
| H13b | -0.4840.195 | - | -0.2130.086 | -0.0180.084 | 0.46E-15 | 39.24 | TO/AGN |
| H13c | 0.1890.191 | -1.0260.090 | -0.0240.060 | -0.3300.090 | 0.24E-15 | 38.93 | AGN |
| H23b | - | - | -0.1890.027 | -0.4130.068 | 0.51E-14 | 39.45 | TO |
| H23N | - | - | 0.0490.214 | - | 0.14E-14 | 38.84 | AGN |
| H24b | - | - | -0.0400.173 | - | 0.48E-15 | 38.99 | AGN |
| H26a∗ | - | -1.294 | -0.582 | -0.481 | 0.16E-14 | 39.52 | SFN |
| H26b | 0.4020.767 | -0.7760.140 | -0.2130.145 | - | 0.32E-15 | 38.83 | AGN |
| H26e | 0.1050.025 | -1.4300.046 | -0.7590.006 | -0.4170.046 | 0.85E-15 | 39.28 | SFN |
| H26f | 0.0750.089 | - | -0.6120.005 | - | 0.38E-15 | 38.93 | SFN |
| H26g | 0.3880.042 | - | -0.9240.017 | -1.0050.049 | 0.32E-15 | 38.83 | SFN |
| H28a | - | - | -0.1000.162 | - | 0.84E-16 | 38.42 | AGN |
| H28b | - | - | 0.1930.116 | -0.4980.133 | 0.33E-15 | 39.02 | AGN |
| H30b | - | - | 0.1090.101 | -0.7810.099 | 0.64E-15 | 38.52 | AGN |
| H30c | 0.2580.096 | -1.3520.046 | -0.2400.006 | -0.3280.046 | 0.21E-14 | 39.02 | TO/AGN |
| H31a | 0.0970.005 | -1.6450.044 | -0.6990.002 | -0.5380.044 | 0.20E-13 | 39.87 | SFN |
| H31b | 0.3600.026 | -1.3120.044 | -0.9810.004 | -0.5310.044 | 0.77E-14 | 39.50 | SFN |
| H31c | 0.2900.004 | -1.7710.046 | -0.8130.007 | -0.6200.046 | 0.81E-14 | 39.50 | SFN |
| H31G | 0.4180.031 | - | -0.8870.017 | -0.5490.049 | 0.62E-14 | 39.38 | SFN |
| H31Q | 0.0630.083 | - | -0.5340.030 | - | 0.56E-15 | 38.32 | SFN |
| H31AN | -0.0990.114 | - | -0.3860.126 | -0.3470.051 | 0.11E-14 | 38.61 | TO |
| H33a | - | - | 0.2020.078 | - | 0.87E-15 | 39.08 | AGN |
| H33c | - | - | -0.3350.004 | -0.6190.045 | 0.72E-15 | 39.03 | TO |
| H34a | -0.1350.204 | - | -0.1710.027 | - | 0.25E-14 | 39.70 | TO |
| H34b | 0.0860.074 | -1.2840.032 | -0.1570.003 | -0.4580.045 | 1.37e-15 | 39.48 | TO |
| H34c | -0.1980.019 | -1.8240.044 | -0.4780.001 | -0.5570.044 | 0.64E-14 | 40.14 | SFN |
| H37c | - | - | -0.1550.024 | - | 0.60E-15 | 38.90 | TO |
| H37e | - | - | -0.2220.019 | -1.6970.052 | 0.71E-15 | 38.85 | TO |
| H38a | -0.1300.103 | - | -0.4000.006 | -0.7240.045 | 0.20E-14 | 39.58 | SFN |
| H38b | -0.7620.107 | -1.3240.044 | -0.3170.003 | -0.9140.044 | 0.94E-14 | 40.23 | SFN |
| H38c | - | - | -0.1650.006 | -0.4960.047 | 0.14E-14 | 39.40 | TO |
| H40c∗ | - | - | -0.221 | -0.433 | - | - | TO |
| H40d | -0.2680.081 | -2.0590.052 | -0.2060.010 | -1.9970.052 | - | - | TO |
| H40e | - | - | 0.0310.076 | - | 0.10E-15 | 38.02 | AGN |
| H43a | - | - | -0.2640.010 | -0.7090.048 | 0.88E-15 | 39.34 | TO |
| H43b | -0.4600.223 | - | -0.3390.007 | -0.3320.046 | 0.16E-14 | 39.61 | SFN |
| H43d | - | - | -0.3230.009 | -0.6740.047 | 0.38E-15 | 38.93 | TO |
| H44a | - | - | 0.5640.126 | 0.0040.154 | 0.14E-13 | 38.75 | AGN |
| H44c | 0.6340.166 | -1.1260.049 | -0.1360.010 | -0.4470.049 | 0.44E-13 | 39.21 | AGN |
| H44d | 0.0370.092 | - | -0.4130.004 | -0.4300.045 | 0.78E-15 | 37.68 | TO |
| H46a | 0.6450.136 | - | 0.1950.104 | - | 0.39E-15 | 38.80 | AGN |
| H46b | 0.1280.316 | -0.9500.097 | 0.0720.058 | - | 0.66E-15 | 39.07 | AGN |
| H46c | - | - | 0.0890.249 | - | 0.23E-15 | 38.54 | AGN |
| H47a | - | - | 0.1500.049 | -0.3580.071 | 0.79E-15 | 39.24 | AGN |
| H47b | - | - | 0.0290.157 | -0.3740.128 | 0.89E-15 | 39.29 | AGN |
| H47c | -0.4370.078 | - | -0.3980.008 | -0.6260.047 | 0.19E-14 | 39.63 | SFN |
| H47d | 0.2890.083 | - | -0.3300.025 | -0.3990.055 | 0.17E-15 | 38.57 | TO |
| H48b | 0.6160.081 | -1.6640.051 | -0.1390.009 | -0.4740.051 | 0.86E-14 | 39.10 | AGN |
| H49a | 0.2320.035 | - | -0.7060.008 | -0.4980.047 | 0.38E-12 | 41.96 | SFN |
| H49b | 0.4840.014 | -1.4630.044 | -1.3290.007 | -0.6960.044 | 0.12E-11 | 42.45 | SFN |
| H49c | 0.3560.026 | - | -0.8450.006 | -0.5920.045 | 0.13E-14 | 39.49 | SFN |
| H49d | 0.4340.050 | - | -0.7990.017 | -0.4760.050 | 0.66E-15 | 39.20 | SFN |
| H51b | - | - | 0.1230.088 | - | 0.97E-15: | 39.20: | AGN |
| H51c | - | - | -0.1010.074 | -0.4370.075 | 0.10E-14 | 39.30 | TO |
| H51d | - | - | 0.2260.096 | - | 0.20E-15 | 38.45 | AGN |
| H51e | 0.2350.061 | - | 0.0570.038 | - | 0.48E-15 | 38.84 | AGN |
| H52b | - | - | 0.1930.102 | -0.3210.052 | 0.50E-15 | 39.31 | AGN |
| H52c | -0.4700.102 | - | -0.8900.011 | -0.8040.045 | 0.91E-15 | 39.55 | SFN |
| H57a | - | - | -0.0770.061 | - | 0.20E-14 | 39.59 | AGN |
| H57b | - | - | 0.3110.072 | - | 0.13E-15 | 38.39 | AGN |
| H57d | 0.1350.049 | -1.2140.050 | -0.3750.014 | -0.4250.050 | - | - | TO |
| H57e | 0.4510.116 | - | 0.1830.035 | -0.5200.064 | 0.15E-14 | 39.44 | AGN |
| H57h | 0.0480.111 | -1.2030.060 | -0.4210.028 | -0.6510.060 | 0.16E-14 | 39.52 | TO |
| H59a | 0.0000.080 | -0.9820.056 | -0.0930.019 | -0.1930.056 | 0.84E-14 | 39.54 | TO/AGN |
| H59b | - | - | -0.3560.069 | -0.3010.067 | 0.63E-15 | 38.39 | TO |
| H59c | - | - | -0.4840.008 | -0.4720.046 | 0.30E-14 | 39.15 | SFN |
| H59d | 0.2600.021 | -1.2760.046 | -0.6070.008 | -0.3400.046 | 0.11E-14 | 38.65 | SFN |
| H61a | - | - | 0.2290.132 | 0.0020.164 | 0.29E-14 | 39.01 | AGN |
| H61c | - | - | -0.1450.048 | -0.2180.074 | 0.28E-14 | 39.03 | TO |
| H64a | -0.0220.273 | - | 0.2740.087 | 0.1310.119 | 0.25E-15 | 38.84 | AGN |
| H64b | 0.3540.063 | -0.8040.053 | -0.0210.011 | -0.1120.053 | 0.14E-14 | 39.59 | AGN |
| H67c | - | -0.8630.123 | -0.6220.142 | - | 0.34E-15 | 38.66 | SFN |
| H67d | - | - | 0.4120.096 | - | 0.41E-15 | 38.69 | AGN |
| H68d | - | - | 0.9100.050 | - | 5.82E-16 | 37.91 | AGN |
| H69a | - | - | 0.3970.104 | 0.1270.113 | 0.14E-15 | 38.43 | AGN |
| H69b | 0.1490.172 | -1.2610.049 | 0.0570.008 | - | - | - | AGN |
| H75b | - | - | -0.2850.093 | - | 0.22E-14: | 39.90: | TO |
| H75c | 0.3060.079 | - | 0.0150.036 | - | 0.49E-15 | 39.26 | AGN |
| H75d | -0.3700.120 | -1.2460.047 | -0.3730.009 | -0.5300.047 | 0.12E-14 | 39.66 | SFN |
| H76b | - | - | -0.0960.078 | - | 0.33E-15 | 38.91 | AGN |
| H76f | - | - | - | - | 0.15E-15 | 38.59 | SFN |
| H79b | -0.2700.260 | - | -0.3280.022 | -0.5780.056 | 2.00E-14: | 39.98 | TO |
| H79d | 0.0380.060 | - | -0.8540.008 | -0.4710.046 | 0.24E-14 | 39.09 | SFN |
| H80a | - | - | -0.4480.013 | -0.5720.052 | 0.30E-14 | 39.77 | SFN |
| H80b | -0.0430.134 | -0.2960.055 | -0.0000.023 | - | 0.83E-15 | 39.27 | AGN |
| H80c | 0.2500.094 | - | -0.6960.011 | -0.4780.046 | 0.33E-14 | 39.86 | SFN |
| H80d | - | - | -0.6960.011 | -0.5180.046 | 0.42E-15 | 38.92 | SFN |
| H82b | -0.5300.083 | -1.3760.058 | -0.2680.035 | -0.8020.058 | 0.23E-14 | 39.78 | TO |
| H82c | 0.1860.023 | - | -0.2320.003 | -0.2490.045 | 0.17E-14 | 39.62 | TO/AGN |
| H85b | - | - | 0.0390.031 | -0.2340.058 | 0.57E-15 | 39.31 | AGN |
| H88a | 0.2950.303 | - | 0.1320.053 | - | 0.21E-14 | 39.26 | AGN |
| H88d | 0.1050.060 | -1.4250.049 | -0.5910.016 | -0.4240.049 | 0.33E-14: | 39.48: | SFN |
| H92N | - | - | 0.1040.149 | - | 0.27E-15 | 38.38 | AGN |
| H93a | 0.3750.237 | -1.0020.062 | 0.1020.035 | -0.0570.062 | 0.18E-14 | 39.05 | AGN |
| H93b | 0.6640.070 | - | -0.0950.012 | -0.3920.050 | 0.14E-14 | 38.88 | AGN |
| H93c | - | - | 0.0020.041 | - | 0.45E-15 | 38.46 | AGN |
| H95c | 0.0590.087 | -1.1590.046 | -0.0110.006 | -0.2120.046 | 0.11E-14 | 39.58 | AGN |
| H95d | - | - | - | - | 0.69E-15 | 39.41 | SFN |
| H96c | -0.2130.048 | - | -0.2630.004 | -0.5060.046 | 0.37E-14 | 39.83 | TO |
| H97b | 0.2140.211 | -1.0130.064 | -0.2100.041 | - | 0.20E-14: | 39.36: | TO/AGN |
| H99c | - | - | 0.0830.027 | - | 0.75E-15 | 39.09 | AGN |
| H100a | -0.0440.087 | - | -0.2740.008 | -0.4830.047 | 0.13E-13 | 39.97 | TO |
| H100b | -0.0310.068 | -1.1890.046 | -0.6970.006 | -0.6000.046 | 0.45E-14 | 39.48 | SFN |
| H100c | -0.0230.014 | -1.5980.045 | -0.6580.005 | -0.4030.045 | 0.66E-14 | 39.68 | SFN |
| H100d | -0.0370.011 | - | -0.6330.005 | -0.4560.045 | 0.82E-14 | 39.79 | SFN |
| Gal. | log | log | log | log | Cla | Gal. | log | log | log | log | Cla |
|---|---|---|---|---|---|---|---|---|---|---|---|
| H04a | -0.260 | -1.930 | -0.310 | -0.800 | TO | H56b | 1.450 | - | -0.040 | - | AGN |
| H04b* | - | -0.911 | -0.199 | - | TO | H56d | -0.100 | - | -0.280 | - | TO |
| H04d* | -0.566 | -1.597 | -0.359 | -0.687 | SFN | H56e | - | - | -0.480 | - | SFN |
| H16a | 0.310 | -0.800 | 0.090 | -0.280 | AGN | H62a | 0.000 | -1.100 | -0.220 | -0.320 | TO/AGN |
| H16b | 0.580 | -0.400 | 0.050 | 0.090 | AGN | H67b | -0.150 | - | -0.470 | - | SFN |
| H16c | 0.120 | -1.560 | -0.350 | -0.570 | TO | H68b | 0.140 | - | -0.190 | - | TO |
| H16d | -0.350 | -1.910 | -0.380 | -0.440 | SFN | H68c | -0.020 | - | -0.060 | - | TO |
| H21a* | - | - | -0.421 | - | SFN | H79a | 0.280 | - | -0.280 | - | TO |
| H21b* | - | - | 0.410 | - | AGN | H86a | -0.400 | -0.600 | -0.210 | - | TO/AGN |
| H22a | 0.500 | -0.900 | 0.030 | -0.280 | AGN | H86b | 0.950 | -1.100 | -0.080 | - | AGN |
| H22c | -0.500 | - | -0.340 | - | SFN | H86c | 0.170 | -0.830 | -0.150 | - | TO/AGN |
| H23a | 0.300 | -0.490 | 0.210 | - | AGN | H87a | 0.080 | -0.500 | -0.080 | - | TO/AGN |
| H23c | -0.250 | -1.780 | -0.390 | - | SFN | H87b | -0.350 | - | 0.110 | - | AGN |
| H23d | 0.470 | - | -0.090 | - | AGN | H87c | -0.380 | -0.760: | -0.360 | - | SFN |
| H37a | 0.220 | - | 0.230 | - | AGN | H88b | 0.180 | -1.110 | 0.280 | - | AGN |
| H37b | 0.100 | - | -0.190 | - | TO | H88c | -0.410 | - | -0.500 | - | SFN |
| H37d | -0.460 | - | -0.570 | - | SFN | H90a | 0.970 | -1.300 | 0.080 | -0.130 | AGN |
| H42a | - | -1.000 | 0.250 | - | AGN | H90d | 0.020 | -1.100 | -0.200 | -0.520 | TO/AGN |
| H54a | 0.510 | - | -0.900 | - | SFN | H91a* | 1.014 | -0.958 | -0.470 | - | AGN |
| H54b | 0.680 | - | -1.360 | - | SFN | H91b* | - | -1.249 | -0.194 | -0.776 | TO |
| H54c | 0.370 | - | -1.120 | - | SFN | H92c | 1.000 | - | 0.120 | -0.050 | AGN |
| H54d | 0.570 | - | -1.230 | - | SFN | H96a | 1.063 | -0.960 | -0.108 | -0.553 | AGN |
| H56a | 0.010 | - | -0.420 | - | TO | H96d | 0.154 | - | -0.523 | -0.498 | SFN |