Effects of grain shattering by turbulence on extinction curves in starburst galaxies
Abstract
Dust grains can be efficiently accelerated and shattered in warm ionized medium (WIM) because of the turbulent motion. This effect is enhanced in starburst galaxies, where gas is ionized and turbulence is sustained by massive stars. Moreover, dust production by Type II supernovae (SNe II) can be efficient in starburst galaxies. In this paper, we examine the effect of shattering in WIM on the dust grains produced by SNe II. We find that although the grains ejected from SNe II are expected to be biased to large sizes (, where is the grain radius) because of the shock destruction in supernova remnants, the shattering in WIM is efficient enough in Myr to produce small grains if the metallicity is nearly solar or more. The production of small grains by shattering steepens the extinction curve. Thus, steepening of extinction curves by shattering should always be taken into account for the system where the metallicity is solar and the starburst age is typically larger than 5 Myr. These conditions may be satisfied not only in nearby starbursts but also in high redshift () quasars.
keywords:
dust, extinction — galaxies: evolution — galaxies: starburst — H ii regions — supernovae: general — turbulence1 Introduction
Type II supernovae (SNe II) are considered to be one of the grain production sources in the Universe (e.g. Kozasa, Hasegawa, & Nomoto, 1989; Todini & Ferrara, 2001; Nozawa et al., 2003). The significance of SNe II in the grain production is enhanced if the cosmic age is so young (typically at redshift ) that low-mass stars, i.e. asymptotic giant branch (AGB) stars and Type Ia supernovae, cannot contribute significantly to the dust formation (Dwek, Galliano, & Jones 2007; but see Valiante et al. 2009), or if the current starburst is strong enough. For some nearby blue compact dwarf galaxies (BCDs), the latter condition may be satisfied (Hirashita & Hunt, 2004; Takeuchi et al., 2005). Thus, the dust production by SNe II is tested by high objects and nearby starbursts.
In galaxies where active star formation (starburst) is occurring, dust grains are not only produced and ejected from stars but also processed in the interstellar medium (ISM). In such star-forming galaxies, it is expected that the supernova (SN) rate is enhanced, which leads to an efficient destruction of large grains with , where is the grain radius, by SN shocks (e.g. Jones et al., 1994, 1996). Also a large amount of ionizing photons are supplied and H ii regions develop. Indeed giant H ii regions with sizes of pc are found in nearby galaxies (Kennicutt, 1984). Such large H ii regions can also be expected theoretically with a starburst (Hirashita & Hunt, 2004). Moreover, the size is larger than the typical expansion radius of SN shells when the dust condensed in SNe II is finally supplied to the ISM (Nozawa et al., 2007, hereafter N07). Thus, it is reasonable to consider that the dust ejected from SNe II is supplied to the ionized regions in starburst galaxies.
Hirashita & Yan (2009, hereafter HY09) show that shattering occurs efficiently in warm ionized medium (WIM), where grains are efficiently accelerated by magnetohydrodynamic (MHD) turbulence (Yan & Lazarian, 2003; Yan, Lazarian, & Draine, 2004). The same mechanism is also expected to work in the ionized regions of starburst galaxies. Indeed, turbulence is ubiquitous in the ISM, and the collective effects of OB stellar winds and supernovae (SNe) can play an important role in sustaining turbulence (e.g. Elmegreen & Scalo, 2004). Therefore, it is probable that the grains ejected from SNe II into the ionized regions are efficiently shattered by turbulence.
Since large grains with are suggested to be injected into the ISM from SNe II selectively due to the destruction in hot plasma produced by the reverse and forward shocks in supernova remnants (SNRs) (N07)111We call this destruction process ‘destruction in SNRs’., shattering in WIM is important for the production of small grains. If a significant amount of small grains are produced, optical–ultraviolet (UV) grain opacity is enhanced and the slope of the extinction curve becomes steep. In particular, the extinction curves of young starbursts are used to constrain the composition and size distribution of grains formed in SNe II (Maiolino et al., 2004b; Hirashita et al., 2005). Thus, it is important to quantify the effect of grain shattering on the extinction curve.
Also in the observational context, production of small grains in starburst environment is worth investigating. The modification of grain size distribution should have an impact on the dust extinction and emission properties (e.g. Dopita et al., 2005). By studying the spectral energy distributions (SEDs) of dust and stars of some actively star-forming dwarf galaxies, Galliano et al. (2005) show that the grain size distribution is biased to small sizes ( a few nm). The extinction curves of starburst galaxies in general show a significant reddening in the optical–UV range (Calzetti, 2001), indicating that there should be some contribution from small grains. Galliano et al. (2005) also suggest that their results are consistent with shattering and erosion of ISM grains by SN shocks (Jones et al. 1994, 1996; see also Borkowski & Dwek 1995). Both shock and turbulence are efficient drivers of the relative motion between grains, since the grain acceleration occurs in a way strongly dependent on the grain size (Shull, 1977; McKee et al., 1987; Jones et al., 1996; Yan et al., 2004).222Galactic-scale bulk motions such as collective outflow from stellar feedbacks are not efficient in producing the relative motions among grains. However, at present, it is not known which of the two drivers are more important. Thus, in this paper, as a first necessary step to fully understand the possible mechanisms of small grain production, we focus on turbulence as a possible driver of grain shattering.
2 Method
We consider a young starburst, where dust is predominantly supplied by SNe II. We then calculate the modification of grain size distribution by shattering in WIM. Finally, we examine if the shattering effect is apparent in the extinction curve or not. In this section, we first explain the initial grain size distribution in the ejection from SNe II (Sections 2.1 and 2.2). Next we review the treatment of shattering which was adopted from Jones et al. (1994, 1996) in the previous paper (Section 2.3). We use the grain velocities calculated by a MHD turbulence model to obtain the relative grain velocities in shattering (Section 2.4). We also describe the calculation method of extinction curve (Section 2.5). Throughout this paper, grains are assumed to be spherical with radius .
2.1 Initial grain size distribution
The size distribution of grains ejected from SNe II into the ISM (WIM) is adopted from N07. This size distribution is used as the initial condition for the calculation of shattering in WIM. N07 have shown that the size distribution of dust formed in the ejecta is largely modified by the destruction by sputtering in ionized gas heated by the reverse and forward shocks. Not only N07 but also Bianchi & Schneider (2007) treat the effect of shock destruction in SNe II. N07 consider some aspects which Bianchi & Schneider (2007) did not take into account: N07 solve the motion of dust grains by taking into account the gas drag and treat the destruction of dust in the radiative phase as well as in the non-radiative phase of SNRs. Thus, we adopt N07’s results for the size distribution of grains ejected from SNe II into the ISM, although qualitative behaviour of our results are common even if we adopt the size distribution of Bianchi & Schneider (2007). Also we should mention that both N07 and Bianchi & Schneider (2007) neglect the effects of dust electrical charge and the effects of magnetic fields on grain kinematics. These physical processes, which should be quantified in future work, are further discussed in Section 4.4.
Here we briefly summarize the calculation of N07. N07 started from the grain size distribution calculated by Nozawa et al. (2003), who treated dust nucleation and growth in SNe II based on the SN model of Umeda & Nomoto (2002). Then, N07 took into account the dust destruction by kinetic and thermal sputtering in hot gas swept up by the reverse and forward shocks after the interaction of the SN ejecta with the ambient ISM. Thus, the grain size distribution calculated by N07 is regarded as that ejected from SNe II to the ISM.
N07 treated two extreme cases for the mixing of elements in a SN II: one is the unmixed case in which the original onion-like structure of elements is preserved, and the other is the mixed case in which the elements are uniformly mixed within the helium core. In this paper, we adopt the unmixed case, since the extinction features of carbon and silicon, which are major grain components in the unmixed case, are consistent with observations (Hirashita et al., 2005; Kawara et al., 2010). Even if the mixed case is adopted, the grain size distribution is similarly biased to large grain sizes, so that the behaviour of the extinction curve calculated later is expected to be similar.
As a representative progenitor mass, we adopt 20 , following N07. The formed grain species are C, Si, SiO2, Fe, FeS, Al2O3, MgO, MgSiO3, and Mg2SiO4. According to their calculation, small grains with are trapped in the shocked region because the deceleration rate of a grain by the gas drag is inversely proportional to its size (e.g. Nozawa, Kozasa, & Habe, 2006). Thus, these small grains are efficiently destroyed by thermal sputtering if the ambient hydrogen number density, , is larger than 0.1 cm-3. Moreover, the destruction efficiency depends sensitively on . With as large as 10 cm-3, only a few percent of grains survive and the grain size distribution is strongly biased to large () radii. It is interesting to point out that Slavin, Jones, & Tielens (2004) derived similar grain radii for the dynamical decoupling of grains from the interstellar gas, although they include magnetic fields in their calculation (see also Section 4.4). The following results on the effects of grain shattering by turbulence in WIM are not largely affected as long as the initial size distribution is biased to large () grains.
2.2 Normalization of grain size distribution
The total grain mass density integrated for all the size range, , is normalized to the gas mass density, , to obtain the dust-to-gas ratio, , where is the mass of hydrogen atom and the factor 1.4 is the correction for the species other than hydrogen. Since dust grains are composed of metals, it is useful to label the dust abundance in terms of metallicity. We parameterize the dust abundance by the oxygen abundance, because oxygen is one of the main metals produced by SNe II and oxygen emission lines in the optical are often used to estimate the gas-phase metal abundance. The oxygen mass produced by a SN II of 20 progenitor is (Umeda & Nomoto, 2002). The dust mass after the destruction in SNRs () is listed for each ambient density in Table 1. The solar oxygen abundance is assumed to be in mass ratio (Anders & Grevesse, 1989). (The oxygen abundance is denoted as and is simply called metallicity in this paper.) Therefore, in the solar metallicity case, we assume that the dust-to-gas ratio is , which is also listed in Table 1. The dust-to-gas ratio is assumed to be proportional to the metallicity: . This is equivalent to the assumption that both dust and oxygen are predominantly supplied from SNe II.
| (cm-3) | () | |
|---|---|---|
| 0.1 | 0.35 | |
| 1 | 0.14 | |
| 10 | 0.033 |
Note. is the dust mass ejected per SN II (a progenitor mass of 20 is assumed), and is the dust-to-gas ratio at the solar metallicity (oxygen abundance) .
2.3 Shattering
Dust grains suffer shattering if the relative velocity between grains is larger than 2.7 and 1.2 km s-1 for silicate and graphite, respectively (Jones et al., 1996). As shown by Yan et al. (2004), these velocities can be achieved in magnetized and turbulent ISM. In particular, grains are efficiently accelerated in WIM, since damping is weak (Yan et al., 2004). The parameters adopted for MHD turbulence and the grain velocities obtained are described in Section 2.4. The time evolution of grain size distribution by shattering is calculated by adopting the formulation of Jones et al. (1994, 1996). We briefly review the calculation method. The details are described in HY09.
We solve the shattering equation discretized for the grain size. Although nine grain species are treated here (Section 2.1), the material properties needed for the calculation of shattering are not necessarily available for all the species. Thus, we divide the grains into two groups: one is carbonaceous dust and the other is all the other species of dust, and apply the relevant material quantities of graphite and silicate, respectively. In fact, as shown later, the mass and opacity of the latter group is dominated by Si. The validity of this approximation that all the species other than carbonaceous dust are treated as silicate (called one-species method) is examined in comparison with another extreme approximation (individual-species method) in the Appendix A. Because of the lack of the experimental data for Si, we assume that Si (and also the other ‘silicate’ species) can be treated as silicate in shattering because of similar hardness.333Among the materials whose shattering properties are available in Table 1 of Jones et al. (1996) (i.e. silicate, SiC, ice, iron, and diamond), silicate is expected to have the nearest atomic binding energy. As shown by Serra Díaz-Cano (2008), who derived the previously unknown shattering properties of hydrogenated amorphous carbon, it is not impossible to estimate relevant quantities, but some guiding quantities from other materials is still necessary even in their case. Thus, here we simply adopt the material quantities of silicate for Si. Since the cratering volume in a grain–grain collision is approximately proportional to , where is the critical shock pressure for shattering (Jones et al., 1996), the shattering time-scale is roughly proportional to . Thus, if is obtained for appropriate materials (especially Si) in some future experiment, our results can easily be scaled. The material properties of silicate and graphite are taken from Jones et al. (1996) and summarized in HY09.
The number density of grains whose radii are between and is denoted as , where the entire range of is from to . To ensure the conservation of the total mass of grains, it is numerically convenient to consider the distribution function of grain mass instead of grain size. We denote the number density of grains whose masses are between and as . The two distribution functions are related as and , where is the grain material density (3.3 and 2.2 g cm-3 for silicate and graphite, respectively).
For numerical calculation, we consider discrete bins for the grain radius. The grain radius in the -th () bin is between and , where , , and (i.e. specifies the width of a logarithmic bin: ). We represent the grain radius and mass in the -th bin with and . The boundary of the mass bin is defined as . Giving , , and , all bins can be set. A grain in the -th bin is called “grain ”. We adopt (3 Å) and to cover the entire grain size range in N07, and . We have confirmed that the results are not altered even if is doubled.
The mass density of grains contained in the -th bin, , is defined as
| (1) |
Note that in the expression of Jones et al. (1994, 1996). The time evolution of by shattering can be written as
| (5) |
where is the total mass of the shattered fragments of a grain that enter the -th bin in the collision between grains and , and are, respectively, the grain–grain collision cross section and the relative collision speed between grains and , and is the velocity threshold for shattering to occur. For the cross section, we apply .
The grain velocities given by Yan et al. (2004) are typical velocity dispersions. In order to take into account the directional information, we follow the method in Jones et al. (1994): we divide each time step into 4 small steps, and we apply , , , and in each small step, where and are the velocities of grains and , respectively (see Section 2.4). Note that the mass of the shattered fragment depends on as described in Jones et al. (1996). Briefly, the total fragment mass is determined by the shocked mass in the collision and the fragments are distributed with a grain size distribution with unless otherwise stated (see HY09 for the size range of the fragments).
For the shattering duration, several Myr may be appropriate, since it is a typical lifetime of ionizing stars with a mass (lifetime Myr) (Bressan et al., 1993; Inoue, Hirashita, & Kamaya, 2000). HY09 also indicate that the small () grains depleted by coagulation in dense clouds are recovered if shattering in WIM lasts for 3–5 Myr, which justifies the necessity of shattering in WIM for mega-years. We also examine a longer time-scale, 10 Myr, to investigate a starburst environment where an intense star formation occurs continuously. Such a situation may be realized in extragalactic giant ionized regions (Hirashita & Hunt, 2004; Hunt & Hirashita, 2009). In summary, we examine , 5, and 10 Myr, where is the elapsed time of shattering.
2.4 Grain velocity
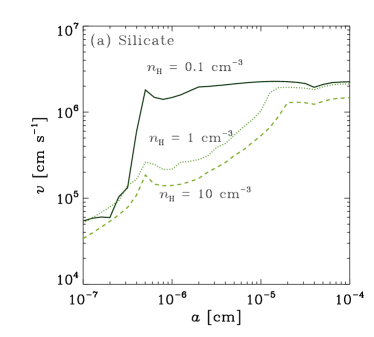
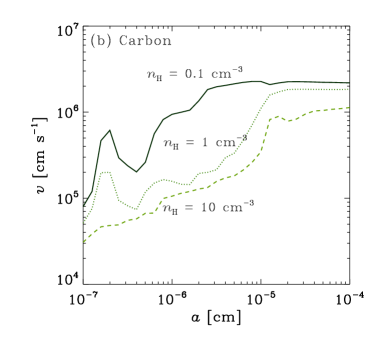
The grain velocity as a function of grain radius in the presence of interstellar MHD turbulence is calculated by the method described in Yan et al. (2004). They considered the grain acceleration by hydrodrag and gyroresonance and calculated the grain velocities achieved in various phases of ISM. Among the ISM phases, we focus on WIM to investigate the possibility of efficient shattering in actively star-forming environments.
We adopt three cases for the hydrogen number density of WIM (, 1, and 10 cm-3), since N07 applied these densities for the ambient medium. For WIM, a density of –1 cm-3 is usually considered (McKee & Ostriker, 1977), but we also examine a density as high as cm-3 for young H ii regions around massive stars as observed in starburst environments (Hunt & Hirashita, 2009). Embedded starbursts may also have such dense ionized regions. We adopt gas temperature K, electron number density , Alfvén speed km s-1 and injection scale of the turbulence pc, following Yan et al. (2004). The effect of the injection scale is minor to that of the sound and Alfvén velocities. Since both the sound speed and the Alfvén speed are fixed, the plasma is constant in all cases. The grain charge is assumed to be the same as that in Yan et al. (2004), who calculated it by assuming a typical Galactic condition. Since we expect higher interstellar radiation field and higher electron density for the starburst environments, the absolute values for the grain charge can be larger than those assumed here. For grains with , where most of the grain mass is contained in our cases, the grain velocity is governed by the gyroresonance. The acceleration rate of gyroresonance increases with the grain charge, but the acceleration duration, the gaseous drag time, decreases with the grain charge (Yan & Lazarian, 2003). As a result, the acceleration efficiency of gyroresonance is insensitive to the grain charge.
In Fig. 1, we show the grain velocities. In general, larger grains tend to acquire larger velocities because they are coupled with larger-scale motions. For small grains, the motion is governed by the gaseous drag, which has a linear dependence on the grain charge (Yan et al., 2004). This is the reason for the complex (non-monotonic) behaviour of the grain velocity as a function of for small grains (). We also observe that the grain velocity is not very sensitive to for large () grains, whose shattering is important in this paper.
2.5 Extinction curves
Extinction curves have been an effective tool to examine the dust properties (e.g. Mathis, 1990). For the calculation of extinction curves, we adopt the same optical constants as those in Hirashita et al. (2008) for the grain species formed in SNe II (C, Si, SiO2, Fe, FeS, Al2O3, MgO, MgSiO3, and Mg2SiO4). The grain properties of individual species and the references for the optical constants are listed in Table 1 of Hirashita et al. (2008). By using those optical constants, we calculate the absorption and scattering cross sections of homogeneous spherical grains with various sizes based on the Mie theory (Bohren & Huffman, 1983). Then, the grain extinction coefficient as a function of wavelength is obtained by weighting the cross sections with the grain size distribution. The total extinction as a function of wavelength , denoted as , is calculated by summing the contribution from all the species.
As stated in Section 2.3, we divide the grain species into two groups in the calculation of shattering: one is carbonaceous dust and the other is silicate, which in fact contains all the species other than carbonaceous dust. In the calculation of extinction curves, the size distribution of the silicate species is redistributed to each component (Si, SiO2, Fe, FeS, Al2O3, MgO, MgSiO3, and Mg2SiO4) in proportion to the grain volume (i.e. the total mass of each component divided by its material density) with a fixed shape of the grain size distribution. In fact, Si is dominated in the extinction curve, so that the uncertainty coming from the above rough treatment does not affect our conclusion (Appendix A).
3 RESULTS
3.1 Grain size distribution after shattering
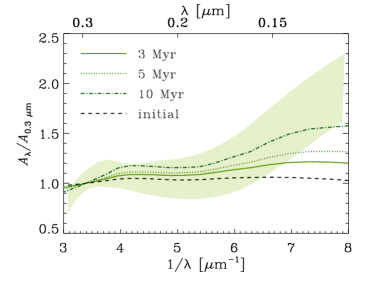
The grain size distributions after shattering are shown in Figs. 2–4 for , 1, and 10 cm-3, respectively. The grain size distribution is shown by . We adopt Myr as a typical time-scale on which WIM is sustained by the radiation from massive stars (Section 2.3). Two cases for the metallicity, and , are examined.
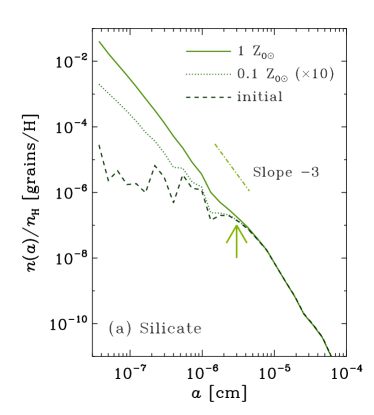
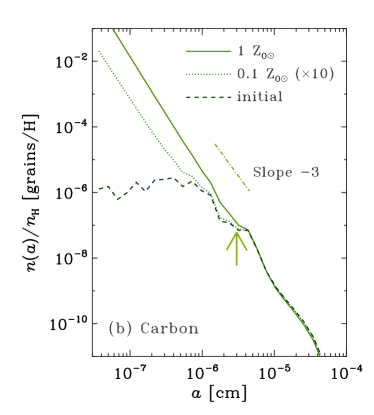
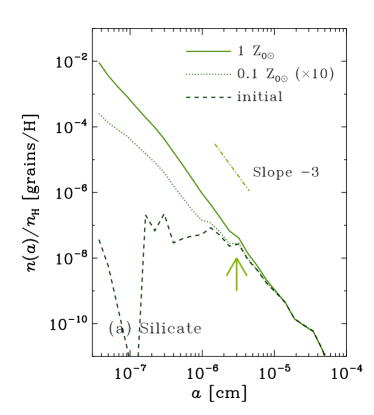
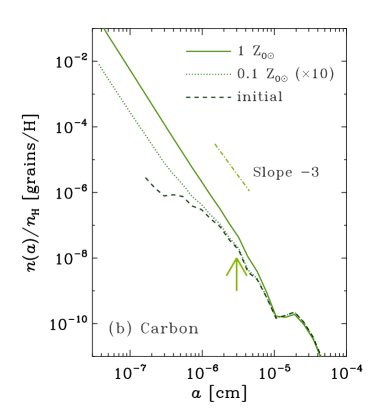
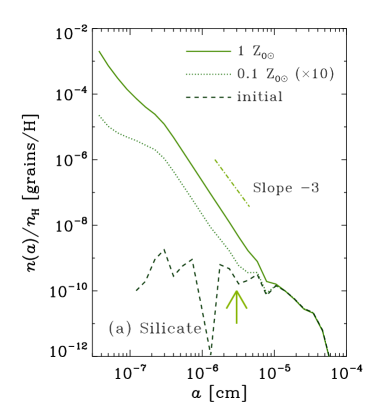
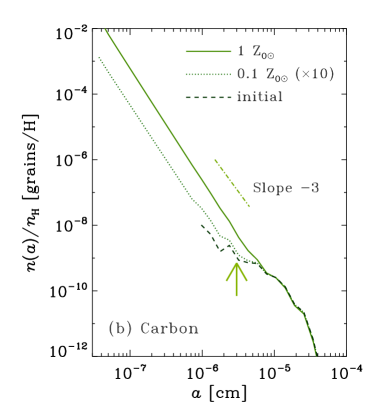
We observe that shattering really affects the grain size distribution for all the densities. In particular, the abundance of small grains with significantly increases after shattering of a small portion of larger grains. If the metallicity is 1 , a continuous power-law-like size distribution is realized for . Although the dust abundance is lower for higher (Table 1) because of more efficient shock destruction in the SN remnant before the ejection to the ISM (N07), the grain–grain collision rate is enhanced in higher environments.
The increase of grains with could efficiently affect the UV and optical extinction curves. This point is quantitatively addressed in Section 3.2. Large grains with are marginally affected by shattering; namely, shattering of a small fraction of large grains can produce a large number of small grains. In the case of HY09, on the other hand, grains with are more shattered because abundant small grains in the MRN (Mathis, Rumpl, & Nordsieck, 1977) grain size distribution, which they assumed as the initial condition, enhance the grain–grain collision rate.
3.2 Extinction curves
The extinction curve of grains ejected from SNe II tends to be flat because small grains are efficiently destroyed in SNRs without escaping into the ISM (Hirashita et al., 2008). Here we investigate if the increase of small grains by shattering effectively steepens the extinction curves or not.
In Fig. 5, we show the time variation of extinction curves for , 1, and 10 cm-3 with . We normalize the extinction to (i.e. at ). As stated by Hirashita et al. (2008), the initial extinction curve is steeper for lower , since more small grains survive after the shock destruction in SNRs. We also observe that the extinction curve becomes steeper as the grains are shattered for a longer time because of the production of small grains. Indeed, at Myr, at increases by more than 20% for cm-3. The variation of the slope by shattering is more pronounced for larger since the original extinction curve is flatter.
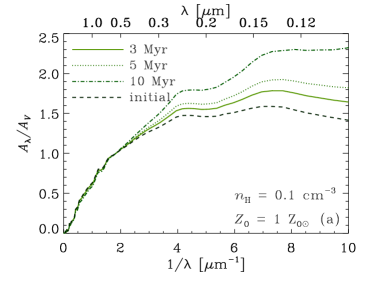
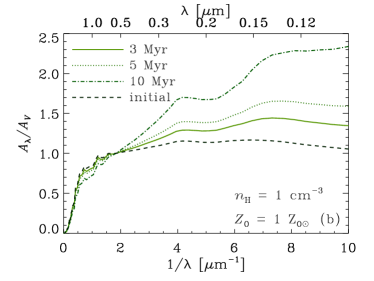
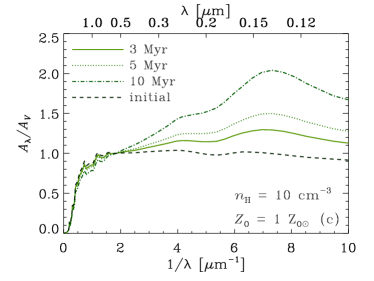
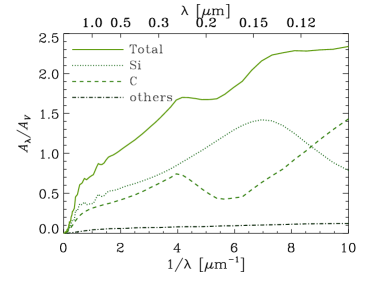
The extinction curves are dominated by Si and C, which survive after the shock destruction in SNRs because of the relatively large sizes (N07). Therefore, the steepening of extinction curve is mainly due to the production of small Si and C grains by shattering. The contributions from Si, C, and the other species are shown in Fig. 6. The ‘bump’ features at and 7 originate from the absorption by C and Si, respectively. Such features tend to be prominent for smaller grains, since as grains become larger the extinction cross sections are more determined by the geometrical ones, not by the grain properties (Bohren & Huffman, 1983). Thus, not only the steep slope but also various features in the extinction curve become apparent as grains suffer from shattering.
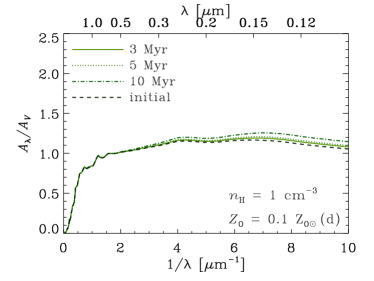
We also examine the dependence on the dust abundance (metallicity). In Fig. 5d, we show the evolution of extinction curve for . The effect of shattering is significantly reduced compared with the solar metallicity case. If the grain velocity as a function of grain size is fixed, a constant gives the same result. Thus, if is ten times lower, 10 times longer time is required for the same shattering effect to appear. The scaling with is useful if one would like to know the results for other time-scales and/or metallicities.
4 DISCUSSION
4.1 Steepening of UV extinction curve
In the above section, we have shown that the abundance of small () grains increase by shattering of large () grains. Consequently, the slope of the UV extinction curve becomes steep after shattering. Here, we discuss this issue in terms of the grain size distribution.
The contribution from grains in a logarithmic size range [, ] to the extinction can be written as , where is the extinction cross section normalized to the geometrical cross section (). If the size distribution is approximated by a power-law () over a certain size range, . Since for and for (e.g. Bohren & Huffman, 1983), we obtain for and for . Thus, if , the largest grains have the largest contribution to the extinction. In order for small grains to have significant contribution to the extinction, should be satisfied. If , the largest contribution to the extinction comes from the grains with . In other words, the UV () extinction curve is steepened significantly if grains with are produced and is satisfied around this grain size.
From Figs. 2–4, we observe that a large number of grains with are produced and the slope around this grain radius is for the solar metallicity cases. Indeed, the UV slope of extinction curve is steepened for the solar metallicity cases as shown in Fig. 5.
In this paper, the shattered fragments are distributed with a size distribution with exponent (Section 2.3). Jones et al. (1996), from a discussion on the cratering flow, argue that the value of slightly larger than 3 is robust. Even if is assumed as an extreme case, the difference in the extinction curve is less than 10% at and smaller at longer wavelengths (see the Appendix B for details).
4.2 Grain properties in starburst environments
From the results above, the presence of small grains in starburst environments is generally predicted, although SNe II tend to eject large grains because of the shock destruction in SNRs. For example, BCDs (or H ii galaxies) in the nearby Universe host large ionized region and the age of the current star formation episode is a few Myr–20 Myr (e.g. Hirashita & Hunt, 2004; Takeuchi et al., 2005). These ages are just in the range where shattering could modify the grain size distribution and extinction curve, although we should take into account the low metallicity in BCDs. Some BCDs show an excess of near-infrared emission (e.g. Hunt, Vanzi, & Thuan, 2001), which can be attributed by the emission from transiently heated very small grains (Aannestad & Kenyon, 1979; Sellgren, 1984; Draine & Anderson, 1985). Galliano et al. (2005) have carried out a comprehensive analysis of the SEDs of dust and stars in some dwarf galaxies (dwarf irregular galaxies and BCDs), and have shown that the grain size is biased to small grains with a few nm. Since their sample galaxies have metallicities larger than 1/10 Z☉, shattering in WIM can work as a production source of nm-sized grains on time-scales of a few Myr and thus can be considered as an origin of small grains in these galaxies.
It is natural to expect that a similar condition (i.e. turbulence in WIM sustained more than a few Myr) is generally realized in starburst galaxies. Although it is hard to compare the extinction curve with the observed wavelength dependence of the dust attenuation because of the effects of radiative transfer (Calzetti, 2001; Inoue, 2005), shattering may be crucial to reproduce the reddening in starburst galaxies. Therefore, shattering should be considered as a source of small grains, which contribute to the reddening. Or dust produced by AGB stars in the underlying old population (older than several yr; Valiante et al. 2009) could contribute to the steepening if they produce small grains; however, there are some observational indications that dust grains produced in AGB stars are large () (Groenewegen, 1997; Gauger et al., 1999).
Efficient shattering also occurs in the ISM by the passage of SN shocks. Jones et al. (1996) show that a large fraction of large grains with is redistributed into smaller grains by a single passage of shock with a velocity of km s-1. In their calculation, large grains take longer time before they are dynamically coupled with gas and are subject to more collisions with dust. Jones et al. (1996) consider the MRN distribution as the initial grain size distribution, which enhances the shattering efficiency compared with our case, because of the enhanced collision with the abundant small grains. Below, we estimate the time-scale on which shattering in SN shocks destroys large grains based on Jones et al. (1996), although the time-scale obtained might be an underestimate for the grains produced by SNe II, because of the enhanced collision rate in the MRN distribution.
The time-scale on which shattering in SN shocks effectively destroys large grains can basically estimated by a similar way to McKee (1989). A single SN can sweep of gas (i.e. with a shock velocity km s-1 and energy given to gas by a SN erg). Then, the gas mass swept by SN shocks with km s-1 per unit time can be estimated as , where is the SN rate. Thus, the time-scale on which the entire gas mass is affected by shattering by SN shocks is estimated as . Since for a Salpeter initial mass function (Salpeter, 1955) ( is the star formation rate), the above time-scale is estimated as . This estimate indicates that the shattering time-scale by SN shocks is about 0.01 times the gas consumption time-scale by star formation. In starburst environments, – yr may be reasonable (Young et al., 1986), and shattering in SN shocks occurs in 1–10 Myr, which is comparable to the time-scale investigated in this paper. Therefore, both shattering in turbulence and that in SN shocks can affect the grain size distribution. A detailed calculation of shattering in SN shocks of grains produced by SNe II is required before we judge which of these two shattering mechanisms is dominated.
It might be also useful to discuss our results in terms of the extinction curves of the Large and Small Magellanic Cloud (LMC and SMC), both of which have developed H ii regions such as 30 Doradus. Indeed, Bernard et al. (2008) indicate that the 70 excess around 30 Doradus can be explained by an enhancement of the abundance of very small grains possibly by the destruction of large grains. Bot et al. (2004) find this excess in the SMC. Paradis et al. (2009) show that the very small grain abundance is really enhanced around 30 Doradus by using an SED model of dust emission. However, the extinction curves in these galaxies are much steeper than our results ( and 3.2 at for the LMC and the SMC, respectively; Pei 1992). Since those galaxies have less intense star formation than BCDs, it is hard to extract the starbursting components where shattering of large grains should be working as investigated in this paper. The steep extinction curves of the LMC and the SMC indicate that we should consider not only the dust production/shattering in star-forming regions but also some other mechanisms which act as efficient production sources of small grains. For example, shattering in warm neutral medium works on a time-scale of 100 Myr (HY09). ISM phase exchange, which occurs on a time-scale of 50–100 Myr, also affects the evolution of grain size distribution (O’Donnell & Mathis, 1997). Such longer-time-scale mechanisms could also have affected the extinction curves (grain size distributions) of those galaxies. The current paper, which focuses on a short-time-scale ( Myr) grain processing, is a starting point to include other physical processes in future work.
4.3 Comparison with high- data
At , it is usually assumed that the main production source of dust is SNe II whose progenitors have short lifetimes, since the cosmic age is too young for low mass stars to evolve (but see Valiante et al., 2009). Thus, the extinction curves at such high are often used to test the theory of dust production in SNe II (Maiolino et al., 2004b; Hirashita et al., 2005). As a representative case of observed high- extinction curve, we discuss the restframe UV extinction curve of SDSS J1048+4637 () obtained by Maiolino et al. (2004b).
In Fig. 7, we show the UV part of the extinction curves calculated by our models in comparison with the observed UV extinction curve of SDSS J1048+4637. The extinction curves are normalized to the value at . We show the result for , but the following discussions hold qualitatively also for other densities. As discussed in Hirashita et al. (2008), the initial extinction curve before shattering is too flat to explain the UV rise in the observed extinction curve because small grains are selectively destroyed in SNRs. However, after shattering, the extinction curve approaches the observed curve because of the production of small grains. After 10 Myr of shattering, the observed extinction curve is reproduced. Not only the slope but also the bump feature at , which becomes prominent after shattering (Section 3.2), may account for the behaviour of the observed extinction curve around –4 .
In summary, if the metallicity is nearly solar and the age of the current episode of starburst is larger than 5 Myr, we should take the effect of shattering in turbulence into account in comparing the observed extinction curve with the theoretical one even at . Since quasars tend to be found in evolved stellar system whose metallicity could be nearly solar (or more than solar; Juaerz et al. 2009), the UV rise of the extinction curve may be caused by the production of small grains by shattering. The dependence of the extinction curve on age and metallicity may also be responsible for the variation of UV slope of the quasar spectra in the sample of Maiolino et al. (2004a).
4.4 Remarks on grain physics
Before concluding this paper, we mention some physical processes to be considered in the future. In the calculation of the shock destruction of grains in SNRs by N07, the effects of grain electrical charge and the effects of magnetic fields are ignored. As shown in Jones et al. (1994, 1996) and more recently by Guillet, Pineau Des Forêts, & Jones (2007) and Guillet, Jones, & Pineau Des Forêts (2009), the dynamics of charged grains is critically modified by magnetic fields. The gyration around the magnetic fields tend to strengthen the coupling between gas and dust, and this effect could suppress the ejection of large grains into the ISM. Thus, not only small grains but also large grains with could be subject to significant processing in the shock. Slavin et al. (2004) show that the presence of magnetic fields in shocks produce complexity in the kinematics of large () grains. Thus, it may be important to trace the grain trajectory around the reverse and forward shocks. The quantification of all these effects of magnetic fields is left for future work.
Nevertheless, the importance of shattering by turbulence for small-grain production in starburst galaxies should be an important issue even if we consider the the effect of magnetic field in the future, because it is still true that the shock destruction in SNRs suppresses the injection of small grains into the ISM. It should also be kept in mind that at the smallest size ranges (a few Å), the treatment of grains as bulk solid may not be a good approximation. Since such tiny grains do not affect the UV–optical extinction curve as discussed in Section 4.1, the results on the extinction curves are not affected. Mid-infrared spectra of dust emission are more suitable to constrain the abundance of such small grains (e.g. Mathis, 1990).
5 Conclusion
We have theoretically investigated the effect of shattering in turbulent WIM on the grain size distribution by using the framework for shattering by Jones et al. (1994, 1996) and the calculation of interstellar MHD turbulence by Yan et al. (2004). We have focused on systems in which dust is predominantly produced by SNe II. Although SNe II tend to eject large () grains because of the shock destruction in SNRs (N07), shattering in WIM supplies small grains on a time-scale of several Myr in the solar-metallicity (i.e. Galactic dust-to-gas ratio) case. Consequently, the extinction curve is steepened and the features such as the carbon bump around and the Si bump around become apparent if the metallicity is solar and the duration of shattering is longer than Myr. Therefore, when we treat a system in which the metallicity is solar and the star formation age is Myr, we should take into account the effect of shattering in interstellar turbulence. In particular, the extinction curves of high- quasars, whose metallicity is typically (above) solar, may be affected by shattering, and the UV rise of the extinction curve as well as the bump feature at –4 can be attributed to the small grains produced by shattering. If the metallicity is solar, the extinction curve does not vary significantly on a time-scale of Myr because the frequency of grain–grain collision is reduced in proportion to the grain abundance. Thus, the steepening mechanism of extinction curve discussed in this paper is valid for systems whose metallicities are significantly larger than 1/10 solar. We conclude that shattering in WIM is generally of potential importance in starburst galaxies as a production mechanism of small grains.
Acknowledgments
We thank the referee, A. P. Jones, for useful comments which improved this paper considerably. We thank T. T. Takeuchi and T. T. Ishii for helpful discussions. HY is supported by the TAP fellowship in Arizona. TN has been supported by World Premier International Research Center Initiative (WPI Initiative), MEXT, Japan, and by the Grant-in-Aid for Scientific Research of the Japan Society for the Promotion of Science (19740094, 20340038).
References
- Aannestad & Kenyon (1979) Aannestad, P. A., & Kenyon, S. J. 1979, Ap&SS, 65, 155
- Anders & Grevesse (1989) Anders, E., & Grevesse, N. 1989, Geochim. Cosmochim. Acta, 53, 197
- Bernard et al. (2008) Bernard, J.-P., et al. 2008, ApJ, 136, 919
- Bianchi & Schneider (2007) Bianchi, S., & Schneider, R. 2007, MNRAS, 378, 973
- Bressan et al. (1993) Bressan, A., Fagotto, F., Bertelli, G., & Chiosi, C. 1993, A&AS, 100, 647
- Bohren & Huffman (1983) Bohren, C. F., & Huffman, D. R. 1983, Absorption and Scattering of Light by Small Particles, Wiley, New York
- Borkowski & Dwek (1995) Borkowski, K. J., & Dwek, E. 1995, ApJ, 454, 254
- Bot et al. (2004) Bot, C., et al. 2004, A&A, 423, 567
- Calzetti (2001) Calzetti, D. 2001, PASP, 113, 1449
- Dopita et al. (2005) Dopita, M. A., et al. 2005, ApJ, 619, 755
- Draine & Anderson (1985) Draine, B. T., & Anderson, N. 1985, ApJ, 292, 494
- Dwek, Galliano, & Jones (2007) Dwek, E., Galliano, F., & Jones, A. P. 2007, ApJ, 662, 927
- Elmegreen & Scalo (2004) Elmegreen, B. G., & Scalo, J. 2004, ARA&A, 42, 211
- Galliano et al. (2005) Galliano, F., Madden, S. C., Jones, A. P., Wilson, C. D., & Bernard, J.-P. 2005, A&A, 434, 867
- Galliano et al. (2003) Galliano, F., Madden, S. C., Jones, A. P., Wilson, C. D., Bernard, J.-P., & Le Peintre, F. 2003, A&A, 407, 159
- Gauger et al. (1999) Gauger, A., Balega, Y. Y., Irrgang, P., Osterbart, R., & Weigelt, G. 1999, A&A, 346, 505
- Groenewegen (1997) Groenewegen, M. A. T. 1997, A&A, 317, 503
- Guillet, Jones, & Pineau Des Forêts (2009) Guillet, V., Jones, A. P., & Pineau des Forêts, G. 2009, A&A, 497, 145
- Guillet, Pineau Des Forêts, & Jones (2007) Guillet, V., Pineau des Forêts, G., & Jones, A. P. 2007, A&A, 476, 263
- Hirashita & Hunt (2004) Hirashita, H., & Hunt, L. K. 2004, A&A, 421, 555
- Hirashita et al. (2005) Hirashita, H., Nozawa, T., Kozasa, T., Ishii, T. T., & Takeuchi, T. T. 2005, MNRAS, 357, 1077
- Hirashita et al. (2008) Hirashita, H., Nozawa, T., Takeuchi, T. T., & Kozasa, T. 2008, MNRAS, 384, 1725
- Hirashita & Yan (2009) Hirashita, H., & Yan, H. 2009, MNRAS, 394, 1061 (HY09)
- Hunt & Hirashita (2009) Hunt, L. K., & Hirashita, H. 2009, A&A, 507, 1327
- Hunt, Vanzi, & Thuan (2001) Hunt, L. K., Vanzi, L., & Thuan, T. X. 2001, A&A, 377, 66
- Inoue (2005) Inoue, A. K. 2005, MNRAS, 359, 171
- Inoue, Hirashita, & Kamaya (2000) Inoue, A. K., Hirashita, H., & Kamaya, H. 2000, PASJ, 52, 539
- Jones et al. (1996) Jones, A. P., Tielens, A. G. G. M., & Hollenbach, D. J. 1996, ApJ, 469, 740
- Jones et al. (1994) Jones, A. P., Tielens, A. G. G. M., Hollenbach, D. J., & McKee, C. F. 1994, ApJ, 433, 797
- Juaerz et al. (2009) Juarez, Y., Maiolino, R., Mujica, R., Pedani, M., Marinoni, S., Nagao, T., Marconi, A., & Oliva, E. 2009, A&A, 494, L25
- Kawara et al. (2010) Kawara, K., Hirashita, H., Nozawa, T., Kozasa, T., Oyabu, S., Matsuoka, Y., & Shimizu, T. 2010, MNRAS, submitted
- Kennicutt (1984) Kennicutt, R. C., Jr. 1984, ApJ, 287, 116
- Kozasa, Hasegawa, & Nomoto (1989) Kozasa, T., Hasegawa, H., & Nomoto, K. 1989, ApJ, 344, 325
- Maiolino et al. (2004a) Maiolino, R., Oliva, E., Ghinassi, F., Pedani, M., Mannucci, F., Mujica, R., Juarez, Y. 2004a, A&A, 420, 889
- Maiolino et al. (2004b) Maiolino, R., Schneider, R., Oliva, E., Bianchi, S., Ferrara, A., Mannucci, F., Pedani, M., Roca Sogorb, M. 2004b, Nature, 431, 533
- Mathis (1990) Mathis, J. S. 1990, ARA&A, 28, 37
- Mathis, Rumpl, & Nordsieck (1977) Mathis, J. S., Rumpl, W., & Nordsieck, K. H. 1977, ApJ, 217, 425 (MRN)
- McKee (1989) McKee, C. F. 1989, in Allamandola L. J., Tielens, A. G. G. M., eds., IAU Symp. 135, Interstellar Dust, Kluwer, Dordrecht, p. 431
- McKee et al. (1987) McKee, C. F., Hollenbach, D. J., Seab, C. G., & Tielens, A. G. G. M. 1987, ApJ, 318, 674
- McKee & Ostriker (1977) McKee, C. F., & Ostriker, J. P. 1977, ApJ, 218, 148
- Nozawa, Kozasa, & Habe (2006) Nozawa, T., Kozasa, T., & Habe, A. 2006, ApJ, 648, 435
- Nozawa et al. (2007) Nozawa, T., Kozasa, T., Habe, A., Dwek, E., Umeda, H., Tominaga, N., Maeda, K., & Nomoto, K. 2007, ApJ, 666, 955 (N07)
- Nozawa et al. (2003) Nozawa, T., Kozasa, T., Umeda, H., Maeda, K., & Nomoto, K. 2003, ApJ, 598, 785
- O’Donnell & Mathis (1997) O’Donnell, J. E., & Mathis, J. S. 1997, ApJ, 479, 806
- Paradis et al. (2009) Paradis, D., et al. 2009, AJ, 138, 196
- Pei (1992) Pei, Y. C. 1992, ApJ, 395, 130
- Salpeter (1955) Salpeter, E. E. 1955, ApJ,
- Sellgren (1984) Sellgren, K. 1984, ApJ, 277, 623
- Serra Díaz-Cano (2008) Serra Díaz-Cano, L., & Jones, A. P. 2008, A&A, 492, 127
- Shull (1977) Shull, J. M. 1977, ApJ, 215, 805
- Slavin et al. (2004) Slavin, J. D., Jones, A. P., & Tielens, A. G. G. M. 2004, ApJ, 614, 796
- Takeuchi et al. (2005) Takeuchi, T. T., Ishii, T. T., Nozawa, T., Kozasa, T., & Hirashita, H. 2005, MNRAS, 362, 592
- Todini & Ferrara (2001) Todini, P. & Ferrara, A. 2001, MNRAS, 325, 726
- Umeda & Nomoto (2002) Umeda, H., & Nomoto, K. 2002, ApJ, 565, 385
- Valiante et al. (2009) Valiante, R., Schneider, R., Bianchi, S., Andersen, A. C. 2009, MNRAS, 397, 1661
- Yan & Lazarian (2003) Yan, H., Lazarian, A., 2003, ApJ, 592, L33
- Yan et al. (2004) Yan, H., Lazarian, A., & Draine, B. T. 2004, ApJ, 616, 895
- Young et al. (1986) Young, J. S., Schloerb, F. P., Kenney, J. D., & Lord, S. D. 1986, ApJ, 304, 443
Appendix A Test for the ‘one-species’ method
As stated in Section 2.3, all the grain species other than carbonaceous grains are treated as a single species, called formally ‘silicate’ in calculating the grain size distribution. This approximation is called ‘one-species’ method, and it is exact if all the grain species have the same shape of grain size distribution. We expect that the one-species method gives a reasonable answer since Si is dominated among the ‘silicate’ category. Although the ‘silicate’ species other than Si (we call these species non-Si grains) have minor contributions in grain mass, some of them have a significant contribution to the number of small-sized grains, which affect the UV slope of the extinction curve. Here we test the validity of the one-species method in comparison with the ‘individual-species method’ as explained below.
The ‘individual-species’ method adopts the grain size distribution of individual species and the evolution of grain size distribution is separately calculated for individual species (note that the grain size distribution summed over all the species other than carbonaceous grains is adopted for ‘silicate’ in the one-species method). In calculating the evolution of grain size distribution of a certain species, the total mass density of the species relative to the gas density is assumed to be the total dust-to-gas ratio (but the grain size distribution after shattering is normalized again to recover the correct mass ratio of each species). This treatment maximizes the production of small grains for non-Si species, which have smaller sizes than Si, but minimizes the production of small Si grains. Thus, this method is suitable to examine the maximum possible contribution from non-Si small grains to the UV extinction curve.
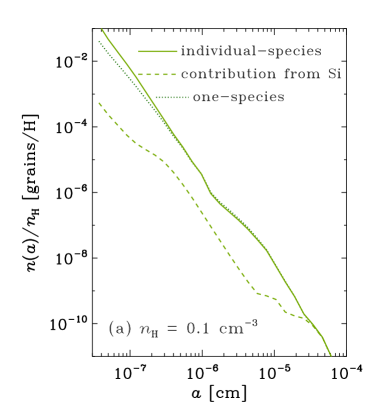
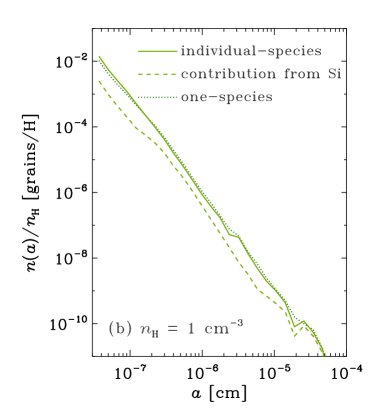
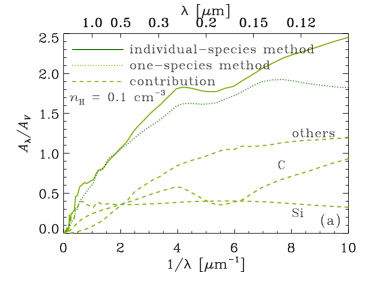
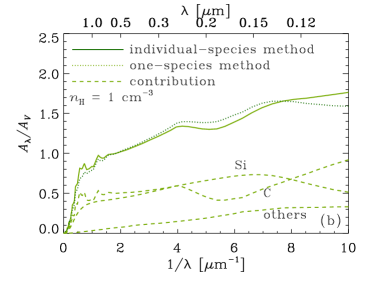
In Fig. 8, we compare the grain size distributions predicted by the one-species and individual-species methods for and 1 cm-3 at 5 Myr. For cm-3, the difference between the two methods is negligible because non-Si grains contribute little to the total grain abundance. From the figure, we observe that the difference is relatively large in the case of cm-3. This is because the fraction of non-Si grains is larger for cm-3 than for cm-3.
In Fig. 9, we show the extinction curves calculated by the two methods. We observe that the extinction curves of the individual-species method tend to be steeper than those of the one-species method. As can be seen in the figure, the steeper slope comes from the contribution from the non-Si grains indicated by ‘others’. In the individual-species method, the size distribution of each non-Si species, which has a larger fraction of small grains than that of Si, is calculated separately, so that the production of small non-Si grains is enhanced. We note that the ‘real’ grain size distribution would lie between the results of the two methods. This means the approximate treatment adopted in the text (i.e. one-species method) is justified for cm-3. For cm-3, because the contribution from non-Si species is significant, the error of the one-species method is at most % at , and % at . In order to overcome this uncertainty, we should develop a different scheme that could treat the collisions between multiple species (in our case, 9 species), which the current scheme cannot treat in a reasonable computational time.
Appendix B Fragment size distribution with a shallower slope
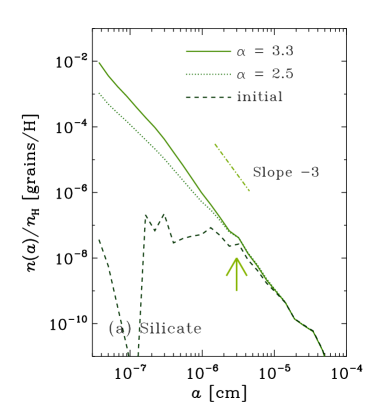
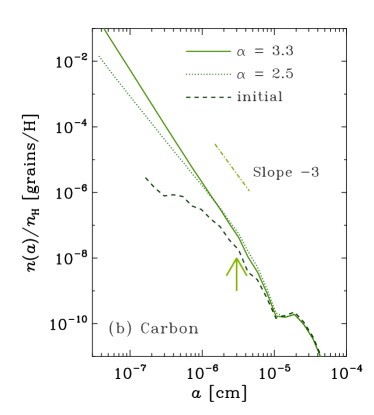
The size distribution of shattered fragments is assumed to be a power law with an exponent of . As we discuss in the text, the steepening of extinction curve becomes prominent if the power-law exponent () of the grain size distribution around is steeper than (Section 4.1). Jones et al. (1996) have shown that the size distribution after shattering is not sensitive to . They also argue that slightly larger than 3 is robust against the change of the cratering flow parameters in shattering ( is adopted in the text). Nevertheless it would be interesting to examine if is realized even if we assume .
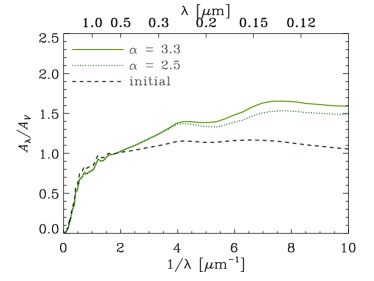
Here we examine the smallest exponent adopted in Jones et al. (1996), as an extreme case. The ambient hydrogen number density is fixed to . In Fig. 10, we show the result at Myr. As expected, the effect of is more prominent for smaller grains, since shattering with large can supply small grains more efficiently. However, we observe that the difference between and 3.3 is small around , confirming the result of Jones et al. (1996). The small difference comes from the fixed shattered mass in a collision; that is, the distribution of grain fragments as a function of size has a minor effect compared with the total mass of shattered fragments (shattering efficiency).
The extinction curves are shown in Fig. 11. We observe that the difference between the two curves with and 3.3 is negligibly small at and is less than 10% even at . The small difference is the natural consequence of the small variation of grain size distribution at .