Investigating the complex X-ray spectrum of a broad-line 2MASS red quasar:
XMM-Newton observation of FTM 08303759
Abstract
We report results from a 50 ks XMM–Newton observation of the dust-reddened broad-line quasar FTM 08303759 ( = 0.413) selected from the FIRST/2MASS Red Quasar survey. For this AGN, a very short 9 ks Chandra exposure had suggested a feature-rich X-ray spectrum and HST images revealed a very disturbed host galaxy morphology. Contrary to classical, optically-selected quasars, the X-ray properties of red (i.e. with 1.7 and 4.0) broad line quasars are still quite unexplored, although there is a growing consensus that, due to moderate obscuration, these objects can offer a unique view of spectral components typically swamped by the AGN light in normal, blue quasars. The XMM–Newton observation discussed here has definitely confirmed the complexity of the X-ray spectrum revealing the presence of a cold (or mildly-ionized) absorber with NH 1022 cm-2 along the line of sight to the nucleus and a Compton reflection component accompanied by an intense Fe K emission line in this quasar with a 5 1044 erg s-1. A soft-excess component is also required by the data. The match between the column density derived by our spectral analysis and that expected on the basis of reddening due to the dust suggests the possibility that both absorptions occur in the same medium. FTM 08303759 is characterized by an extinction/absorption-corrected X-ray-to-optical flux ratio = 2.3, that is steeper than expected on the basis of its UV luminosity. These findings indicate that the X-ray properties of FTM 08303759 differs from those typically observed for optically-selected broad line quasars with comparable hard X-ray luminosity.
1 Introduction
Selection criteria using near-infrared and mid-infrared photometry or combination of infrared (IR) and multiwavelength data have demonstrated the striking existence of a conspicuous population of obscured active galactic nuclei (AGNs) that has remained unknown until fairly recently, being difficult to detect with traditional selection criteria in the optical band (e.g., Lacy et al., 2004, 2007; Leipski et al., 2005; Webster et al., 1995; Fiore et al., 2008; Donley et al., 2008; Lanzuisi et al., 2009). On the one hand, dust extinction hampers a complete census of the active SMBHs in the Universe in case of optical/UV surveys, on the other hand, the AGN light is absorbed by the obscuring medium and then re-emitted at near- and mid-IR wavelengths.
Using the Two Micron All Sky Survey (2MASS) (e.g., Skrutskie et al., 2006, and references therein), Cutri et al. (2002) have recently unveiled a population of highly-reddened ( 2) quasars at an average redshift of 0.22 whose number density is almost comparable to that of the optically-selected quasars, selected on the basis of the UV-blue color excess criterion (e.g., Risaliti & Elvis, 2004; Hall et al., 2006). Most of these 2MASS sources are previously unidentified quasars (Francis et al., 2004; Glikman et al., 2004; Leipski et al., 2005; Urrutia et al., 2009). Optical follow-up observations have revealed that the bulk of this extragalactic population is composed by broad-line AGNs with a significant number of intermediate type objects (i.e. Type 1.2–1.9). In particular, it has been found that: (i) their median spectral energy distribution (SED) is redder in the optical/UV band than that of the best-studied, classical blue quasars (e.g. Elvis et al., 1994), (ii) they are primarily reddened by dust (AV 1–5 mag) rather than being intrinsically red sources, (iii) these objects usually exhibit a high optical polarization level ( 3–15%) suggesting that the polarization is due to scattering of nuclear light by material located close to the active nucleus, but exterior to the BLR (Kuraszkiewicz et al., 2009a; Smith et al., 2003). Such an aspect is very intriguing since 20% of 2MASS AGNs exhibit the same broad emission lines both in the polarized flux and in the total flux spectrum. This indicates that a sizable fraction of the observed optical AGN emission must have scattered into our direction and, in turn, suggests caution in the use of spectral type (Type 1 versus Type 2) as indicator of orientation in AGNs (Schmidt et al., 2007).
The observed properties of red quasars can be interpreted in terms of intermediate viewing angles where the AGN is viewed through the edge (or atmosphere) of the torus or a clumpy accretion disk wind. Accordingly, the observed broad-band emission is the likely combination of direct, reprocessed and scattered emission components (e.g., Smith et al., 2003; Wilkes et al., 2008). In addition, as pointed out by Kuraszkiewicz et al. (2009a), both obscuration and emission from the circumnuclear gas and the host galaxy play a crucial role in shaping the SED of red 2MASS quasars. It is also worth noting that a small (10–15%) percentage of classical, blue quasars is unavoidably collected, especially at 0.4, by the 2 selection criterion (Barkhouse & Hall, 2001). Also in Kuraszkiewicz et al. (2009a), it is shown that some unreddened (i.e. AV = 0–1 mag) Type 1 sources with high Eddington ratios () and large amounts of hot circumnuclear dust are picked up within their sample of red 2MASS quasars. However, since the color selection is inhomogeneous with redshift, at higher redshifts less contamination from blue AGNs will occur (as color resembles more a rest frame optical color) and the red selection will mostly gather AGNs that are truly dust-reddened.
More sophisticated selection processes involving multiwavelength (i.e. radio, optical, infrared) data have recently allowed to reveal red quasars (i.e. with 1.7 and 4.0) up to 1, such as in the case of the VLA FIRST-2MASS (FTM hereafter) survey published by Glikman et al. (2007). They estimate that red quasars account for between 25% and 60% of the total quasar population with 14 mag.
The nature and the evolutionary properties of red quasars are still open issues. It is worth noting that the classical, non-red AGN population, i.e. with a 2MASS color 2, indeed comprises a mixed bag of objects spanning from unobscured blue quasars to Seyfert 2-like AGNs showing only narrow lines in their optical spectra and absorbed (even with Compton-thick, i.e. NH 1024 cm-2, column densities) at X-rays (e.g. Watanabe et al., 2004; Alonso-Herrero et al., 1998; Gorjian et al., 2004; Zakamska et al., 2004). In particular, what is the place of red broad-line quasars in the AGN unification scheme and their role in the context of AGN and galaxy co-evolution? Are they standard systems observed along a special line of sight for which both nuclear and host galaxy obscuration are important (Kuraszkiewicz et al., 2009a), i.e. alternative to that of two classical populations of unobscured broad-lined quasars and that of heavily obscured, narrow-lined quasars? Alternatively, can they (especially if they are at 0.4–0.5) be interpreted as a peculiar dust-cocooned stage in the life cycle of quasars, possibly associated with the assembly of the host galaxy?
Intriguingly, HST images available for a sample of dust-reddened FTM quasars with 23 and 0.4 1 show disturbed optical morphologies in the vast majority (85%) of them with evidence of ongoing merging, interactions and multiple nuclei (Urrutia et al., 2008; Hutchings et al., 2006), unlike blue quasars being mostly hosted in undisturbed elliptical or bulge-dominated galaxies as found in HST imaging studies of optically-selected luminous quasars at 1 (e.g., Dunlop et al., 2003; Floyd et al., 2004; Sanchez et al., 2004, see also Bennert et al. 2008).
Evidence is mounting that distant red quasars might indeed represent a dust-enshrouded phase in quasar evolution linked with the host galaxy assembly via repeated mergers (Georgakakis et al., 2009; Urrutia et al., 2009). This phase should be characterized by the presence of massive nuclear winds expelling/heating most of the cold gas reservoir and merger debris in the host galaxy, and so rendering progressively visible the quasar as an optically-bright source (the so-called feedback processes, e.g. Silk & Rees (1998); Hopkins et al. (2006)).
A deep exploration of the X-ray spectral properties of red quasars is therefore important to improve our understanding of the structure of AGNs and their cosmological evolution. The combination of a favorable line of sight inclination and obscuration can indeed provide a unique view of spectral components usually overwhelmed by the AGN light in blue quasars (Schmidt et al., 2007; Pounds et al., 2005). The X-ray spectral properties of unobscured, optically-selected, radio-quiet quasars have been largely investigated in the past (Laor et al., 1997; George et al., 2000; Piconcelli et al., 2005), especially in case of medium-luminosity objects showing an X-ray luminosity of LX 5 1044 erg s-1. They appear to be quite homogeneous and without any evidence for significant evolution with (Just et al., 2007; Page et al., 2005; Piconcelli et al., 2003; Vignali et al., 2003a), although the strength of spectral features due to the reprocessing of the primary continuum (such as Fe K emission line and Compton hump) is still largely unconstrained for high luminosity quasars with LX 1045 erg s-1 (Mineo et al., 2000; Page et al., 2005; Jimenez-Bailon et al., 2005).
On the contrary, the X-ray properties of red luminous quasars still remain poorly explored. After their discovery, a handful of programs aimed at studying the X-ray properties of these AGNs have been undertaken. Chandra (Wilkes et al., 2002; Hall et al., 2006; Urrutia et al., 2005, hereafter U05) and XMM–Newton shallow observations (Wilkes et al., 2005; Pounds et al., 2005) of 20-30 2MASS quasars indicate the quasi-ubiquitous presence of cold absorption with 1021NH1023 cm-2 regardless of optical type. This matches with the finding that only 10% of the red 2MASS AGNs are detected in the ROSAT Faint Source Survey (Cutri et al., 2002).
Bearing in mind the small sample size to date, broad-line red quasars seem to show a wide range of spectral types in the X-ray band unlike their blue counterparts. In particular, two results from X-ray spectroscopy of red quasars can be considered of special interest: (i) a number of these sources have an unusually flat hard X-ray continuum with 1.5 (e.g. Vignali et al., 2000; Wilkes et al., 2005; Pounds & Wilkes, 2007; Wilkes et al., 2008), probably due to the presence of an intense Compton reflection component, and (ii) some broad-line red AGNs exhibit a ”soft-excess” component below 1-2 keV that can be interpreted as the result of absorption and re-emission from the same weakly ionized (outflowing) gas (Pounds et al., 2005; Pounds & Wilkes, 2007).
In this paper, we present the first high-quality X–ray spectrum, obtained with XMM–Newton, of the luminous red quasar FTM 08303759 at =0.413. A very short 9 ks Chandra observation revealed a very steep continuum and the possible presence of puzzling emission/absorption line-like features at energies which do not correspond to any obvious rest-frame atomic transition (U05). We assume throughout this paper = 70 km s-1 Mpc-1, = 0.73 and = 0.27 (Spergel et al., 2007).
| R.A. | Dec. | Flux 1.4 GHza | M | |||
|---|---|---|---|---|---|---|
| () | () | (mJy) | (mag) | (mag) | (mag) | |
| 08 30 11.12 | 37 59 51.8 | 0.413 | 6.4 | 2.28 | 1.290.12 | 23.07 |
Note. — All magnitudes are in the Vega system.
2 Optical and Radio Properties of FTM 08303759
FTM 08303759 ( = 2.28, e.g. Glikman et al., 2007) is the X-ray brightest object included in the U05 sample of 12 broad-line, dust-reddened quasars selected from the FTM survey. The objects in this sample need to satisfy three main criteria: being a FIRST radio source; belonging to the 2MASS point-source catalog and having a 4.4 (we refer to U05 for further details on the optical/near-IR selection process). All these luminous red quasars lie in the redshift range 0.42.7, exhibit broad lines in their optical spectra and they are radio-quiet or radio-intermediate, i.e. with a ratio of radio to optical emission RL=100. The value of RL derived for FTM 08303759 is 30, and the steep radio spectral index ( = 1.06) derived by Glikman et al. (2007) also supports the moderate radio-loud nature of this quasar.
FTM 08303759 is also included in the HST study of a sample of 13 dust-reddened FTM quasars performed by Urrutia et al. (2008). HST ACS Wide Field Camera images reveal that the host galaxy of FTM 08303759 shows a lot of irregularities near the nucleus along the major axis. A prominent structure with a ionization cone morphology is present: it can be interpreted as due to merger-induced star formation regions or to the presence of outflowing gas. After an accurate PSF fitting and host galaxy subtraction, Urrutia et al. (2008) measured a MB = 23.07 mag and a reddening of = 1.29 for the quasar in FTM 08303759. The inferred value of the nucleus to host ratio for the magnitude (F814W filter) was 0.55. Interestingly, Urrutia et al. (2008) also found a possible correlation between the magnitude of galaxy interactions and the level of obscuration affecting the quasar. This led them to provide a possible explanation of the red nature of FTM quasars in terms of reddening occurring in the host galaxy.
Finally, there is no detailed information on the optical classification of FTM 08303759 in the literature besides it is a broad-line AGN. However, the optical spectrum reported in Fig. 1 of Urrutia et al. (2008) suggests that an intermediate (i.e. Type 1.5) classification for this source may be considered plausible, although a proper investigation on this issue is required.
3 XMM-Newton Observation and Data Reduction
We observed the quasar FTM 08303759 with XMM–Newton (Jansen et al., 2001) on November 8, 2008 for about 52 ks (Obs. ID.: 0554540201). The observation was performed with the EPIC PN and MOS cameras operating in Full-Window mode and with the THIN filter applied. Data were reduced with SAS v8.0.0 using standard procedures and the most updated calibration files available at the date of the analysis (April 2009) were used. X-ray events corresponding to patterns 0–4(0–12) for the PN(MOS) cameras were selected. The event lists were filtered to ignore periods of high background flaring according to the method presented in Piconcelli et al. (2004) based on the cumulative distribution function of background lightcurve count-rates. After screening the final net exposure times were 41 and 48 ks for PN and MOS, respectively.
The source photons were extracted for the PN(MOS) camera from a circular region with a radius of 29(30) arcsec centered at the peak of the emission, while the background counts were estimated from a 52(49) arcsec radius source-free region on the same chip and close to FTM 08303759 without being contaminated by the target itself.
The redistribution matrix files and ancillary response files were created using the SAS task RMFGEN and ARFGEN, respectively. As the difference between the MOS1 and the MOS2 response matrices is a few percent, we created a combined MOS spectrum and response matrix. The background-subtracted spectra for the PN and the combined MOS cameras were then simultaneously fitted. Spectra were rebinned so that each energy bin contains at least 20 counts to allow us to use the minimization technique in spectral fitting.
During the XMM–Newton observation the flux of FTM 08303759 remained steady, with no variation exceeding 2 from the average count-rate level in both soft- and hard-X-ray band. Since no significant spectral changes occurred, the spectral analysis was performed on the spectrum integrated over the full exposure time.
4 Spectral Analysis
In this Section we present the spectral analysis of the EPIC observation of FTM 08303759 that was carried out using the XSPEC v11.3 software package (Arnaud, 1996). The Galactic column density of N = 3.61 1020 cm-2 derived from Kalberla et al. (2005) was adopted in all the fits. In the following, errors correspond to the 90% confidence level for one interesting parameter, i.e. = 2.71 (Avni, 1976).
4.1 Preliminary Fits
As a first step we fitted the hard portion of the EPIC spectra at 2.5 keV (corresponding to 3.5 keV in the source frame) with a power law to achieve a preliminary description of the X-ray primary continuum emission in an energy range expected to be much less affected by absorption than soft X-rays. The emission line, observed at 4.5 keV (6.4 keV in the quasar frame), was modelled with a narrow Gaussian line with energy and normalization free to vary (see Sect. 4.3 for more details). This model is a good fit to the EPIC data, i.e. /dof = 1.02/174. We measured a = 1.370.08 that is significantly flatter than the average hard X-ray slope 1.85 found for optically-selected quasars (Piconcelli et al., 2005). Fig. 1 (left panel) shows the result of this simple fit extrapolated to 0.3 keV. The broad and deep deficit in the soft X-ray band clearly suggests the presence of strong absorption. Fitting the data over the 0.3-9 keV band with an unrealistic power-law model yielded a 0.72.
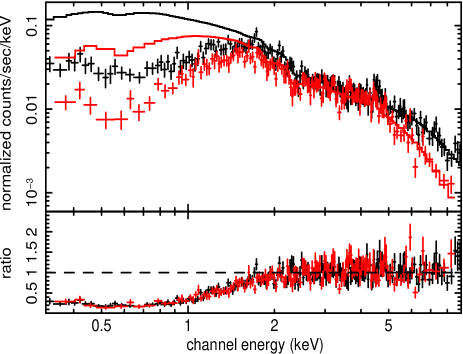

To reproduce the shape of the soft X-ray spectrum we initially applied a model consisting of a power law modified by intrinsic, rest-frame cold matter absorption. This fit was statistically unacceptable with /dof = 1.95/324, revealing additional spectral complexity. In particular, an excess in the data/model residuals emerges at energies below 0.6 keV (e.g. Fig. 1, right panel).
To further explore the nature of the obscuring material along our line of sight we modeled the low-energy drop by replacing the neutral absorber with a photoionized absorber component. The latter was modeled in XSPEC adopting the publicly available output table “grid 18”111See http://heasarc.gsfc.nasa.gov/docs/software/xstar/xstar.html for further details of the XSTAR code (Kallman & Bautista, 2001). In this model the state of the warm absorber is a function of the ionization parameter defined as = /, where is the isotropic luminosity of the power-law ionizing source in the interval 13.6 eV to 13.6 keV, is the density of the plasma and represents the radial distance from the central source. In the fit solar elemental abundances were assumed and was left as a free parameter. However, this fit, with /dof=1.05/323, was not entirely effective in reproducing the EPIC data as broad positive residuals were still present between 0.5 and 0.7 keV.
4.2 Complex models
In order to account for the soft-excess component, we then included an additional unabsorbed power-law fixing its photon index to that of the absorbed power law but with a different normalization. Such a parametrization typically provides an excellent description of the X-ray spectrum of many well-studied Compton-thin AGNs, in which the soft-excess is due to a combination of emission from scattered continuum photons and distant photoionized gas (e.g. Turner et al., 1997; Winter et al., 2009; De Rosa et al., 2008). This fit resulted in a /dof = 0.99/323 yielding a dramatic improvement in fit quality over the simple absorbed power-law model at the 99.99% confidence in an test. We measured a photon index of = 1.510.06 and a column density of NH = (1.860.16) 1022 cm-2 of the neutral absorber, while the ratio between the normalization of the unabsorbed and absorbed PL is = 0.130.02. Table 2 lists the best-fit values of the relevant spectral parameters obtained by this fit, hereafter referred as NP model.
A warm absorber model (WP) was then tested, using again the “grid 18” XSTAR table. This fit yielded /dof = 0.97/322 with an improvement at 95.6% confidence level according to an test once compared with the NP model. We derived the following best-fit values for the physical parameters of the warm gas: a column density of NH 2.4 1022 cm-2 and an ionization parameter of 15 erg cm s-1.
We note that leaving the photon index of the unabsorbed power law free
to vary in both NP and WP models gave values that are consistent with
the photon index of the continuum and did not produce any appreciable
improvement in the quality of the fits.
It is worth noting that a fitting model with an absorber completely covering the nucleus plus an extra-continuum X-ray emission component (like both NP and WP model) is numerically equivalent to a model with a partially-covering absorber. In the partial covering scenario the soft X-ray emission is alternatively interpreted as a portion of primary radiation leaking through the absorber with a covering fraction equal to = (1 ); see Table 2. Instead, in case of fully-covering absorber, the soft excess is explained in terms of emission due to reprocessing of the nuclear continuum by surrounding material. This reprocessed component may be electron-scattered emission by highly ionized matter extending above the “hole” of the torus or Compton reflected by cold material, and/or it may arise from large-scale (0.1-1 kpc; see Bianchi et al. (2006, 2007a)) photoionized gas as pointed out in most of high-resolution soft X-ray spectra of heavily-obscured Type 2 AGNs which are dominated by a wealth of strong emission lines from hydrogen- and helium-like ions of the most abundant metals, from carbon to sulfur (Guainazzi & Bianchi, 2007; Kinkhabwala et al., 2002).
Unfortunately, the combination of EPIC resolution, intermediate
column density of the X-ray absorber and moderate soft X-ray flux of
FTM 08303759 heavily hampers the detection of these emission lines in the
XMM–Newton spectrum presented here. This implies that we were not able to
discriminate between the two proposed scenarios for the soft-excess
emission and, in turn, provide unambiguous constraints on the covering
fraction of the absorber in FTM 08303759. This aspect should be borne in mind
while interpreting all the results from the spectral analysis
presented hereafter.
Furthermore, we cannot use the high resolution RGS data to shed light on this issue since
FTM 08303759 is too faint at soft X-rays to be detected by the RGS with
sufficient signal to allow a useful spectral analysis.
| Model | Model Name | Model Parameters | /d.o.f. |
|---|---|---|---|
| APL (neutral absorber) | NP | NH= () ; = 0.13 0.02 | 321/323 |
| PL | = | ||
| APL (warm absorber) | WP | NH = () ; = 0.10 0.04 | 313/322 |
| PL | log() = 1.200.11 erg cm s-1; = 1.480.05 | ||
| NP + Compton | refl-NP | NH = () ; = 0.110.01 | 312/323 |
| Reflection (neutral) | = 1.670.06 | ||
| (Magdziarz & Zdziarski, 1995) | = 1 | ||
| WP + Compton | refl-WP | NH = (); = 0.090.03 | 307/322 |
| Reflection (neutral) | log() = erg cm s-1; = | ||
| (Magdziarz & Zdziarski, 1995) | = 1 | ||
| Ionized absorber/emitter + PL + | refl-wabs | NH = (); = 0.07 0.02 | 309/321 |
| Compton Reflection (neutral) | log() = erg cm s-1; = | ||
| (Magdziarz & Zdziarski, 1995) | 3; = 1 | ||
| refl-NP + thermal | th-NP | NH = (); = 0.11 0.01 | 303/321 |
| emission (Kaastra et al., 1996) | = ; = 1 | ||
| kTaaData from Urrutia et al. (2005). 0.13 keV |
Note. — APL: absorbed power law. PL: unabsorbed power law.
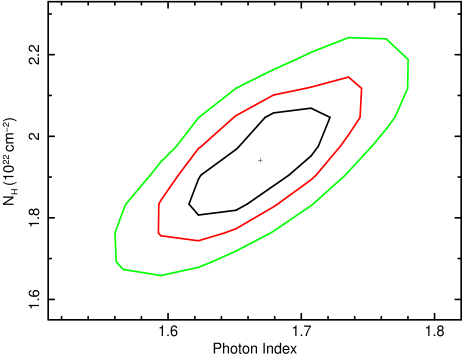
Given the flatness of continuum slope measured with the NP and WP models, i.e. 1.5, we attempted to explain it as the result of a combination of an underlying steep continuum modified by a cold/warm absorber plus a Compton reflection component from neutral matter (pexrav model in XSPEC, Magdziarz & Zdziarski (1995)), with the metal abundances of the reflector fixed to the solar value and its inclination angle fixed to 65 deg. The addition of this spectral component produced a steeping of the photon index to 1.85-1.9. However the measured value of the reflection fraction 3 (defined as /2, where is the solid angle subtended by the reflector for isotropic incident emission) is largely unconstrained and implies an unphysical covering factor of neutral reflecting material of 1 and/or anisotropy in the irradiation. Such a value is well outside the range typically observed for radio-quiet broad-line AGNs, i.e. 0.6 1.2 (Perola et al., 2002; Deluit & Courvoisier, 2003; Nandra et al., 2007; Panessa et al., 2008). A fit with fixed at unity resulted in a similar to that obtained with left free to vary, then we decided to use 1 in the following fits. The addition of a reflection component in the NP(WP) model caused to decrease by 9(6), see model refl-NP(refl-WP) in Table 2. The photon index steepens to 1.65 in both absorption scenarios (e.g. Fig. 2 (left panel) for the iso- contour plot of NH versus for the refl-NP model). Given the large luminosity of FTM 08303759 we also tested the possible presence of a reflection component from ionized material by replacing the pexrav component in the refl-NP and refl-WP model with the reflion model of Ross & Fabian (2005). This model is self-consistent as it also incorporates fluorescent emission lines from ionized species. Accordingly we removed from the fitting model the Gaussian line used in all the previous fits to describe the line-like feature around 6.4 keV (quasar-frame). The best-fit values of the ionization parameter of the reflector were found to be consistent with the minimum permitted value of = 30 erg cm s-1 (with an upper limit of 40 erg cm s-1), which yielded /dof values slightly worse than those with the pexrav component. This clearly indicates that the reflection medium is almost neutral. Using the formula (1) reported in Brenneman et al. (2009), we were able to provide an estimate of the reflection fraction . Regardless the physical state of the absorber, we measured an value of 0.6, that supports a scenario in which the hard X-ray spectrum of FTM 08303759 is not largely reflection-dominated.
Furthermore, we examined the intriguing possibility that the soft-excess could instead be the result of a combination of scattered continuum and multiple emission lines arising from the same mildly ionized gas responsible of the absorption (e.g., Pounds et al., 2005; McKernan et al., 2007; Longinotti et al., 2008). To model this soft X-ray emitter we again used the XSTAR output table grid 18, with the ionization parameter and the column density of the emitter tied to the values of the absorber. We also added to this model a neutral reflection component with fixed to 1. This model (e.g. refl-wabs in Table 2) gave a very good fit to the EPIC data with dof = 309/321 when the iron abundance was fixed to 3 (i.e. its best-fit value) for the warm gas. We deduced a low ionization parameter of 6 erg cm s-1 and a column density of NH 1022 cm-2 for the absorbing/emitting gas. The photon index of the power law resulted = 1.520.03, i.e. flatter than that measured with the refl-WP model (1.65).
Finally, we considered a model where a thermal plasma component (mekal in XSPEC) is responsible for a fraction of the soft X-ray positive excess shown in Fig. 1 (left panel), under the hypothesis of an origin from starburst activity. We therefore included a mekal component (Kaastra et al., 1996) with solar abundance in the refl-NP model. The resulting dof was excellent with 303/321, significant at 99.1% confidence in an test (e.g. model th-NP in Table 2). However, the best-fit temperature of the emitting plasma was pegged at the minimum value allowed of k 0.08 keV with an upper limit of 0.13 keV. It is also important to note that the derived 0.5-2 keV luminosity of 2.1 1042 erg s-1 for this thermal component even exceeds the highest values measured for starburst regions in ultra-luminous infrared galaxies (e.g., Franceschini et al., 2003).
4.3 The Iron K emission line
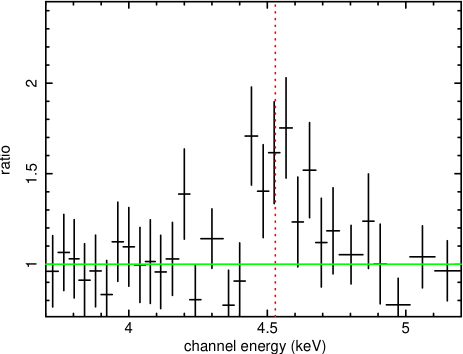
The presence of an excess around 6.4 keV (rest-frame) in the XMM–Newton spectrum of FTM 08303759 is clearly evident. Fig. 2 (right panel) shows the data/model ratio in the observer Fe K emission line energy range when fitting the refl-NP model over 0.3-9 keV and ignoring the 3.8-5.2 keV band.
We have modeled this spectral feature with a narrow Gaussian line. The inclusion of this component in the fit resulted in very significant statistical improvement ( = 13 for two additional free parameters), i.e. at 99.99% confidence level according to an –test once compared to a model without the line. We concentrated only on PN data for a more accurate determination of the Fe K line parameters since the PN CCD has a better sensitivity and energy resolution over the 4-6 keV energy range than the MOS CCD. The rest-frame energy centroid of the line is = 6.42 keV. This energy indicates a low ionization state, Fe I–XVIII, of the emitting material. Allowing the width of the line in FTM 08303759 to vary did not improve the fit over a narrow-line model ( 0.18 keV). We measured a redshift-corrected equivalent width EW = 16860 eV assuming that the line and continuum are both absorbed, while the EW calculated with respect to the reflected continuum is EW = 800280 eV.
4.4 X-ray Fluxes and Luminosities of FTM 08303759
Once model refl-NP was assumed, we measured an observed(intrinsic) 2-10 keV flux of 8.9(9.4) 10-13 erg cm-2 s-1 and a 0.5-2 keV flux of 1.3(4.1) 10-13 erg cm-2 s-1. After correction for both Galactic and intrinsic absorption, the luminosity of FTM 08303759 are = 4.8 1044 and = 2.3 1044 erg s-1 in the hard and soft band, respectively. The average bolometric corrections measured for radio-quiet AGNs with similar from Vasudevan & Fabian (2007) are in the range 20–40, that imply a bolometric luminosity of 0.97–1.94 1046 erg s-1 for FTM 08303759.
5 Chandra Observation
5.1 Data Reduction
U05 presented the results of a Chandra ACIS-S snapshot survey of broad line red quasars aimed at measuring the gas-to-dust ratios of the medium obscuring the nucleus. FTM 08303759, the brightest object in this sample, was observed by Chandra for 9 ks in January 2004.
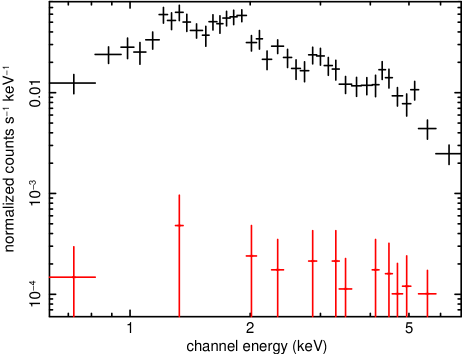
Event files of the Chandra observation were retrieved from the Chandra X-ray Center. The data reduction was performed with the CIAO v4.1 package following the standard procedures outlined in the Science Analysis Threads for ACIS data at the CIAO Web site. Source and background spectra were produced using the psextract222http://cxc.harvard.edu/ciao/threads/psextract/ script. For the creation of the response matrices with the newest calibrations available we used the mkacisrmf task. The ACIS source spectrum in the 0.3-7 keV band was grouped to a minimum of 20 counts per bin (see Fig. 3).
5.2 Spectral Analysis
U05 fitted the spectrum of this quasar with an absorbed, steep power-law ( 2.9; NH 2.7 1022 cm-2) plus a broad ( 0.6 keV) Gaussian emission line at 6.4 keV. However, they also reported the presence of evident unfitted absorption/emission features. We have therefore re-analyzed those data in order to provide a better characterization of the X-ray spectrum of this powerful quasar. Our analysis of the Chandra data of FTM 08303759 resulted quite different from that published by U05. A fitting model similar to the NP model described in Sect. 4.2 with NH 2.1 1022 cm-2 and 0.07 provided a very good description with a final dof=38/36. We measured a power-law photon index of = 1.650.25, i.e. significantly flatter than that reported by U05 and consistent with that obtained from the XMM–Newton observation. An alternative fit with a warm absorber was slightly worse, yielding dof = 42/36 (NH 2.5 1022 cm-2 and ionization parameter 23 erg cm s-1). The application of a model in which the ionized gas covers only partially the X-ray source did not improve the fit significantly ( = 5 for one additional parameter) and resulted in best-fit ionization parameter consistent with the minimum allowed value of 10-4 erg cm s-1. We therefore consider the cold absorber model as the most appropriate description of the Chandra spectrum of FTM 08303759.
The data/model residuals for this model suggested a possible unmodelled absorption feature at 1.52 keV (i.e. 2.15 keV in the quasar rest-frame). The addition of an absorption Gaussian line in the fit resulted significant at 93% confidence level. We also checked the possibility that this line at 2.150.07 keV (EW=6544 eV) could be an artifact owing to a bad background subtraction. In particular, two well-known emission lines from Al K and Si K are present in the ACIS background spectrum at 1.49 and 1.74 keV, respectively. However, the background spectrum does not show any spectral feature and its intensity is an order of magnitude fainter than the background-subtracted signal from FTM 08303759, e.g. Fig. 3. The presence of the absorption line at 2.15 keV is very puzzling as this energy does not correspond to any obvious line of appreciable strength. It can be associated to Si XIII-XV transitions but, in this case, much more prominent features from more abundant, lighter elements are expected, which are instead not observed. On the basis of these arguments and the low statistical significance of this line, the presence of this feature will be ignored in the following discussion.
Furthermore a small positive excess was seen around 4.5 keV (i.e. 6.4 keV rest-frame). The inclusion of a narrow Gaussian emission line in the NP model produced a statistical improvement of = 3 for two additional parameters, corresponding to an F-statistics probability of 90%. We measured the centroid of the line at 6.17 keV and an EW value of 232175 eV. Even if the energy of this line is not fully consistent with 6.4 keV, an explanation in terms of Fe K emission is very likely.
Finally, from this Chandra observation we derived a 2-10(0.5-2) keV flux of 1.3(0.2) 10-12 erg cm-2 s-1, corresponding to a luminosity of 8(4.3) 1044 erg s-1.
6 Broad-Band Spectral Properties of FTM 08303759
A widely adopted way to evaluate the broad-band properties of AGN consists in estimating the optical UV-to-X-ray power-law slope 333 , where and are the rest-frame flux densities at 2 keV and 2500 Å, respectively (e.g. Avni et al., 1980; Zamorani et al., 1981) and comparing it with the values obtained from large samples of optically selected broad-line quasars (e.g., Vignali et al., 2003b; Strateva et al., 2005; Steffen et al., 2006). Unlike blue broad-line AGNs, which are usually characterized by low extinction, the optical/UV spectral properties of our target are consistent with heavy extinction (U05; Urrutia et al., 2008).
To obtain an “intrinsic” value for , we applied a correction to the observed rest-frame 2500 Å and 2 keV flux densities. In the UV band, to derive the luminosity at 2500 Å, we used the magnitudes from the SDSS and adopted a procedure as described in Vignali et al. (2003b). Then we assumed the nuclear extinction estimated by Urrutia et al. (2008) using HST data, i.e. E(BV) = 1.29, coupled with an SMC extinction curve with as in Urrutia et al. (2008) to correct the (2500 Å). In the X-rays, the correction for obscuration has been obtained directly from the best-fitting column density value (see Sect. 4.4). The resulting is ; at face value, this value is significantly steeper than that expected using the vs. (2500 Å) correlation (e.g. Eq. (2) in Steffen et al. (2006); see also Just et al. (2007)). Such extreme values are more typical of the X-ray weak quasar population (Brandt et al., 2000), which is largely dominated by Broad Absorption Line (BAL) quasars (e.g. Weymann et al., 1991). Unfortunately, given the source redshift current optical spectral data are not able to provide a direct observational evidence for a possible BAL nature of FTM 08303759 (e.g. Sect. 7.2). Steep values can also explained in terms of high Eddington ratios () as proposed by Kuraszkiewicz et al. (2009b) on the basis of the predictions from the accretion disk/corona model of Witt et al. (1997). According to these authors high values of the accretion rate should lead to an increase of the ratio between big blue bump and X-ray emission. In this respect, observational evidence supporting the existence of a correlation between and comes from recent works based on large samples of AGNs (Young et al., 2009; Lusso et al., 2009). This may bolster the hypothesis of FTM 08303759 being a BAL quasar since high values are typical of Narrow Line Seyfert 1 galaxies and BAL quasars, but both optical (i.e. emission line widths 1000 km s-1) and X-ray spectral properties (i.e. relatively flat power-law photon index 1.65) of FTM 08303759 are not consistent with those of a Narrow Line Seyfert 1 galaxy (e.g., Leighly, 1999, and references therein).
7 Discussion
The combination of X-ray brightness and a net exposure of 40 ks makes the XMM–Newton spectrum of FTM 08303759 one of the best exposed and most detailed X-ray spectra of a red (i.e. with 1.7 and 4.0) broad-line quasar to date. This observation has definitely confirmed the complexity of the X-ray spectrum of this luminous quasar. In particular, our analysis has revealed (i) the presence of a heavy absorption with NH 1022 cm-2 along the line of sight to the nucleus and (ii) the significant detection of a Compton reflection component accompanied by a clear-cut Fe K emission line in this AGN with 5 1044 erg s-1.
The results from re-analysis of the Chandra data taken in 2004 are consistent with those derived from the XMM–Newton observation. One immediate conclusion that can be drawn from these findings is that the X-ray spectrum of FTM 08303759 significantly differs from that typically observed for optically-selected, broad-line quasars with comparable 2-10 keV luminosity (Piconcelli et al., 2005; George et al., 2000; Just et al., 2007).
7.1 The nature of the X-ray absorber
The present X-ray observation is not able to provide unambiguous information about the location and the physical state of the absorber. In fact, both a model with neutral and mildly-ionized obscuring material provide an excellent fit to the EPIC data (see Table 2). Unfortunately, no meaningful RGS data were collected for FTM 08303759 during this XMM–Newton observation.
In this Section, we discuss possible scenarios for the nature of the X-ray absorber in FTM 08303759. A direct statistical comparison between model NP and model WP favors the warm absorption scenario at 99.6% confidence level using the test. Nonetheless, when a Compton reflection component with =1 is added to the NP model, the fit involving an ionized absorber is no longer statistically preferable to a model with cold absorption (i.e. model refl-NP) as the difference in terms of =1 for 1 dof is significant at only 70% confidence level according to the test.
7.1.1 Cold Absorption Scenario
Wilkes et al. (2002, 2005) and U05 have indeed reported the common presence of cold absorption in the X-ray spectra of broad-line red quasars unlike optically-selected objects (Piconcelli et al., 2005). The value of NH2 1022 cm-2 measured for FTM 08303759 (e.g. model refl-NP in Table 2) is consistent with the distribution of the column density peaking around a few 1022 cm-2 observed for the samples of red 2MASS quasars.
Using a reddening of E(B-V)=1.290.12 mag (4 mag) from Urrutia et al. (2008) and assuming for the dust:gas ratio the average Galactic value of 1.7 mag cm2/atoms (Bohlin et al., 1978) we derived a NH value of 7.50.7 1021 cm-2, which is only a factor of 2.6 lower than the NH measured from our XMM–Newton observation. This is interesting since Maiolino et al. (2001) found that only low-luminosity (i.e. 1042 erg s-1) AGNs usually show a E(B-V)/NH ratio roughly consistent with the Galactic one, while FTM 08303759 is a very luminous quasar with 5 1044 erg s-1. The match between the column density measured via X-ray spectroscopy and that expected on the basis of reddening E(B-V) due to the dust suggests the likely possibility that the same material is responsible for the obscuration both in optical and X-rays. Similar findings have been reported by Kuraszkiewicz et al. (2009a) by an extensive study of the SED of 44 red, 2MASS-selected AGNs at low . They found a substantial agreement among the column densities inferred from the X-ray spectral fitting and those derived from optical/IR colors once a very detailed modeling of the optical colors is performed (i.e. including the combined effects due to reddening and the contributions from the AGN scattered unreddened light and the host galaxy emission). Using Principal Component Analysis of the SED and emission-line parameters for the same sample, Kuraszkiewicz et al. (2009b) argue that the optical/X-ray absorber may lie far from the nucleus, and presumably outside the NLR. The interstellar medium of the host galaxy with a dust:gas ratio being comparable with Galactic dust might represent a good candidate for this obscuration (Weingartner & Murray, 2002; Dai & Kochanek, 2009). In particular, Kuraszkiewicz et al. (2009b) proposed that obscuration possibly occurs in the ISM of a host galaxy inclined to our line of sight (LOS), although obscuration by circumnuclear dust is also important.
As described in Sect. 4.2, our spectral analysis results are also consistent with a scenario wherein the absorber only partially covers the X-ray emitting region. This implies two distinct LOS and that the obscuring screen along our LOS is not uniform, being spatially located in the nuclear region. The obscuring material must indeed be close to the continuum source for partial covering to work. A clumpy (sub-)pc-scale torus as that proposed by Risaliti et al. (2005) and Elitzur (2008, and references therein) can easily satisfy both these conditions. The short time-scales (i.e. few hours) temporal variability of the absorbing column density observed in some Seyfert 2 galaxies strongly supports this interpretation, for which the obscuring matter is not continuously distributed and doughnut-shaped (e.g. Pier & Krolik, 1993; Granato & Danese, 1994) but consists of a number of clouds distributed in order that the probability for direct viewing the AGN increases away from the equatorial plane. Broad-line emitting clouds lying inside the dust sublimation radius () are dust-free and extinguish only X-rays, while clouds being farther than are dusty and absorb the AGN light both at X-rays and optical wavelength.
However, both the non-variability of the NH over the XMM–Newton exposure time (also compared with the 2004 Chandra observation) and the consistency between the NH values obtained from optical reddening and X-ray analysis suggests that our LOS mostly intercepts dusty material outside the (i.e. pc- and kpc-scale dust lanes and the interstellar medium in the host galaxy), decreasing the probability it can partially cover the X-ray nuclear source in FTM 08303759.
7.1.2 Ionized Absorption Scenario
We found that a warm absorber model can also provide an excellent description of the X-ray spectrum of FTM 08303759. Features from ionized absorbers are detected in the UV and X-ray spectra of over half of AGNs (Crenshaw et al., 1999; Reynolds, 1997; Piconcelli et al., 2005; McKernan et al., 2007) which are interpreted as the signature of an outflowing multi-component wind rising vertically from the accretion disk intercepting our LOS (Crenshaw et al., 2003; Krongold et al., 2007, and references therein). The large deficit below 2 keV visible in Fig. 1 (left panel) would be the result of the interplay between large column density and moderate ionization level of the obscuring gas. Such a combination of physical parameters of the warm absorber is not commonly observed in unreddened Type 1 AGNs (e.g. McKernan et al., 2007) and it could be responsible for the classification of FTM 08303759 as red quasar. However, our EPIC data cannot provide the adequate resolution and sensitivity to significantly detect the likely presence of multiple ionization components and, therefore, the measured values of NH and must be considered as average values of these parameters. Recent observations (Steenbrugge et al., 2009; Krongold et al., 2007) have pinpointed the distance of absorption components of the warm absorber in AGNs at sub-pc scale from the X-ray source. The clumpy and outflowing nature of the AGN winds lends support to a partial-covering scenario, which is consistent with our spectral analysis results (e.g. Sect. 4.2), with two different LOS, one of which does not pass through the wind.
As described in Sect. 4.2 we also tested a model wherein
the soft X-ray extra-continuum
component is explained in terms of a mix of scattered emission and photoionized emission from the
moderately-ionized absorber itself (e.g. model refl-wabs in Table 2).
We yielded a very good fit to the
XMM–Newton spectral data with 6 erg cm s-1 and a column density of
NH 1.3 1022 cm-2 for the obscuring gas. These
values indicate a low ionization state of the absorber that
significantly reduces the primary AGN emission in the soft X-ray
portion of the spectrum and, in turn, could unveil weak emission
components which are usually overwhelmed by the continuum in normal
broad-line AGNs. Interestingly, a similar scenario was also suggested to
explain the soft-excess emission in the red quasars 2MASS
234491221 (Pounds et al., 2005), 2MASS 10495837 (Wilkes et al., 2008) and 2MASS 09182117 (Pounds & Wilkes, 2007),
and, furthermore, for the Seyfert 1 galaxy Mkn 335 during a very low
continuum state (Longinotti et al., 2008).
Finally, if a cold absorption component is added to the warm absorber fitting models, no improvement in the fit statistic is yielded, with an upper limit of NH6 1020 cm-2 on its column density, indicating that a scenario with an innermost highly ionized absorber embedded in large-scale (i.e. galactic) neutral absorber cannot explain the X-ray spectrum of FTM 08303759.
7.2 FTM 08303759 as a possible BAL quasar candidate
The presence of a nuclear outflow in FTM 08303759 can be interesting in the light of the results recently obtained by Urrutia et al. (2009) for a spectroscopic survey of red quasars with selection criteria very similar to those used in the FTM survey. For this sample they found a significantly larger fraction (40%) of BAL quasars at 0.9 than that observed in optical surveys (Hewett & Foltz, 2003). BALs are interpreted as direct evidence of a mass outflow from the AGN (Weymann et al., 1991; Elvis, 2000; Hasinger et al., 2002; Young et al., 2007). The frequent detection of BALs in red quasars leads Urrutia et al. (2009) to suggest that BAL quasars may represent a peculiar dust-enshrouded phase in the evolution of quasars. The appearance as a BAL quasar might indeed be linked to the duty cycle of an accreting supermassive black hole instead of being simply due to an orientation effect and the geometry of the outflow. Moreover their powerful nuclear winds may be the main mechanism responsible for the AGN-driven feedback thought to be relevant for star formation quenching and invoked in many models of joint formation and co-evolution of quasars and their massive spheroidal host galaxies (Hopkins et al., 2006; Di Matteo et al., 2005; Silk & Rees, 1998). Evidence for a large fraction of mergers and ongoing galaxy interactions, that are believed to be the trigger of both starburst and AGN activity at the very initial stages of galaxy/AGN co-evolution has been indeed observed amongst host galaxies of FTM luminous quasars by Urrutia et al. (2008). Georgakakis et al. (2009) have recently discovered that the level of star-formation activity in the luminous, high-, red quasars is higher than in optically-selected objects. This provides further clues to an evolutionary scenario where red quasars are young, dust-embedded objects in which the AGN driven feedback processes have not yet completely inhibited the star-formation in their host galaxies. As described in Sect. 6, the steep value ( = 2.3) reported for FTM 08303759 is favorably compatible with the observed broad-band properties of BAL quasars and, furthermore, the complex, absorption-dominated spectrum of FTM 08303759 resembles the typical X-ray spectrum of a BAL quasar (e.g. Gallagher et al., 2002; Schartel et al., 2005). Unfortunately the redshift of FTM 08303759 is not in the range suited to provide a direct BAL classification for this quasar by a ESI/Keck spectrum as pointed out by Urrutia et al. (2009). Future observations will be able to detect the possible absorption troughs in the optical-UV spectrum of this reddened quasar in order to shed light on the presence of a strong outflowing nuclear wind.
7.3 Comparison with the Hard X-ray Properties of unreddened Broad-line Quasars
Our analysis of the XMM–Newton observation of FTM 08303759 has revealed the presence of the typical features of a Comptonized reflected spectrum from a neutral material, i.e. an intense fluorescent Fe K emission line and a hard X-ray Compton reflection component (George & Fabian, 1991; Krolik et al., 1994; Perola et al., 2002). Given the paucity of well-exposed quasars with 5 1044 erg s-1 information regarding the presence and the properties of reflection features in their hard X-ray spectra are still sparse (see also Miniutti et al., 2009). In particular, since the peak of the Compton hump occurs at 30 keV, the sensitivity reached by current and past X-ray telescopes observing in this energy band allows to efficiently study only very few bright sources, which are predominantly local Seyfert galaxies.
The line equivalent width measured with respect to the reflected continuum assuming =1 is EW 800 eV, that is consistent with the theoretical prediction of EW 1000 eV for reflection from optically thick material with iron solar abundance (e.g. Matt et al., 1996) suggesting an origin in the reflecting medium. Bearing in mind the uncertainty in the exact value of , this in turn implies the presence of off-LOS Compton-thick material in this quasar that can be likely associated with a pc-scale structure (Jaffe et al., 2004; Meisenheimer et al., 2007) as the putative torus envisaged by the AGN Unified Model (Antonucci, 1993). On the other hand, the value of the EW calculated with respect to the unabsorbed primary continuum is 160 eV, that is significantly higher than the predicted EW from a uniform shell of material with a column density of NH 2 1022 cm-2 encompassing the continuum source, i.e. EW 40 eV (Guainazzi et al., 2005; Matt, 2002). Unreddened broad-lined quasars at the same hard X-ray luminosity level of FTM 08303759 typically show an Fe K line with an EW in the range from 40 eV (Bianchi et al., 2007b) to 70 eV (Jimenez-Bailon et al., 2005). The large EW value reported for FTM 08303759 can be explained with a large covering fraction of the Fe-emitting material in this red quasar or, alternatively, it could be associated to a low-flux state of the central source, with the distant reflector still responding to an average higher luminosity.
Finally, once a reflection continuum is included in the fitting model,
the slope of the power-law continuum measured for FTM 08303759 (
1.65) is still slightly flatter than the canonical spectral
index measured for classical radio-quiet quasars, i.e 1.8–1.9
(Just et al., 2007; Piconcelli et al., 2005). A low-flux state can also be invoked for
interpreting the observed slope (Grupe et al., 2008). Furthermore, the value of
1.65 is at odds with the claim of U05 that red quasars show
an average steep photon index of =2.1–2.2.
However such conclusion is based on values of inferred from
low-count spectra or hardness-ratio analysis and therefore affected by
large uncertainties: deeper X-ray follow-up observations of these
red quasars indeed found spectral index values consistent with those
typical of optically-selected quasars
(e.g., Wilkes et al., 2005; Pounds et al., 2005).
References
- Alonso-Herrero et al. (1998) Alonso-Herrero, A., Simpson, C., Ward, M. J., & Wilson, A. S. 1998, ApJ, 495, 19
- Antonucci (1993) Antonucci, R. 1993, ARA&A, 31, 473
- Arnaud (1996) Arnaud, K. A. 1996, Astronomical Data Analysis Software and Systems V (ASP Conf. Ser. 101), ed. G. H. Jacoby & J. Barnes (San Francisco, CA: ASP), 17
- Avni (1976) Avni, Y. 1976, ApJ, 210, 642
- Avni et al. (1980) Avni, Y., Soltan, A., Tananbaum, H., Zamorani, G. 1980, ApJ, 238, 800
- Barkhouse & Hall (2001) Barkhouse, W. A. & Hall, P. B. 2001, AJ, 121, 284
- Bennert et al. (2008) Bennert, N., Canalizo, G., Jungwiert, B., Stockton, A., Schweizer, F., Peng, C. Y., & Lacy, M. 2008, ApJ, 677, 846
- Bianchi et al. (2007a) Bianchi, S., Chiaberge, M., Piconcelli, E., & Guainazzi, M. 2007a, MNRAS, 374, 697
- Bianchi et al. (2007b) Bianchi, S., Guainazzi, M., Matt, G., & Fonseca Bonilla, N. 2007b, A&A, 467, L19
- Bianchi et al. (2006) Bianchi, S., Guainazzi, M., & Chiaberge, M. 2006, A&A, 448, 499
- Bohlin et al. (1978) Bohlin, R. C., Savage, B. D., & Drake, J. F. 1978, ApJ, 224, 132
- Brandt et al. (2000) Brandt, W. N., Laor, A., & Wills, B. J. 2000, ApJ, 528, 637
- Brenneman et al. (2009) Brenneman, L. W. et al., 2009, ApJ, 698, 528
- Crenshaw et al. (1999) Crenshaw, D. M., Kraemer, S. B., Boggess, A., Maran, S.P., Mushotzky, R. F., & Wu, C. 1999, ApJ, 516, 750
- Crenshaw et al. (2003) Crenshaw, D. M., Kraemer, S. B., & George, I. M 2003, ARA&A, 41, 117
- Cutri et al. (2002) Cutri, R. M., Nelson, B. O., Francis, P. J., & Smith, P. S. 2002, AGN Surveys (Proc. IAU Colloquium 184) (ASP Conf. Proc. 284), ed. R. F. Green, E. Y. Khachikian, & D. B. Sanders (San Francisco, CA: ASP), 127
- Dai & Kochanek (2009) Dai, X., & Kochanek, C. S. 2009, ApJ, 692, 677
- De Rosa et al. (2008) De Rosa, A., Bassani, L., Ubertini, P., Panessa, F., Malizia, A., Dean, A. J., & Walter, R. 2008, A&A, 483, 749
- Deluit & Courvoisier (2003) Deluit, S., & Courvoisier, T. J.-L., 2003, A&A, 399, 77
- Di Matteo et al. (2005) Di Matteo, T., Springel, V., & Hernquist, L. 2005, Nature, 433, 604
- Donley et al. (2008) Donley, J. L., Rieke, G. H., Perez-Gonzalez, P. G., Barro, G. 2008 ApJ, 687, 111
- Dunlop et al. (2003) Dunlop, J. S., McLure, R. J., Kukula, M. J., Baum, S. A., O’Dea, C. P., & Hughes, D. H. 2003, MNRAS, 340, 1095
- Elitzur (2008) Elitzur, M. 2008, New Astron. Rev., 52, 274
- Elvis (2000) Elvis, M. 2000, ApJ, 545, 63
- Elvis et al. (1994) Elvis, M. et al. 1994, ApJS, 95, 1
- Fiore et al. (2008) Fiore, F., et al. 2008, ApJ, 672, 94
- Floyd et al. (2004) Floyd, D. J. E., Kukula, M. J., Dunlop, J. S., McLure, R. J., Miller, L., Percival, W. J., Baum, S. A., & O’Dea, C. P. 2004, MNRAS, 355, 196
- Francis et al. (2004) Francis, P. J., Nelson, B. O., Cutri, R. M. 2004, AJ, 127, 646
- Franceschini et al. (2003) Franceschini, A., Braito, V., Persic, M., et al. 2003, MNRAS, 343, 1181
- Gallagher et al. (2002) Gallagher, S. C., Brandt, W. N., Chartas, G., & Garmire, G. P. 2002, ApJ, 567, 37
- Georgakakis et al. (2009) Georgakakis, A., Clements, D. L., Bendo, G., Rowan-Robinson, M., Nandra, K., Brotherton, M. S. 2009, MNRAS, 394, 533
- George & Fabian (1991) George, I. M., & Fabian, A. C. 1991, MNRAS, 249, 352
- George et al. (2000) George, I. M., Turner, T. J., Yaqoob, T., Netzer, H., Laor, A., Mushotzky, R. F., Nandra, K., Takahashi, T. 2000, ApJ, 531, 52
- Glikman et al. (2004) Glikman, E., Gregg, M. D., Lacy, M., Helfand, D. J., Becker, R. H., & White, R. L. 2004, ApJ, 607, 60
- Glikman et al. (2007) Glikman, E., Helfand, D. J., White, R. L., Becker, R. H., Gregg, M. D., & Lacy, M. 2007, ApJ, 667, 673
- Gorjian et al. (2004) Gorjian, V., Werner, M. W., Jarrett, T. H., Cole, D. M., & Ressler, M. E. 2004, ApJ, 605, 156
- Granato & Danese (1994) Granato, G. L. & Danese, L. 1994, MNRAS, 268, 235
- Grupe et al. (2008) Grupe, D., Komossa, S., Gallo, L. C., Fabian, A. C., Larsson, J., Pradhan, A. K., Xu, D., & Miniutti, G. 2008, ApJ, 681, 982
- Guainazzi & Bianchi (2007) Guainazzi, M., & Bianchi, S. 2007, MNRAS, 374, 1290
- Guainazzi et al. (2005) Guainazzi, M., Matt, G., & Perola, G. C. 2005, A&A, 444, 119
- Hall et al. (2006) Hall, P., et al. 2006, AJ, 132, 1977
- Hasinger et al. (2002) Hasinger, G., Schartel, N., Komossa, S., 2002, ApJ, 573, L77
- Hewett & Foltz (2003) Hewett, P. C. & Foltz, C. B. 2003, AJ, 125, 1784
- Hopkins et al. (2006) Hopkins, P. F., Somerville, R. S., Hernquist, L., Cox, T. J., Robertson, B., & Li, Y. 2006, ApJ, 652, 864
- Hutchings et al. (2006) Hutchings, J. B., Cherniawsky, A., Cutri, R. M., & Nelson, B. O. 2006, AJ, 131, 680
- Jansen et al. (2001) Jansen, F, et al. 2001, A&A, 365, L1
- Jaffe et al. (2004) Jaffe, W., et al. 2004, Nature, 429, 47
- Jimenez-Bailon et al. (2005) Jimenez-Bailon E., Piconcelli E., Guainazzi M., Schartel N., Rodriguez-Pascual P. M., Santos-Lleó, M. 2005, A&A, 435, 449
- Just et al. (2007) Just, D. W., Brandt, W. N., Shemmer, O., Steffen, A. T., Schneider, D. P., Chartas, G., & Garmire, G. P. 2007, ApJ, 665, 1004
- Kaastra et al. (1996) Kaastra, J.S., Mewe, R., & Nieuwenhuijzen, H., 1996, 11th Colloquium on UV and X-ray Spectroscopy of Astrophysical and Laboratory Plasmas, 411
- Kalberla et al. (2005) Kalberla, P. M. W., Burton, W. B., Hartmann, D., Arnal, E. M., Bajaja, E., Morras, R., & Poppel, W. G. L. 2005, A&A, 440, 775
- Kallman & Bautista (2001) Kallman, T., & Bautista, M. 2001, ApJS, 133, 221
- Kinkhabwala et al. (2002) Kinkhabwala, A., et al. 2002, ApJ, 575, 732
- Krolik et al. (1994) Krolik, J. H., Madau, P., & Zycki, P. T. 1994, ApJ, 420, L57
- Krongold et al. (2007) Krongold, Y., Nicastro, F., Elvis, M., Brickhouse, N., Binette, L., Mathur, S., & Jimenez-Bailon, E. 2007, ApJ, 659, 1022
- Kuraszkiewicz et al. (2009a) Kuraszkiewicz, J. K. et al. 2009a, ApJ, 692, 1143
- Kuraszkiewicz et al. (2009b) Kuraszkiewicz, J. K. et al. 2009b, ApJ, 692, 1180
- Lacy et al. (2004) Lacy, M. et al. 2004, ApJS, 154, 166
- Lacy et al. (2007) Lacy, M., Petric, A. O., Sajina, A., Canalizo, G., Storrie-Lombardi, L. J., Armus, L., Fadda, D., Marleau, F. R. 2007, AJ, 133, 186
- Lanzuisi et al. (2009) Lanzuisi, G., Piconcelli, E., Fiore, F., Feruglio, C., Vignali, C., Salvato, M., & Gruppioni, C. 2009, A&A, 498, 67
- Laor et al. (1997) Laor, A., Fiore, F., Elvis, M., Wilkes, B. J., & McDowell, J. C. 1997, ApJ, 477, 93
- Leighly (1999) Leighly, K. M. 1999, ApJS, 125, 317
- Leipski et al. (2005) Leipski, C., et al. 2005, A&A, 440, L5
- Longinotti et al. (2008) Longinotti, A. L., Nucita, A., Santos-Lleo, M., Guainazzi, M. 2008, A&A, 484, 311
- Lusso et al. (2009) Lusso, E., et al. 2009, A&A, submitted
- Magdziarz & Zdziarski (1995) Magdziarz, P. & Zdziarski, A. A. 1995, MNRAS, 283, 837
- Maiolino et al. (2001) Maiolino, R., Marconi, A., Salvati, M., Risaliti, G., Severgnini, P., Oliva, E., La Franca, F., & Vanzi, L. 2001, A&A, 365, 28
- Matt (2002) Matt, G. 2002, MNRAS, 337, 147
- Matt et al. (1996) Matt, G., Brandt, W. N., & Fabian, A. C. 1996, MNRAS, 280, 823
- McKernan et al. (2007) McKernan, B., Yaqoob, T., & Reynolds, C. S. 2007, MNRAS, 379, 1359
- Meisenheimer et al. (2007) Meisenheimer, K., et al. 2007, A&A, 471, 453
- Mineo et al. (2000) Mineo, T., et al. 2000, A&A, 359, 471
- Miniutti et al. (2009) Miniutti, G., Piconcelli, E., Bianchi, S., Vignali, C., Bozzo, E. 2009, MNRAS in press, (arXiv:0909.2960)
- Nandra et al. (2007) Nandra, K., O’Neill, P. M., George, I. M., & Reeves, J. N. 2007, MNRAS, 382, 194
- Page et al. (2005) Page, K. L., Reeves, J. N., O’Brien, P. T., & Turner, M. J. L. 2005, MNRAS, 364, 195
- Panessa et al. (2008) Panessa, F., et al. 2008, A&A, 483, 151
- Perola et al. (2002) Perola, G. C., et al. 2002, A&A, 389, 802
- Pier & Krolik (1993) Pier, E. A., & Krolik, J. H. 1993, ApJ, 418, 673
- Piconcelli et al. (2003) Piconcelli, E., Cappi, M., Bassani, L., Di Cocco, G., Dadina, M. 2003, A&A, 412, 689
- Piconcelli et al. (2004) Piconcelli, E., Jimenez-Bailon, E., Guainazzi, M., Schartel, N., Rodriguez-Pascual, P. M., & Santos-Lleo, M. 2004, MNRAS, 351, 161
- Piconcelli et al. (2005) Piconcelli, E., Jimenez-Bailon, E., Guainazzi, M., Schartel N., Rodriguez-Pascual, P. M., & Santos-Lleo, M. 2005, A&A, 432, 15
- Pounds & Wilkes (2007) Pounds, K. A., & Wilkes, B. J. 2007, MNRAS, 380, 1341
- Pounds et al. (2005) Pounds, K. A., Wilkes, B. J., & Page, K. L. 2005, MNRAS, 362, 784
- Reichard et al. (2003) Reichard, T. A., et al. 2003, AJ, 126, 2594
- Reynolds (1997) Reynolds, C. S. 1997, MNRAS, 286, 513
- Risaliti & Elvis (2004) Risaliti, G., & Elvis, M. 2004, in Supermassive Black Holes in the Distant Universe, ed. A. J. Barger (Dordrecht: Kluwer), 187
- Risaliti et al. (2005) Risaliti, G., Elvis, M., Fabbiano, G., Baldi, A., Zezas, A. 2005, ApJ, 623, L93
- Ross & Fabian (2005) Ross, R. R., & Fabian, A. C., 2005, MNRAS, 358, 211
- Turner et al. (1997) Turner, T. J., George, I. M., Nandra, K., & Mushotzky, R. F. 1997, ApJS, 113, 23
- Sanchez et al. (2004) Sanchez, S. F., Jahnke, K., Wisotzki, L., et al. 2004, ApJ, 614, 586
- Schartel et al. (2005) Schartel, N., et al. 2005, A&A, 433, 455
- Schmidt et al. (2007) Schmidt, G. D., Smith, P. S., Hines, D. C., Tremonti, C. A., & Low, F. J. 2007, ApJ, 666, 784
- Silk & Rees (1998) Silk, J., & Rees, M. J. 1998, A&A, 331, L1
- Skrutskie et al. (2006) Skrutskie, M. F., et al. 2006, AJ, 131, 1163
- Smith et al. (2003) Smith, P. S., Schmidt, G. D., Hines, D. C., & Folz, C. B. 2003, ApJ, 593, 676
- Spergel et al. (2007) Spergel, D. N. et al. 2007, ApJS, 170, 377
- Steenbrugge et al. (2009) Steenbrugge, K. C., Feňovčík , M., Kaastra, J. S., Costantini, E., & Verbunt, F. 2009, A&A, 496, 107
- Steffen et al. (2006) Steffen, A. T., Strateva, I., Brandt, W. N., Alexander, D. M., Koekemoer, A. M., Lehmer, B. D., Schneider, D. P., & Vignali, C. 2006, AJ, 131, 2826
- Strateva et al. (2005) Strateva, I. V., Brandt, W. N., Schneider, D. P., Vanden Berk, D. G., & Vignali, C. 2005, AJ, 130, 387
- Urrutia et al. (2009) Urrutia, T., Becker, R. H., White, R. L., Glikman, E., Lacy, M., Hodge, J., & Gregg, M. D. 2009, ApJ, 698, 1095
- Urrutia et al. (2008) Urrutia, T., Lacy, M., Becker, R. H. 2008, ApJ, 674, 80
- Urrutia et al. (2005) Urrutia, T., Lacy, M., Gregg, M. D.; Becker, R. H. 2005, ApJ, 627, 75 (U05)
- Vasudevan & Fabian (2007) Vasudevan, R. V., & Fabian, A. C. 2007, MNRAS, 381, 1235
- Vignali et al. (2003a) Vignali, C., et al. 2003a, AJ, 125, 2876
- Vignali et al. (2003b) Vignali, C., Brandt, W. N., & Schneider, D. P. 2003b, AJ, 125, 433
- Vignali et al. (2000) Vignali, C., Mignoli, M., Comastri, A., Maiolino, R., & Fiore, F. 2000, MNRAS, 314, L11
- Watanabe et al. (2004) Watanabe, C., Ohta, K., Akiyama, M., & Ueda, Y. 2004, ApJ, 610, 128
- Webster et al. (1995) Webster, R. L., Francis, P. J., Peterson, B. A., Drinkwater, M. J., & Masci, F. J. 1995, Nature, 375, 469
- Weingartner & Murray (2002) Weingartner, J. C., & Murray, N. 2002, ApJ, 580, 88
- Weymann et al. (1991) Weymann, R. J., Morris, S. L., Foltz, C. B., & Hewett, P. C. 1991, ApJ, 373, 23
- Wilkes et al. (2008) Wilkes, B. J., Pounds, K. A., & Schmidt, G. D. 2008, ApJ, 680, 110
- Wilkes et al. (2005) Wilkes, B. J., Pounds, K. A., Schmidt, G. D., Smith, P. S., Cutri, R. M., Ghosh, H., Nelson, B., & Hines, D. C. 2005, ApJ, 634, 183
- Wilkes et al. (2002) Wilkes, B. J., Schmidt, G. D., Cutri, R. M., Ghosh, H., Hines, D. C., Nelson, B., & Smith, P. S. 2002, ApJ, 564, L65
- Winter et al. (2009) Winter, L. M., Mushotzky, R. F., Reynolds, C. S., & Tueller, J. 2009, ApJ, 690, 1322
- Witt et al. (1997) Witt, H. J., Czerny, B., & Zycki, P. T. 1997, MNRAS, 286, 848
- Young et al. (2009) Young, M., Elvis, M., & Risaliti, G. 2009, ApJ in press (arXiv:0911.0474)
- Young et al. (2007) Young, S., Axon, D. J., Robinson, A., Hough, J. H., & Smith, J. E. 2007, Nature, 450, 74
- Zakamska et al. (2004) Zakamska, N. L., Strauss, M. A., Heckman, T. M., Ivezic, Z., & Krolik, J. H. 2004, AJ, 128, 1002
- Zamorani et al. (1981) Zamorani, G. et al. 1981, ApJ, 245, 357