MgII absorption systems with for a radio selected sample of 77 QSOs and their associated magnetic fields at high redshift111Based on observations made with ESO telescopes at the Paranal Observatory under Programme IDs 075.A-0841 and 076.A-0860
Abstract
We present a catalogue of MgII absorption systems obtained from high resolution UVES/VLT data of 77 QSOs in the redshift range , and down to an equivalent width . The statistical properties of our sample are found to be in agreement with those from previous work in the literature. However, we point out that the previously observed increase with redshift of for weak absorbers, pertains exclusively to very weak absorbers with . Instead, for absorbers with in the range 0.1–0.3 actually decreases with redshift, similarly to the case of strong absorbers. We then use this catalogue to extend our earlier analysis of the links between the Faraday Rotation Measure of the quasars and the presence of intervening MgII absorbing systems in their spectra. In contrast to the case with strong MgII absorption systems (), the weaker systems do not contribute significantly to the observed Rotation Measure of the background quasars. This is possibly due to the higher impact parameters of the weak systems compared to strong ones, suggesting that the high column density magnetized material that is responsible for the Faraday Rotation is located within about 50 kpc of the galaxies. Finally, we show that this result also rules out the possibility that some unexpected secondary correlation between the quasar redshift and its intrinsic Rotation Measure is responsible for the association of high Rotation Measure and strong intervening MgII absorption that we have presented elsewhere, since this would have produced an equal effect for the weak absorption line systems, which exhibit a very similar distribution of quasar redshifts.
Subject headings:
galaxies: high redshift – quasars: general – MgII systems: magnetic Fields — methods: data analysis1. Introduction
Quasar absorption line systems provide a unique tool to study the evolution of galaxies through their lifetime. Since the galaxies associated with such systems are selected by their gas cross section, as compared to their stellar luminosities from multi broad band imaging techniques, absorption lines provide us with a complementary view on galaxy properties and evolution. One of the best studied population of galaxies is the one selected by the MgII absorption doublet Å. Magnesium is produced by alpha-processes in post main sequence stars and, therefore, is abundant in galaxies. In addition, MgII doublet is easy to observe because it has a large cross section for absorption, it can be easily identified and the rest frame wavelengths Å are detectable from the ground over the full redshift range .
Depending on whether the equivalent width, of the MgII 2796 Å line is greater or smaller than , the absorption systems is classified as strong or weak, respectively. The fact that the equivalent width distribution appears to steepen below , lends support to the idea that weak and strong absorbers constitute two distinct populations. (Nestor et al. 2005, Narayanan et al. 2007).
It is well established that if there is strong MgII absorption line, then in almost all cases a galaxy is found within 100 kpc with a median impact parameter of around 50 kpc (Steidel et al. 1995, Churchill et al. 2005, Zibetti et al. 2007, Kacprzak et al. 2008, Chen Tinker 2008).
The MgII host galaxies are known to span a broad range of optical luminosities () and colors (Bergeron et al. 1986, Steidel 1995, Kacprzak et al. 2008). The gas traced by strong MgII absorption spans a wide range of neutral hydrogen column densities from to (Churchill et al. 2000, Rao et al. 2006). Recently Ménard & Chelouche 2008 found a strong correlation between the median and the MgII rest equivalent width .
However, the nature of the objects selected by weak MgII absorption is not yet completely clear. It has been suggested that they form a separate populations of galaxies with respect to those traced by strong absorbers, e.g. low surface brightness galaxies or dwarf galaxies (Churchill et al. 1999, Narayanan et al. 2007). Alternatively, the weak systems could be tracing the same galaxies as the strong absorbers, but at a higher QSO impact parameter where the gas density is much lower and, hence, the equivalent width smaller (Churchill et al. 2005, Kacprzak et al. 2008).
In this paper we present observations obtained with the Ultraviolet and Visual Echelle Spectrograph (UVES)(Dekker et al. 2000) at the VLT and the associated catalogue of strong and weak MgII absorption lines down to an equivalent width limit of , giving details of the selection criteria and the methods applied. We also construct the inferred number densities of MgII system and the observed equivalent width distribution and compare these with results published in the literature. Compared with most previous surveys for strong MgII absorption systems (Lanzetta et al. 1987, Steidel et al. 1992, Nestor et al. 2005, Nestor et al. 2006) we have a much higher spectral resolution, which allows us to identify the strong MgII systems unambigously.
In a previous paper we have used the catalogue of strong MgII absorbers presented in this paper to probe the magnetic fields in normal galaxies at redshift (Bernet et al. 2008). As we had already hypothetized in Kronberg et al. (2008) in order to eplain the observed increase in QSO RM as a function of the QSO redshift, in Bernet et al. (2008) we demonstrated that lines of sight with strong MgII absorption lines have significantly higher RM than those without. This implies the presence of G strong, large scale magnetic fields in the associated galaxies.
In this work we extend our analysis to weak MgII absorption systems with equivalent width in the range . We show that unlike their strong counterpart, weak absorbers do not contribute with any significance to the observed RMs. We discuss the possible interpretations of this result. We also show that this result argues against the case in which the correlation between RM and strong MgII absorption systems reported in Bernet et al. (2008) arises due to an intrinsic evolution of QSOs magnetic fields.
The paper is organized as follows: in Sec. 2 we present the MgII absorption system catalogue, including the details of the observations and data analysis; in Sec. 3 we analyze the statistical properties of the detected absorption systems and compare with previous work; Sec. 4 we investigate the correlation of the MgII system with RM; a short summary in Sec. 5 concludes the paper.
2. Optical Data
2.1. Spectra
Our dataset consists of 77 QSO spectra obtained with the high resolution UVES spectrograph at the VLT. The QSOs were selected from the larger sample of 901 radio sources with determined RM and redshifts presented in Kronberg et. al (2008). The selection was based on the following criteria: i) redshift range , ii) Galactic latitudes and iii) . The latter was imposed to have adequate S/N in exposures times up to 30 minutes per object. In order to produce a complete census of strong MgII absorption systems in the redshift range , we required a signal to noise ratio per resolution element S/N, across the full spectral range, although the data quality was typically better than that. To fully cover the redshift path to each QSO we chose the following standard setting of UVES, with dichroic 1 having central wavelengths 390nm and 580nm, and dichroic 2 having central wavelengths 437nm and 760nm for the blue and red arm, respectively. This results in complete wavelength coverage from 3480 to 9460 with only two small spectral gaps between 5762-5834 and 7513-7660 due to the small gap between the two CCDs of the red arm of UVES. We chose a slit width of corresponding to and in the blue arm and red arm respectively. The observations took place during 3 nights on 28-30 July 2006 (in visitor mode) and during 30 hrs of service mode observations carried out between October 2006 to April 2007.
2.2. Data reduction
The spectra were bias subtracted, flat-fielded and wavelength calibrated using the ESO MIDAS package in the OPTIMAL mode. The reduced 1 dimensional vacuum-heliocentric corrected exposures were first scaled to the same flux level and then co-added, weighted by the S/N of the corresponding pixel. The spectra were then normalized using a spline method to fit the continuum. To increase the S/N of the spectra the overlapping wavelength regions of different settings were also co-added.
To detect the absorption lines we used the so called “aperture” method (Lanzetta et al. 1987). Namely, we identified strong MgII absorption systems by requiring a 5 detection of the rest frame equivalent width of the MgII 2796 Å line. The absorption system was considered a MgII absorption identification if there was also at least a 2.5 detection of the corresponding 2803 Å line at the same redshift. We further checked if the doublet ratio, , of the MgII lines lay within the range from 1.0 for completely unsaturated lines and 2.0 for saturated lines (within errors). We also visually checked the line system for similar profile shapes to exclude chance alignments. MgII systems within 500 km of each other are considered as one single absorption system with the equivalent widths added together. We also visually inspected the flux spectra to look for MgII absorption lines that might have been missed by the alogrithm. This was twice the case, where the stronger Å line was detected as a single absorption line but the weaker Å line consisted of 2 separate lines, with miscalculated centroids.
| QSO | RA | Dec | |||||
|---|---|---|---|---|---|---|---|
| (J2000) | (J2000) | (Å) | (Å) | ||||
| (1) | (2) | (3) | (4) | (5) | (6) | (7) | (8) |
| PKS1244-255 | 0.638 | 12:46:46.8 | -25:47:49 | 0.49286 | 0.68 | ||
| OX-192 | 0.672 | 21:58:06.3 | -15:01:09 | 0.63205 | 1.40 | ||
| 4C+19.44 | 0.72 | 13:57:04.4 | +19:19:07 | 0.45653 | 0.85 | ||
| OC-65 | 0.733 | 01:41:25.8 | -09:28:44 | 0.50046 | 0.53 | ||
| 4C+19.34 | 0.828 | 10:24:44.8 | +19:12:20 | 0.52766 | 1.00 | ||
| PKS0420-01 | 0.915 | 04:23:15.8 | -01:20:33 | 0.63291 | 0.77 | ||
| 3C336a | 0.9274 | 16:24:39.1 | +23:45:12 | 0.47192 | 0.93 | 0.36811 | 0.19 |
| 0.65607 | 1.45 | 0.51742 | 0.13 | ||||
| 0.79707 | 0.46 | ||||||
| 0.89119 | 1.58 | ||||||
| PKS2354-11b | 0.96 | 23:57:31.2 | -11:25:39 | 0.54456 | 0.53 | 0.3715 | 0.10 |
| 0.40704 | 0.12 | ||||||
| 0.56496 | 0.24 | ||||||
| PKSB1419-272 | 0.985 | 14:22:49.2 | -27:27:56 | 0.55821 | 0.44 | 0.4319 | 0.26 |
| 4C+6.69 | 0.99 | 21:48:05.4 | +06:57:39 | 0.79086 | 0.55 | ||
| 4C+01.24 | 1.018 | 09:09:10.1 | +01:21:36 | 0.53587 | 0.44 | ||
| PKS0130-17 | 1.022 | 01:32:43.5 | -16:54:49 | 0.50817 | 0.59 | 0.82200 | 0.28 |
| 0.86895 | 0.28 | ||||||
| 4C-02.55 | 1.045 | 12:32:00.0 | -02:24:05 | 0.39524 | 2.03 | 0.83083 | 0.12 |
| 0.75689 | 0.30 | ||||||
| MRC0122-003 | 1.07 | 01:25:28.8 | -00:05:56 | 0.39943 | 0.47 | 0.9534 | 0.2 |
| PKS0506-61 | 1.093 | 05:06:43.9 | -61:09:41 | 0.92269 | 0.49 | ||
| PKS0426-380c | 1.11 | 04:28:40.4 | -37:56:20 | 0.55855 | 0.93 | ||
| 1.02886 | 0.57 | ||||||
| 3C208 | 1.11 | 08:53:08.8 | +13:52:55 | 0.65262 | 0.62 | ||
| 0.93537 | 0.40 | ||||||
| 4C+13.46 | 1.141 | 12:13:32.1 | +13:07:21 | 0.77189 | 1.29 | 0.37536 | 0.11 |
| PKS0038-020 | 1.178 | 00:40:57.6 | -01:46:32 | 0.68271 | 0.35 | 0.40701 | 0.21 |
| 1.00936 | 0.14 | ||||||
| PKS2204-54 | 1.206 | 22:07:43.7 | -53:46:34 | 0.6877 | 0.73 | 0.43723 | 0.29 |
| 0.97152 | 0.15 | ||||||
| 4C+06.41 | 1.27 | 10:41:17.1 | +06:10:17 | 0.44151 | 0.69 | 0.65536 | 0.07 |
| PKS0839+18 | 1.27 | 08:42:05.1 | +18:35:41 | 0.71118 | 0.56 | 0.63087 | 0.10 |
| PKS2326-477 | 1.299 | 23:29:17.7 | -47:30:19 | 0.43195 | 0.38 | ||
| 1.26074 | 0.66 | ||||||
| PKS1615+029 | 1.339 | 16:17:49.9 | +02:46:43 | 0.52827 | 0.31 | ||
| PKS0112-017 | 1.365 | 01:15:17.1 | -01:27:05 | 1.18965 | 0.90 | 0.95289 | 0.14 |
| PKS2223-05 | 1.404 | 22:25:47.2 | -04:57:01 | 0.84652 | 0.60 | ||
| PKS0402-362 | 1.417 | 04:03:53.7 | -36:05:02 | 0.79688 | 1.80 | ||
| PKS0332-403 | 1.445 | 03:34:13.7 | -40:08:25 | 1.20898 | 0.79 | ||
| OQ+135 | 1.611 | 14:23:30.1 | +11:59:51 | 1.36063 | 0.51 | 0.61474 | 0.12 |
| OX+57 | 1.932 | 21:36:38.6 | +00:41:54 | 0.62855 | 0.60 | 0.81024 | 0.1 |
| OW-174 | 1.932 | 20:47:19.7 | -16:39:06 | 1.32871 | 0.61 | 0.83407 | 0.22 |
| 1.34258 | 0.07 | ||||||
| PKS1143-245 | 1.95 | 11:46:08.1 | -24:47:33 | 1.24514 | 0.30 | 0.41966 | 0.16 |
| 1.52066 | 0.46 | 0.87633 | 0.07 | ||||
| 4C+5.81a | 1.967 | 21:53:24.7 | +05:36:19 | 1.88286 | 0.89 | ||
| PKS1157+014 | 1.986 | 11:59:44.8 | +01:12:07 | 1.94372 | 1.58 | 0.79082 | 0.09 |
| 1.3305 | 0.11 | ||||||
| PKS2353-68 | 2.77 | 23:56:00.7 | -68:20:03 | 1.26958 | 0.40 | 1.50565 | 0.13 |
| 1.85808 | 0.58 |
COLUMNS. - (1) Name of the source, (2) Redshift of the source, (3),(4) Coordinates, (5) Redshifts of the systems with strong MgII absorption, (6) Equivalent widths of the strong MgII absorption systems, (7) Redshifts of the systems with weak MgII absorption, (8) Equivalent widths of the weak MgII absorption systems
COMMENTS. - aSources were not included in the work of Bernet et al. 2008 because the optical and the radio emission are seperated by more than 5”. bSource was not included in the work of Bernet et al. 2008 due to MgII absorption local to the QSO at with . c This source was not used in Bernet et al. 2008 due to a misidentification.
| QSO | RA | Dec | |||
|---|---|---|---|---|---|
| (J2000) | (J2000) | (Å) | |||
| (1) | (2) | (3) | (4) | (5) | (6) |
| OC-192a | 0.616 | 01:57:41.6 | -10:43:40 | 0.42036 | 0.11 |
| 3C095 | 0.616 | 03:51:28.5 | -14:29:09 | 0.35717 | 0.12 |
| 3C037 | 0.672 | 01:18:18.5 | +02:58:06 | 0.39178 | 0.17 |
| OB-94 | 0.719 | 00:59:05.5 | +00:06:52 | 0.42816 | 0.08 |
| 0.48866 | 0.11 | ||||
| PKS1424-11 | 0.805 | 14:27:38.1 | -12:03:50 | 0.65781 | 0.25 |
| OC-259 | 0.837 | 01:37:38.3 | -24:30:54 | 0.46592 | 0.15 |
| PKS1111+149 | 0.869 | 11:13:58.7 | +14:42:27 | 0.64557 | 0.16 |
| PKS2340-036 | 0.896 | 23:42:56.5 | -03:22:26 | 0.421 | 0.16 |
| 0.68381 | 0.17 | ||||
| PKS2255-282a | 0.926 | 22:58:05.9 | -27:58:21 | 0.60402 | 0.26 |
| 0.84972 | 0.19 | ||||
| OM+133b | 1.040 | 11:22:29.7 | +18:05:26 | 1.00946 | 0.17 |
| 3C245 | 1.029 | 10:42:44.6 | +12:03:31 | 0.65969 | 0.16 |
| 4C11.69 | 1.037 | 22:32:36.4 | +11:43:51 | 0.73783 | 0.18 |
| 4C20.24 | 1.11 | 10:58:17.9 | +19:51:51 | 0.85629 | 0.13 |
| 4C-5.64 | 1.185 | 15:10:53.6 | -05:43:07 | 0.87758 | 0.13 |
| PKS2335-18 | 1.446 | 23:37:56.6 | -17:52:20 | 0.57337 | 0.27 |
| PKS0202-17 | 1.74 | 02:04:57.7 | -17:01:20 | 0.51833 | 0.2 |
| 4C-4.04c | 1.925 | 01:22:27.9 | -04:21:28 | 0.65744 | 0.29 |
| 0.71871 | 0.16 | ||||
| 0.91435 | 0.23 |
COLUMNS. - (1) Name of the source, (2) Redshift of the source, (3),(4) Coordinates, (5) Redshifts of the systems with strong MgII absorption, (4) Equivalent widths of the strong MgII absorption systems, (6) Redshifts of the systems with weak MgII absorption, (7) Equivalent widths of the weak MgII absorption systems
COMMENTS. - aSources show weak MgII absorption lines local to the QSOs. bSource was not included in the work of Bernet et al. 2008 due to MgII absorption local to the QSO at ,. cSpectra shows no strong intervening MgII absorption lines and was included in Bernet et al. 2008 but a recheck showed a broad MgII absorption system at with and should be therefore excluded from this work.
2.3. Completeness

To check the completeness of our catalogue, following Lanzetta et al. (1987) we calculated the redshift path of the survey for a certain equivalent width detection threshold . The redshift path is given by
| (1) |
where
is 1 if the MgII 2796,2803 doublet could have been detected at redshift z with a rest frame equivalent width greater or equal to at a significance level greater than , and zero otherwise. In eq. 2 , is the Heavyside function, and are the minimum and maximum redshift observed for the i-th QSO, that is 0.345 and the quasar redshift, , respectively. Also, is the Poisson error on the equivalent width per resolution element at redshift z.
| QSO | RA | Dec | |||
|---|---|---|---|---|---|
| (J2000) | (J2000) | (Å) | |||
| (1) | (2) | (3) | (4) | (5) | (6) |
| 3C281 | 0.602 | 13:07:54.0 | +06:42:14 | ||
| 4C-06.35 | 0.625 | 13:38:08.1 | -06:27:11 | ||
| PKS2243-123 | 0.63 | 22:46:18.2 | -12:06:51 | ||
| 4C+02.27 | 0.659 | 09:35:18.2 | +02:04:16 | ||
| 3C057 | 0.669 | 02:01:57.1 | -11:32:33 | ||
| OX-173 | 0.701 | 21:46:23.0 | -15:25:44 | ||
| 3C039 | 0.765 | 01:21:01.2 | +03:44:14 | ||
| PKS0414-06 | 0.775 | 04:17:16.7 | -05:53:45 | ||
| PKS0422-380 | 0.782 | 04:24:42.2 | -37:56:21 | ||
| 3C454.3 | 0.859 | 22:53:57.7 | +16:08:54 | ||
| ON+187 | 0.871 | 12:54:38.2 | +11:41:06 | ||
| 4C-00.50 | 0.89 | 13:19:38.7 | -00:49:40 | ||
| OD+094.7 | 0.893 | 02:59:27.1 | +07:47:40 | ||
| 4C+14.31a | 0.896 | 09:25:07.3 | +14:44:26 | ||
| 4C-3.79 | 0.901 | 22:18:52.0 | -03:35:37 | ||
| TXS0223+113 | 0.924 | 02:25:41.9 | +11:34:25 | ||
| 3C094 | 0.962 | 03:52:30.5 | -07:11:02 | ||
| OX-325 | 0.979 | 21:18:10.6 | -30:19:12 | 0.4271 | 0.04 |
| PKS1127-14 | 1.187 | 11:30:07.1 | -14:49:27 | ||
| 4C-5.62b | 1.249 | 14:56:41.4 | -06:17:43 | ||
| 4C+5.64 | 1.422 | 15:50:35.3 | +05:27:10 | ||
| 3C298b | 1.436 | 14:19:08.2 | +06:28:35 | 1.27336 | 0.06 |
| OD-055 | 1.45 | 02:35:07.4 | -04:02:06 | ||
| OK186 | 1.472 | 09:54:56.8 | +17:43:31 | ||
| PKS2227-08 | 1.559 | 22:29:40.1 | -08:32:54 | 0.63894 | 0.07 |
COLUMNS. - (1) Name of the source, (2) Redshift of the source, (3) Redshifts of the systems with weak MgII absorption, (4) Equivalent widths of the weak MgII absorption systems
COMMENTS. - aSource was not included in the work of Bernet et al. 2008 because the optical and the radio emission are seperated by more than 5”. Source shows MgII absorption local to the QSO at with . bSources show weak MgII absorption lines local to the QSOs.
The redshift path of the survey as a function of the equivalent width limit is shown in Figure 1. It can be seen that the redshift path begins to fall below 0.1 but is nearly constant above, showing that our sample has a high completness down to Å. Finally, the drop in at is because for the weak MgII systems we excluded spectral ranges known for atmospheric absorption from the search.
We miss only about of the total available redshift range between and the quasar redshifts (due to the two small spectral gaps). This leads to a high completness of the redshift coverage of at and at .
2.4. MgII Absorbers Catalogues
Our sample includes a total of 44 strong MgII absorption systems with mean redshift and a total redshift path of , and 44 weak MgII systems in the equivalent width range 0.1 - 0.3, with a redshift path of . The complete catalogue of detected strong MgII absorption systems is presented in Table 1. However, MgII absorption lines lying within 3000 km/s of the quasar redshift, i.e. arising in the environment local to the QSO, were excluded in any further analysis to maintain the sample of MgII host galaxies as homogenous as possible. When multiple systems of absorbers are detected along the line of sight to the same QSO, the equivalent width and redshift for each one of them is provided. When weak absorbers are present, they are also listed but in a separate column, with the caveat of both incompleteness and non-systematic search below for Å. Finally, a catalogue of weak absorbers with Å is presented in Table 2, and the remaining observed lines of sight are reported in Table 3.
2.5. Note on the QSO PKS 2353-68
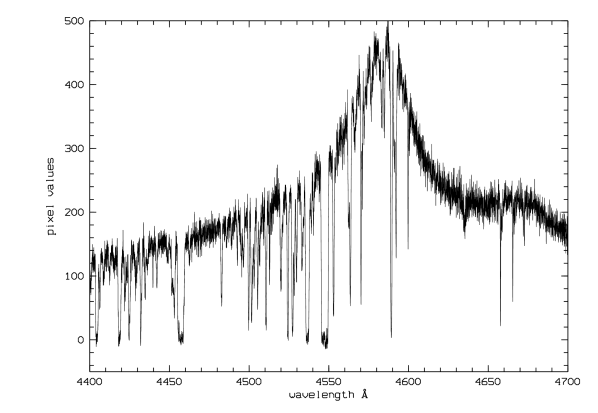
The high redshift QSO PKS 2353-68 is part of our sample and the optical spectra allowed us to make an independent estimate of its redshift, which disagrees with the value of from the Hewitt & Burbidge (1989) optical catalague. In fact, the radio emission of this QSO is centered on RA(1950): 23:53:22.9, Dec(1950): -68:36:46 (PKS catalogue, Gregory et al. 1994) and the optical spectrum associated to these coordinates shows broad Ly- emission at 4580 . This corresponds to a redshift , see Figure 2. Further investigation suggests that the object at reported by Hewitt & Burbidge is actually 115” away at RA(1950): 23:53:28.3, Dec(1950): -68:35:24 (Hewitt &Burbidge 1989).
3. MgII absobers statistic
3.1. Redshift number density
The number densities of strong MgII absorption systems, , is simply defined as
| (3) |
where is the number of absorbers in the redshift interval, . The errors on the number density is given by Poisson statistics, namely
| (4) |
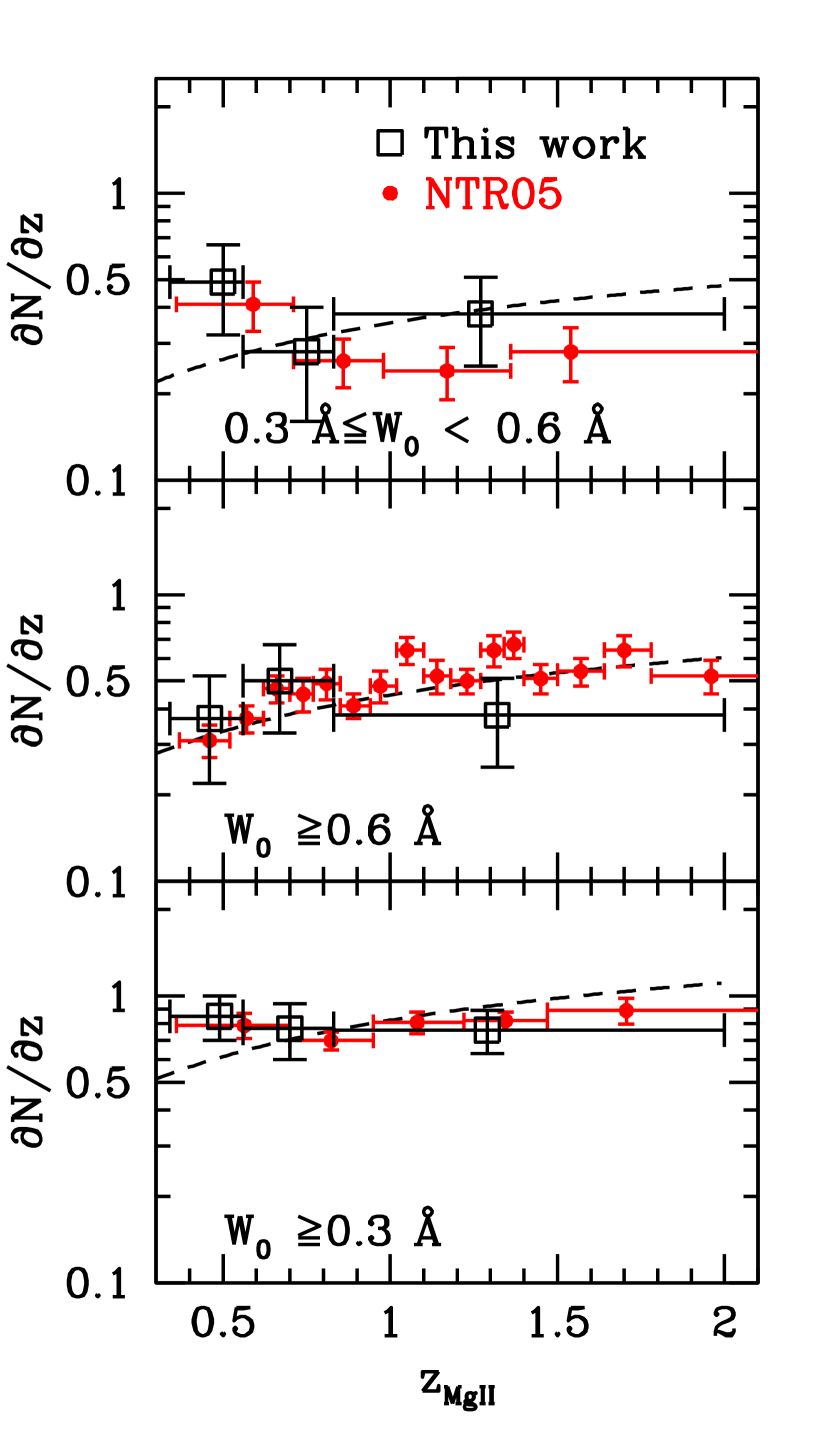
Figure 3 shows as measured from our data (black open squares) as a function of redshift, for three different values of the equivalent width, . Our results are found to be consistent with those of Nestor et al. (2005, NTR05) from the SDSS survey (red filled circles) in the redshift range . In particular, we find an almost constant at a mean redshift of , to be compared with at a mean redshift of , of NTR05 (see Table 4). Overplotted as dashed lines in Figure 3 are the redshift number densites for a concordance CDM universe with parameters (,,)=(0.27,0.73,0.7). In these no-evolution curves (NEC) we assume a constant comoving number density and a comoving cross sectional area proportional to . Note that in the equivalent width range the data also suggest an upturn of compared with the NEC in the lowest redshift bin which NTR05 sees at .
| THIS WORK | NTR05 | |||
|---|---|---|---|---|
| RANGE | ||||
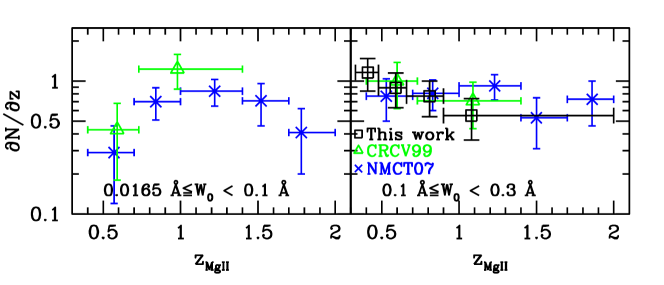
Turning to the weak MgII absorption systems in Fig. 4, we compare our results for with those of Churchill et al. 1999 (CRCV99), who looked for weak MgII absorption lines in HIRES/Keck spectra of 26 QSOs in the redshift range 0.4-1.4, and Narayanan et al. 2007 (NMCT07), who carried out a survey for weak MgII absorbers using UVES/VLT archive data of 81 QSOs in the redshift range 0.4-2.4. In both works the are given for the equivalent width range . Therefore to compare with our result in the equivalent width range we split their samples in 2 bins and recomputed the for the bins and . The evolution of as a function of redshift for these two bins is shown in Fig. 4 and the values of are summarized in Table 5.
| THIS WORK | CRCV99 | NMCT07 | ||||
|---|---|---|---|---|---|---|
| z RANGE | ||||||
| , | 0.59 | 0.57 | ||||
| , | 0.98 | 1.07 | ||||
| , | 0.60 | 0.53 | ||||
| , | 1.09 | 1.06 | ||||
NOTES.- Redshift number densities of weak MgII absorption systems for this work and the surveys of Churchill et al. 1999 (CRCV99) and Narayanan et al. 2007 (NMCT07). In these works are given for the equivalent width range . Values of given here for the two equivalent widths bins are computed values which assume the same redshift path for the two equivalent width ranges as for the whole range. This leads to small underestimates of in the equivalent width range and small overestimates of in the range ( 2-4 % in ).
Using the entire range of weak equivalent widths, both CRCV99 and NMCT07 found a significant increase in from redshift 0.4 to 1.4. However, after splitting in the two equivalent width bins reported in Fig. 4, we find that this behavior is dominated by systems in the equivalent width range . In this range increases from to from a mean redshift of to for the data of CRCV99(NMCT07).
In the equivalent width range and in the redshift range 0.4 - 1.4 we find that decreases towards higher redshifts from at a mean redshift to at . This finding is supported by our reanalysis of the CRCV99 data which gives a decrease of of at to at . The data of NMCT07 rather favor a flat with at and but the data are within the errorbars also still consistent with a decrease towards higher redshifts.
Assuming a power-law of the form for the redshift distribution of weak absorbers, a formal fit leads to best fit parameters and . Thus our observation suggest that for we see an upturn in the for analog to the one seen for the equivalent width range .
3.2. Equivalent width distribution
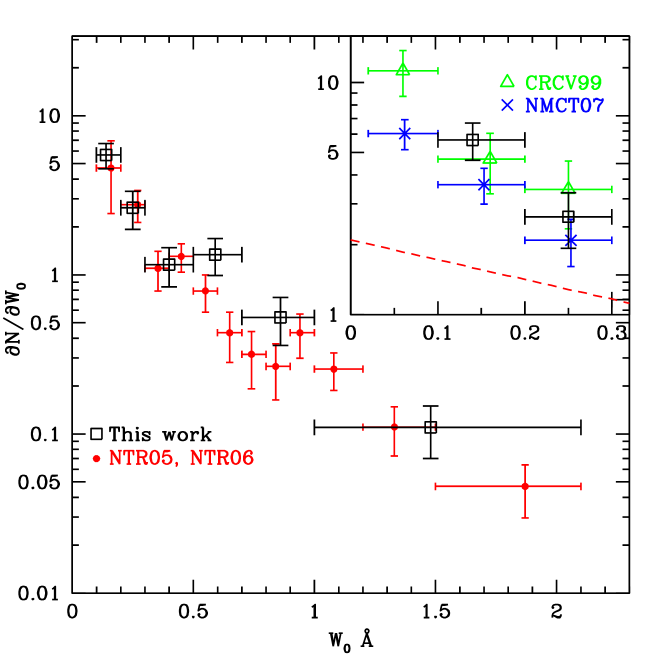
In Figure 5 the distribution of the rest-frame equivalent widths of the MgII systems is presented. Steidel Sargent 1992 (SS92) found that the number of MgII absorption systems with rest equivalent width per unit equivalent width per unit redshift can be either described by an exponential distribution of the form:
| (5) |
with free parameters and , or by a power law distribution of the form:
| (6) |
with free parameters and .
Using the Maximum-Likelihood method SS92 determined the parameters as , and , at a mean redshift of the absorbers of . However, they noted that an exponential distribution underpredicts the number of weak systems (here ), whereas a power law fit overpredicts the number of intermediate systems (here ).
Our Maximum Likelihood fit of a single exponential function to MgII systems with gives best fit parameters of and . This is in very good agreement with the tightly constraint parameters of NTR05 with and using over 1300 MgII doublets.
| THIS WORK | ||
|---|---|---|
| NRT05 | ||
| SS92 |
For the equivalent width range we can additionaly compare the with the results of CRCV99 and NMCT07 which both give the in the redshift range 0.4 - 1.4. Below the equivalent width distribution distinctly rises above the single exponential fit for as previously seen by Nestor et. al 2006 and NMCT07. This is further shown in the inset in Figure 5 where the red dashed line corresponds to the best fit to systems with by NTR05. Note that there is a slight discrepancy between NMCT07 and CRCV99, in that CRCV99 finds systematically more MgII systems in all 3 plotted equivalent width bins ([0.0165,0.1], [0.1,0.2], [0.2,0.3] ). For the lowest equivalent width bin, centered at , this is a the level of . Unfortunately we are unable to make a statement about the discrepancy because our redshift path falls dramatically in this equivalent width bin.
4. Rotation Measure data
4.1. Dependence of Rotation Measure distributions on equivalent width detection threshold
Bernet et al. (2008) showed that the Rotation Measure distribution function, for lines of sight with strong MgII absorption lines, is significantly broader than those without such lines. This led those authors to conclude that there must exist substantial magnetized plasma in or near the absorption line systems. It is unclear at this stage whether the association is direct, or whether the MgII absorption merely indicates that the quasar sightline passes throug a galactic halo. Regardless, this result suggests the presence of Gauss-level large-scale magnetic fields in or around typical galaxies when the Universe was a half or less of its current age, with important implications for our understanding of the development of magnetic fields in galaxies, and in particular setting interesting constraints on the required efficiency of the conventional galactic dynamo model.
Since our catalogue of MgII absorption systems is complete down to , we can now repeat the analyis of Bernet et al. 2008 and test their result versus the applied equivalent width detection threshold of MgII absorbers. This would clarify whether or not weak MgII systems also have large scale magnetic fields that contribute to the observed Rotation Measure.
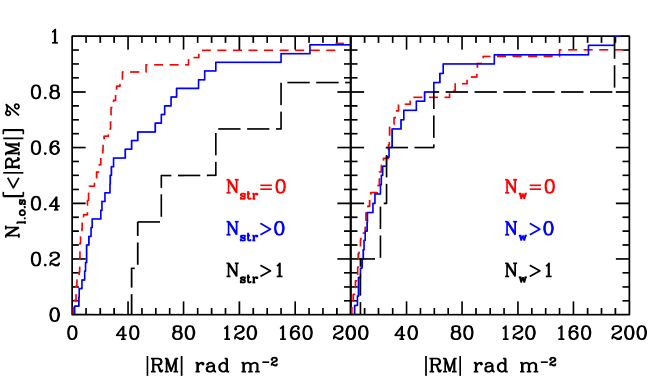
Figure, 6, compares the RM cumulative distribution functions having , and , where refers to the number of strong and weak MgII absorption lines for the left and right panel, respectively. The left panel is the result already presented in Bernet et al. (2008). For this panel, a Kolmogorov-Smirnov test indicates that the RM distributions for are different at the 94.5 significance level and those for at the 99.98 significance level. Given that we were testing a specific hypothesis in an clean way with completely independent observational data, we regard this result as significant. On the other hand, the right panel was built using the weak MgII absorbers catalogue of this paper (including here also the 8 systems below ) and the same RM data as in Bernet et al. (2008). Note that in this case , which does not account for the number of strong MgII absorption lines along the lines of sight. A KS-test does not recognize any difference in the RM distribution functions for with a significance level of 22.1 and 31.0 for . Since the RM distributions look statistically equivalent independent of the number of weak MgII absorption systems, it is immediately clear that the weak MgII absorption system contribution to the observed QSO RM must be negligible.
This result was also hinted at in observed redshift dependence of the RM distribution (see Kronberg et al. 2008). In that work, our analysis was based solely on the RM distribution of 268 quasars in the range , without any spectroscopic information. It was noted that the observed increase in the width of the RM distribution with redshift was better reproduced by a simple model in which the statistics of the intervenors was given by the relatively rare strong MgII systems than by one which included also the commoner weaker absorption systems. Due to the increased number of intervenors at low redshifts in this model, the increase in the width of the RM distribution already starts at which is not seen in the actual data, where the increase happens around .
4.2. Further evidence that strong MgII systems are responsible for the broadening of the RM distribution with z
As pointed out in Bernet et. al (2008), because the probability of intercepting a MgII absorber along the l.o.s increases strongly with the QSO redshift, a strong evolution of the magnetic fields, local to the QSOs could give rise to a fitticious correlation of with the number of strong MgII absorption lines. The evolution in the magnetic fields local to the QSOs would have to be significant, in order to produce the observed increase in RM dispersion with z despite the strong “k-correction” in the observed RM, due to the dependence of the RM.
By comparing the median of the distribution of l.o.s with and without strong MgII absorption for different QSO redshifts, Bernet et al. (2008) found that there is only a 7 chance probability that their result was due the above spurious correlation or, in general, to a correlation between redshift and .
Our new demonstration above that sightlines with weak MgII absorption do not show statistically enhanced values, can be used as an even more convincing test to rule out the possibility that an underlying correlation between and causes the observed RM broadening at high redshifts.

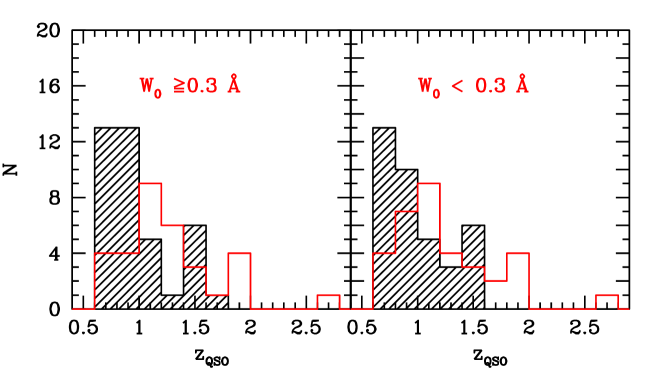
In the left-hand panel of Figure 7 the redshift distributions for the QSOs whose sightlines do and do not exhibit strong MgII absorption systems are shown as red and black shaded histograms. The same is shown on the right-hand panel for the weak MgII absorption systems. Apparently the QSO redshift distributions are very similar independent of whether the MgII absorption systems belongs to the weak or strong category. A KS-test reveals no difference between them with a significance level of for sightlines with weak and strong MgII absorption systems and for sightlines without weak or strong MgII absorption systems.
The cumulative distributions for different number of MgII systems in Figure 6 look, however, very different, depending on whether they are selected according to the presence of strong or weak MgII systems. There is a clear broadening of the distribution with increasing number of strong MgII absorption lines . However, there is virtually no difference in the distributions for different numbers of weak absorbers . This rules out the possibility that the correlation between and the number of strong MgII absorption lines observed in Bernet et. al (2008) is due to an underlying correlation between and .
Figure 8 shows further evidence that the broadening in the RM distribution with redshift is caused by the magnetic fields traced by strong MgII systems. The left-hand panel compares the cumulative RM distribution function for QSO from our entire sample with and . It clearly shows that the high redshift distribution function is broader with respect to the low redshift counterpart. This is most likely due to the fact that the chances of intercepting a MgII absorption systems are higher at higher redshifts. In fact, as we take out the lines of sight containing strong MgII absorbers, the two distributions do not show significant differences anymore (right panel). For the lines of sight without strong MgII absorbers, the median for both low () and high redshifts () is around 20 rad . This suggests that the l.o.s without strong MgII absorption systems (39 QSOs) are dominated by contributions from magnetic fields within the Milky Way, which is about 20 rad m-2 (Bernet et al. 2008).
Any extragalactic RM contributions which increase with z, e.g. intergalactic magnetic fields, envolving RM contributions local to the QSO, are probably swamped by the Galactic one. It is interesting to note that all 4 values with rad are at . This might be partially explained by the fact that a RM contribution local to a QSO at redshift is reduced by a factor when transformed to the observers frame. Thus (non-evolving) RM contributions local to the QSO might just fall below the Galactic contribution at significantly higher redshifts than 1.
4.3. Why do strong MgII systems contribute to the observed Rotation Measure and weak ones not?
In order to address the question of why weak absorbers do not contribute to the RM of distant QSOs, it is important to understand the nature of the weak MgII absorber systems. It has been proposed that these systems are associated with low surface brightness galaxies (Churchill Le Brun 1997), intergalactic star forming pockets (Rigby et al. 2002) or dwarf galaxies (Zonak et al. 2004). More recent works (Churchill et al. 2005, Kacprzak et al. 2007), however, indicate that for some fraction of the weak MgII systems a normal associated galaxy can be found. The impact parameters of the 7 weak MgII system where Churchill et al. 2005 have HST imaging range from 35 to 115 kpc. It still needs to be sorted out how this is consistent with the general picture that weak MgII systems are sub Lyman Limit systems.
The lack of quantitative knowledge about the fraction of weak MgII systems that can be associated with normal galaxies like the ones traced by the strong systems makes it hard to draw strong conclusions from our observation. We need to have a better knowledge about the differences in the impact parameter distribution of the galaxies traced by the strong and weak systems and their properties, e.g. luminosity, color. The work of Chen Tinker 2008 shows that the impact parameters of the galaxies traced by the weak absorbers are generally larger than those traced by the strong systems; they find a moderate anticorrelation between the equivalent width of the identified MgII systems and the impact parameters of the galaxies at the 97 level. An inspection of the impact parameters in Chen Tinker 2008 shows that the median impact parameters of the weak absorbers is around whereas for the strong absorbers.
It is thus plausible that the weak systems are preferentially produced by l.o.s through the outer regions of a galaxy. Since RM , with the density of free electrons and B the magnetic field along l.o.s, we also expect any RM contribution to decline quite rapidly with impact parameter. For strong absorption systems, it has been suggested that on average larger equivalent widths (i.e. stronger absorbers) correspond to galaxies with bluer spectra and smaller impact parameters (Zibetti et al 2007). If this trend was found to also extend to the weak absorbers, one could also attribute the presence of weaker magnetic fields in weak absorbers to the lower star formation activity there.
5. Summary
We have presented a catalogue of strong and weak MgII absorption systems with equivalent width down to 0.1 , obtained from a survey of 77 QSOs using the UVES spectrograph at the VLT. We determine the statistical properties of strong MgII systems and find them in good agreement with previous results. In particular, we confirm the upturn in at lower redshifts (z 0.6) for systems in the equivalent width range . Compared with no-evolution models in a CDM universe we find more MgII systems at lower redshifts.
Concerning the weak absorption systems, we point out that the previously observed increase with redshift of (CRCV99, NMCT07), pertains only to the very weak absorbers with . Instead, for absorbers with in the range 0.1–0.3 actually decreases, similarly to the case of strong absorbers.
We use this catalogue to extend our previous analysis of the connection between the presence of intervening absorption and the Faraday Rotation Measure of the quasar. We show that unlike strong MgII systems, weak MgII absorbers do not contribute to the observed Rotation Measure. This is likely due to the higher impact parameters of, and/or to lower star formation activity systems traced by, the weak absorbers with respect to strong ones. We use the lack of correlation of RM with number of weak MgII absorbers to rule out the possibility that the correlation of RM with number of strong MgII absorbers observed in Bernet et al. (2008) is due an underlying correlation of Rotation Measure with redshift, caused, for example, by strong evolution of magnetic field local to the QSOs environments.
We also show that, while the distribution of RM for QSOs above is distinctly broader than the corresponding distribution for QSOs with , the difference disappears once the lines of sight exhibiting MgII absorption are removed. This further shows that: (a) the increase in the width of the RM distribution with redshift is indeed caused by large scale magnetic fields traced by strong MgII systems and (b) that any further extragalactic RM contribution is most likely swamped by local Milky Way foreground contributions.
6. Acknowledgements
M.L.B. acknowledges financial support from the Swiss National Science Foundation. This research has made use of the NASA/IPAC Extragalactic Database (NED) which is operated by the Jet Propulsion Laboratory, California Institute of Technology, under contract with the National Aeronautics and Space Administration
References
- Bergeron & Stasińska (1986) Bergeron, J., & Stasińska, G. 1986, A&A, 169, 1
- Bernet et al. (2008) Bernet, M. L., Miniati, F., Lilly, S. J., Kronberg, P. P., & Dessauges-Zavadsky, M. 2008, Nature, 454, 302
- Chen & Tinker (2008) Chen, H.-W., & Tinker, J. L. 2008, ApJ, 687, 745
- Churchill & Le Brun (1997) Churchill, C. W., & Le Brun, V. 1997, Structure and Evolution of the Intergalactic Medium from QSO Absorption Line System, 378
- Churchill et al. (1999) Churchill, C. W., Rigby, J. R., Charlton, J. C., & Vogt, S. S. 1999, ApJS, 120, 51
- Churchill et al. (2000) Churchill, C. W., Mellon, R. R., Charlton, J. C., Jannuzi, B. T., Kirhakos, S., Steidel, C. C., & Schneider, D. P. 2000, ApJS, 130, 91
- Churchill et al. (2005) Churchill, C. W., Kacprzak, G. G., & Steidel, C. C. 2005, IAU Colloq. 199: Probing Galaxies through Quasar Absorption Lines, 24
- Dekker et al. (2000) Dekker, H., D’Odorico, S., Kaufer, A., Delabre, B., & Kotzlowski, H. 2000, Proc. SPIE, 4008, 534
- Gregory et al. (1994) Gregory, P. C., Vavasour, J. D., Scott, W. K., & Condon, J. J. 1994, ApJS, 90, 173
- Hewitt & Burbidge (1989) Hewitt, A., & Burbidge, G. 1989, ApJS, 69, 1
- Kacprzak et al. (2008) Kacprzak, G. G., Churchill, C. W., Steidel, C. C., & Murphy, M. T. 2008, AJ, 135, 922
- Kronberg et al. (2008) Kronberg, P. P., Bernet, M. L., Miniati, F., Lilly, S. J., Short, M. B., & Higdon, D. M. 2008, ApJ, 676, 70
- Lanzetta et al. (1987) Lanzetta, K. M., Wolfe, A. M., & Turnshek, D. A. 1987, ApJ, 322, 739
- Ménard & Chelouche (2008) Ménard, B., & Chelouche, D. 2008, arXiv:0803.0745
- Narayanan et al. (2007) Narayanan, A., Misawa, T., Charlton, J. C., & Kim, T.-S. 2007, ApJ, 660, 1093
- Nestor et al. (2005) Nestor, D. B., Turnshek, D. A., & Rao, S. M. 2005, ApJ, 628, 637
- Nestor et al. (2006) Nestor, D. B., Turnshek, D. A., & Rao, S. M. 2006, ApJ, 643, 75
- Peterson & Bolton (1972) Peterson, B. A., & Bolton, J. G. 1972, ApJ, 173, L19
- Rao et al. (2006) Rao, S. M., Turnshek, D. A., & Nestor, D. B. 2006, ApJ, 636, 610
- Rigby et al. (2002) Rigby, J. R., Charlton, J. C., & Churchill, C. W. 2002, ApJ, 565, 743
- Steidel & Sargent (1992) Steidel, C. C., & Sargent, W. L. W. 1992, ApJS, 80, 1
- Steidel (1995) Steidel, C. C. 1995, QSO Absorption Lines, 139 (Springer, Berlin,(1995))
- Zibetti et al. (2007) Zibetti, S., Ménard, B., Nestor, D. B., Quider, A. M., Rao, S. M., & Turnshek, D. A. 2007, ApJ, 658, 161
- Zonak et al. (2004) Zonak, S. G., Charlton, J. C., Ding, J., & Churchill, C. W. 2004, ApJ, 606, 196