A coincidence of disturbed morphology and blue UV colour: minor-merger driven star formation in early-type galaxies at
Abstract
We exploit multi-wavelength photometry of early-type galaxies (ETGs) in the COSMOS survey to demonstrate that the low-level star formation activity in the ETG population at intermediate redshift is likely to be driven by minor mergers. Splitting the ETGs into galaxies that show disturbed morphologies indicative of recent merging and those that appear relaxed, we find that % of the ETG population appears to be morphologically disturbed. While the relaxed objects are almost entirely contained within the UV red sequence, their morphologically disturbed counterparts dominate the scatter to blue UV colours, regardless of luminosity. Empirically and theoretically determined major-merger rates in the redshift range are several times too low to account for the fraction of disturbed ETGs in our sample, suggesting that minor mergers represent the principal mechanism driving the observed star formation activity in our sample. The young stellar components forming in these events have ages between 0.03 and 0.3 Myrs and typically contribute % of the stellar mass of the remnant. Together with recent work which demonstrates that the structural evolution of nearby ETGs is consistent with one or more minor mergers, our results indicate that the overall evolution of massive ETGs may be heavily influenced by minor merging at late epochs and highlights the need to systematically study this process in future observational surveys.
keywords:
galaxies: elliptical and lenticular, cD – galaxies: evolution – galaxies: formation – galaxies: interactions – ultraviolet: galaxies1 Introduction
The discovery of widespread recent star formation (RSF) in early-type galaxies (ETGs) has brought several changes to our traditional understanding of how this important class of astronomical objects has formed and evolved over time. A substantial literature on ETGs, based mainly on studies that use optical data, has convincingly established that the bulk of the stellar population in luminous early-types (particularly in clusters) have formed at high redshift (). Several pieces of observational evidence point to this fact, including the small intrinsic scatter in the early-type ‘Fundamental Plane’ (e.g. Jorgensen et al. 1996; Saglia et al. 1997; Forbes et al. 1998; Peebles 2002; Franx 1993; 1995; van Dokkum & Franx 1996), red optical colours (e.g. Bower et al. 1992; Bender 1997; Ellis et al. 1997; Stanford et al. 1998; Gladders et al. 1998; van Dokkum et al. 2000; Bernardi et al. 2003) and chemical evidence for relatively short ( Gyr) star formation timescales in these systems, deduced from the over-abundance of -elements (e.g. Thomas et al. 1999; Trager et al. 2000).
The star formation activity that has taken place in these galaxies over the latter half of the Universe (since ) is therefore appreciably weaker than the primordial bursts that built up the bulk of their stellar populations. A drawback of optical data is its relatively low sensitivity to small amounts of RSF. Young stellar populations, which are dominated by hot, massive, main-sequence stars, output a substantial fraction of their flux in the ultraviolet (UV) spectral ranges (shortward of Å). However, while the impact of low-level RSF on the optical spectrum is reasonably weak, a small mass fraction (a few percent) of young ( Gyr old) stars strongly affects the rest-frame UV (Kaviraj 2008). Furthermore, the UV remains largely unaffected by the age-metallicity degeneracy (Worthey 1994) that typically plagues optical analyses, making it a useful photometric indicator of RSF (Kaviraj et al. 2007).
In Figure 1, we demonstrate the sensitivity of the rest-frame UV to various mass fractions of young stars. Since our study will be based on intermediate-redshift () data drawn from the COSMOS survey (described in detail later in the text), we present the analysis in the context of the COSMOS and -band filters. For galaxies at , the observed colour traces the rest-frame colour, where represents the near-UV spectrum (Å). In Figure 1 we assume two instantaneous bursts of star formation, where the first burst is fixed at and the second burst is allowed to vary in age and mass fraction. The present-day colour of the composite stellar population (emitted at ) is plotted as a function of the age (symbol type) and mass fraction (x-axis) of the second burst. The figure indicates that even a small mass fraction (1%) of young stars ( Gyrs old) causes a significant change in the colour, compared to what might be expected from a purely old stellar population. It is this sensitivity that allows a robust identification of small, young stellar components that might be mixed in with the old, underlying stellar populations that dominate ETGs. Note that the UV flux fades relatively quickly (within 2 Gyrs) because the massive UV-producing stars are also short-lived. The stellar models used for this analysis are described in Yi (2003).
The properties of the rest-frame UV have recently been exploited in detail to study the presence of young stellar populations in ETGs at low and intermediate redshifts, an expected consequence of their evolution in the standard LCDM galaxy formation paradigm (Yi et al. 2005; Kaviraj et al. 2007; 2008; Schawinski et al. 2007). These studies have found that, in contrast to their optical colours, luminous early-types show a large spread in their UV colour distribution of almost 5 mags - a direct consequence of the sensitivity of the UV to small amounts of RSF demonstrated in Figure 1 above. The basic conclusion that can be drawn from these efforts is that, while the bulk of the stellar mass in the early-type population does indeed form at high redshift (), early-types of all luminosities form stars over the lifetime of the Universe, with luminous systems () forming up to 10-15% of their stellar mass after , with a tail to higher values. The persistent large scatter in the rest-frame UV colours indicates widespread low-level star formation in the early-type population over the last 8 billion years (Kaviraj 2008).
Recent work that combines spatially resolved 2D analyses using Hubble Space Telescope (HST) images with spectroscopic data are consistent with the findings from the rest-frame UV studies. The high signal-to-noise (S/N) of HST imaging in fields such as the Hubble Deep Fields and GOODS (Giavalisco et al. 2004), coupled with the superb angular resolution of the images ( arcsec/pixel), have revealed that a substantial fraction (%) of morphologically selected ETGs exhibit blue optical cores (Menanteau et al. 2001; Ferreras et al. 2005). Not unexpectedly, such blue cores are typically accompanied by emission and absorption lines characteristic of recent star formation (Ellis et al. 2001) and a comparison to models suggests that the accretion rates are typically % by mass over 1 Gyr. The number fractions of ETGs that carry signatures of blue cores and the mass fractions estimated to be forming in the RSF events are remarkably similar to the values found in studies that have used the rest-frame UV.
While unambiguous signatures of RSF have been found in the early-type population, the source of that star formation remains uncertain. RSF requires (cold) gas and there are several channels that could provide this gas supply e.g. internal mass loss from stellar winds and supernova (SN) ejecta, condensation from hot gas reservoirs and accretion of gas due to major or minor mergers. The principal aim of this paper is to study the role of mergers in driving the low-level recent star formation observed in the early-type population, with a view to exploring the overall contribution of this channel (and its components i.e. major vs minor mergers) compared to other plausible sources of RSF in early-type galaxies.
Before we begin, we briefly review recent work that has implications for the role of merging in the evolution of ETGs at low and intermediate redshift. While theory and observation both indicate that major mergers are central to the formation of spheroids (e.g. Toomre 1977; Bell et al. 2004; Faber et al. 2007), recent work has highlighted the potentially influential role of minor merging (where the mass ratios are 1:3) on ETG evolution at late epochs. Early work by Schweizer et al. (1990) and Schweizer & Seitzer (1992) showed that fine structure in nearby early-type galaxies, plausibly the result of recent minor interactions, was correlated with spectro-photometric evidence for RSF. More recently, Kaviraj et al. (2009) (see also Bezanson et al. 2009; Serra & Oosterloo 2010; Hopkins et al. 2010) have shown that the UV-optical properties of local ETGs can be reproduced purely by minor mergers between massive spheroids and gas-rich satellites, without recourse to the (much less frequent) major merger channel at present-day. In this work, numerical simulations of minor mergers are convolved with the expected frequency of such events in the standard model, to show that the predicted scatter in the UV and optical colours matches quantitatively with the observations. Note that, while minor mergers have been shown to be inefficient at triggering strong starbursts (e.g. Cox et al. 2008), the star formation induced in ETGs at late-epochs is at a low level, with the new stars forming a few percent or less of the mass of the remnant. Indeed, the simulations of Kaviraj et al. (2009) indicate that minor mergers are able to drive the requisite level of star formation in low-redshift ETGs. It is worth noting that the results of the Cox et al. study are consistent with those from Kaviraj et al. (2009), even though the assumed morphologies of the merger progenitors in the two sets of simulations are different. In particular, the mass fraction of new stars for merger mass ratios of around 1:10 is around 10% (see Eqn. 5 in Cox et al.), which is consistent with the RSF fractions reported in the recent literature (e.g. Kaviraj et al. 2007) and the mass fractions produced in the simulations of Kaviraj et al. (2009).
Using numerical simulations, Bournaud et al. (2007) and Naab et al. (2009) have demonstrated that repeated minor merging can lead to the formation of ETGs with morphological and kinematical properties that are consistent with those observed in local ETGs. The plausibility of these theoretical results is bolstered by the fact that minor mergers are predicted and observed to be more frequent than their major counterparts at late epochs (see e.g. Stewart et al. 2008; Jogee et al. 2009; López-Sanjuan et al. 2010; Darg et al. 2010). For example, Stewart et al. (2008; see their Fig 6) show that 17% of haloes with mass M⊙ have had a major merger (mass ratio 1:3) since , while the fraction of such haloes that have experienced a minor merger is 55%. Minor mergers appear to be a factor of 3 more frequent, consistent with similar observational estimates (e.g. Jogee et al. 2009; López-Sanjuan et al. 2010).
Indeed very deep optical imaging indicates that the fraction of local ETGs that carry morphological disturbances (e.g. van Dokkum 2005; Tal et al. 2009) and associated RSF (Kaviraj 2010b) is %. Given typical major merger timescales of Gyrs (e.g. Naab et al. 2006; Bell et al. 2006; Lotz et al. 2010), it is reasonable to suggest that the vast majority of local ETGs have experienced recent minor merging. The specific results on ETGs are consistent with an emerging literature which has demonstrated the diminishing impact of major merger activity on the evolution of massive galaxies in general at late epochs () and a corresponding increase in the significance of minor mergers. By considering close pairs and merger remnants, Robaina et al. (2009) studied the contribution of major mergers to the cosmic SFR at intermediate redshift (). They found that less than 10% of the star formation in massive galaxies at these redshifts are plausibly triggered by major interactions. Similar trends have been reported by Jogee et al. (2009) and López-Sanjuan et al. (2009) and, in a narrower redshift range, by Wolf et al. (2005) and Bell et al. (2005).
While local ETGs appear to show morphological disturbances accompanied by spectro-photometric signatures of RSF, it is important to establish and extend these results to higher redshift. The advantages of studies at higher redshift are that larger galaxy samples can be studied using the existing survey data and morphological peculiarities can be detected more efficiently using existing deep HST imaging at higher resolution than is possible with ground-based telescopes at low redshift. For example, the work of Kaviraj et al. (2009), which provides a strong plausibility argument for the role of minor mergers in ETG, has a largely theoretical basis, since standard Sloan Digital Sky Survey (SDSS; Adelman-McCarthy et al. 2008) images are not deep enough and lack the angular resolution to reveal morphological disturbances (see e.g. Kaviraj 2010a). In a similar vein, while a statistically significant correlation is found between disturbed morphologies and RSF in Kaviraj (2010b), this study is based on a small sample of 100 objects with very deep optical imaging. There is a clear need to push these local results to higher redshift, where the merger rates (Khochfar & Burkert 2001) and galaxy gas fractions (Rao 1994) are both expected to be higher and one would expect a stronger and clearer result than the studies in the local Universe.
The aim of this paper is, therefore, to probe the coincidence between morphological disturbances and the presence of RSF in the intermediate-redshift ETG population. To achieve these aims, we require (a) photometric data which traces the rest-frame UV spectral ranges (since the mass fractions of young stars are expected to be small) and (b) deep, high-resolution imaging that enables accurate visual morphological classification and identification of features typically generated by mergers (e.g. tidal tails and asymmetries). To this end we exploit publicly available data from the multi-wavelength COSMOS survey to explore the early-type population at intermediate redshifts (). A brief description of the COSMOS survey and the sample of galaxies that underpins this study is given in the next section. The main thrust of this work is two-fold. Firstly, we exploit the COSMOS -band filter to explore the rest-frame UV properties of ETGs in this field. Secondly, we specifically separate ETGs that are morphologically relaxed from those that carry signatures of recent merging and compare the rest-frame UV properties of these two sub-populations.
We note that a complication in the interpretation of excess UV flux in low-redshift () early-types is that the UV contributors may be both young and old. Extreme horizontal branch (EHB) stars and their progeny emit efficiently in the UV spectrum and are thought to be largely responsible for the ‘UV upturn’ phenomenon in some massive early-type galaxies (e.g. Yi et al. 1997; Yi et al. 1999; Yi 2003; but see Han et al. (2003) for an alternative source of UV upturn from sub-dwarf B and O stars). However, since the HB takes 8-9 Gyrs to develop, the UV flux in galaxies at (such as those in this study) will be negligibly affected by the HB, since the Universe would be too young for it to be in place. Hence, excess UV flux seen in early-type systems should be overwhelmingly from young stars. By placing this study at intermediate redshift we avoid having to disentangle the UV contributions of young and old stellar populations, making the rest-frame UV flux a rather clean photometric indicator of RSF.
This paper is structured as follows. In Section 2 we briefly describe the COSMOS dataset used in this study and the process of morphological classification. In Section 3 we compare the morphologies of early-type galaxies and their rest-frame UV properties. In Section 4 we use the multi-wavelength photometry provided by COSMOS to quantify the properties of the RSF (ages, mass fractions, metallicities and dust contents) in the early-type population. In Section 5 we discuss the various plausible sources of gas that could drive the residual star formation seen in ETGs, discuss the role of merging in this context and speculate on what the dominant RSF channel is likely to be in ETGs at late epochs. Finally, in Section 6 we summarise the results of this study. Cosmological parameters used for the background cosmology are taken from the three-year WMAP observations (Spergel et al. 2007): , , , .
2 Data
The Cosmological Evolution Survey (COSMOS; Scoville et al. 2007) is a deep, 2 deg2 panchromatic survey offering imaging data and photometry in 15 broadband filters between m (-band) and m (-band), taken using the Subaru 8.3m telescope, the KPNO and CTIO 4m telescopes, and the CFHT 3.6m telescope. The entire COSMOS field (centred at 10:00:28.6, +02:12:21) has been imaged by the HST Advanced Camera for Surveys (ACS) in the F814W (-band) filter.
This study is based on a publicly available -band selected multi-wavelength catalog, based on first release optical and near-infrared (NIR) data from COSMOS. In this paper, we combine multi-band photometry (Capak et al. 2007; C07 hereafter), with photometric redshifts (Mobasher et al. 2007; M07 hereafter) and HST images of COSMOS galaxies (Koekemoer et al. 2007). To calculate the photometric redshifts and absolute -band magnitudes M07 have convolved a library of template spectra, spanning the full range of local galaxy spectral types, through the COSMOS filter curves. This library is then shifted in redshift space and compared to the observed photometry of galaxies by minimising the function (see M07 for more details). The photometric redshifts have an accuracy of . For the purposes of this study, the accuracy offered by the photometric redshifts is sufficient and spectroscopic redshift measurements are not required. Finally, we note that the recommended photometric offsets in C07 have been applied to each filter and, where appropriate, total magnitudes have been calculated by applying the offsets between the measured 3” aperture magnitudes and total magnitudes that are provided in the public catalogue.
2.1 The sample
Our study is based on a parent sample of 4086 galaxies in the COSMOS field, brighter than a magnitude limit 22.3 with redshifts in the range 0.50.7. The mean redshift is . These magnitude and redshift ranges imply that our galaxies are brighter than and have stellar masses around M⊙ or greater (Mobasher et al. 2007). The magnitude and redshift selection was made to optimize the utility of rest-frame coverage (since, at 0.5, the optical -band filter samples 2500Å). As we describe in Section 2.2 below, the magnitude and redshift limits allow reliable classification of galaxy morphologies through visual inspection of the HST F814W images. Finally, at these epochs, we expect limited contamination of the UV flux by old HB stars, given that the maximum age of stellar populations in our chosen redshift range is 5 to 6.5 Gyrs (assuming star formation commenced around 3).
2.2 Morphological classification using visual inspection
Galaxy morphologies are classified in this study using direct visual inspection of the F814W images, which have a surface brightness limit of 27.2 mag arcsec-2 (Koekemoer et al. 2007). At the redshifts probed by this study this translates roughly into rest-frame Å(approximately rest-frame -band). Several methods have been developed recently that use automated parameters (e.g. concentration, asymmetry, clumpiness, M20 and the Gini coefficient) to separate the galaxy population into broad morphological classes (e.g. Abraham et al. 1996; 2003; Conselice et al. 2003; Lotz et al. 2004). The performance of these methods are typically calibrated against results from direct visual inspection, which offers better precision and reliability in the classification of galaxy morphologies (e.g. Lisker 2008; Robaina et al. 2009).
Several studies have exploited visual inspection to classify galaxy morphologies, at similar redshifts, magnitude limits and rest-frame wavelengths as those studied in this paper (see e.g. Elmegreen et al. 2005; Ferreras et al. 2005; Bundy et al. 2005; Cassata et al. 2005; Jogee et al. 2009; Robaina et al. 2009). For example, Bundy et al. (2005) have performed visual inspection using F850LP images for galaxies brighter than out to (in contrast to our sample which stops at ). Robaina et al. (2009) have used images in the F606W filter to classify galaxies in the redshift range , while Ferreras et al. (2005) have used F775W images to classify galaxies with (almost a magnitude fainter than our limit) out to .
Several authors (e.g. Dickinson 2000; Elmegreen et al. 2005; Wolf et al. 2005; Bell et al. 2005; Jogee et al. 2009) have noted that visually inspected morphologies from HST images are stable (at intermediate redshifts) across a wide range of imaging depths and wavelengths. For example, Wolf et al. (2005), Bell et al. (2005) and Jogee et al. (2009) suggest that morphological classification yields similar results in the redshift range , whether it is carried out using the F606W or F850LP filters. Furthermore, the results of classification using the relatively shallow imaging from the GEMS survey are very similar to the ones achieved using the (1.5 mags) deeper images from the GOODS survey. The images used for morphological classification in this study have been taken using the F814W filter (which is very close to F850LP) and which are 1 mag deeper than GEMS. Thus, based on the findings of studies discussed above, that have performed accurate visual inspection using both shallower and shorter wavelength images compared to this work, the classification results in this study should be robust.
Some further points are worth noting, given our specific interest in ETGs and, in particular, in the subset of ETGs that harbour morphological disturbances. Firstly, studies on low-redshift samples indicate that using automated methods (e.g. concentration) alone may result in some contamination of the ETG population by bulge-dominated systems such as face-on spirals (see e.g. Kaviraj et al. 2007). It is important that such contaminants are avoided in this study, since interlopers with blue UV colours would potentially skew our results. Visual inspection is the most reliable way to identify such contaminants, making this a vital part of our study. Secondly, in a related work, Cassata et al. (2005) have used visual inspection of HST images to split the galaxy population into ETGs and LTGs, sub-dividing the two populations into their relaxed and disturbed counterparts. They also show that automated parameters lack the sensitivity to separate relaxed ETGs from their disturbed counterparts - this distinction again requires visual inspection.
Finally, we briefly note the mass ratios of mergers that should be
identifiable using the F814W images used in this study.
Kawata et al. (2006) have shown that a ‘dry’ merger with a mass
ratio of 0.03 (i.e. roughly 1:30) creates tidal debris that is
visible in imaging with a surface brightness limit of 27 mag
arcsec-2 in the -band. The surface brightness of the tidal
features appear to be around 24-26 mag arcsec-2 (e.g. Figure
1 in this paper). Taking into account (1) the better throughput of
the F814W filter compared to the Cousins -band filter (
0.5 mags for a 9 Gyr population of solar metallicity) and (2) the
cosmological dimming between the mean redshift
() of the simulated galaxy in Kawata et al. and the mean
redshift () of our sample (1.2 mags), we find that
the F814W images are deep enough to detect such features (although
the detection of some of these features will be marginal). Given
that the strength of the tidal features typically increase with
the mass ratio of the merger (e.g. Feldmann
et al. 2008), mergers
with mass ratios greater than 1:30 should be visible in the COSMOS
images. Similarly, Feldmann
et al. (2008) have explored a larger set
of mergers with various mass ratios (1:1 to 1:10) between (1)
massive ETGs and small spheroids (similar in spirit to Kawata et
al.) and (2) massive ETGs and small disks. Figure 3 in this study
indicates that the surface brightnesses of tidal features produced
by such mergers vary in the range 23-25 mag arcsec-2.
Factoring in cosmological dimming (1.8 mags) between the
redshift of their synthetic images () and the mean
redshift of our sample () and the difference in the
filter throughputs between Cousins -band and F814W for an old
population, we conclude that merger remnants formed from
progenitors with mass ratios greater than 1:10 are very likely to
be visible in the COSMOS F814W images used in this study
(see also Jogee et al. 2009).
The visual inspection in this study splits the
galaxy
sample into three categories:
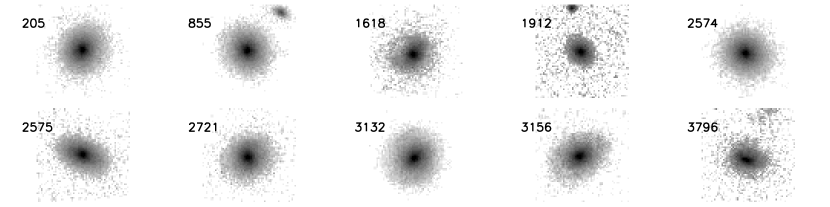
Relaxed ETGs
These are ETGs which appear to have no morphological disturbances
at the depth and resolution of the COSMOS HST images.
ETGs are identified from their smooth, centrally
concentrated light distributions and a lack of spiral structure.
Figure 2 shows examples of galaxies
classified as relaxed ETGs, across the entire magnitude range
considered in this study (). All galaxy images shown in
this section are 3” on a side. Note that a minority
of the galaxies classed as relaxed ETGs do show hints of
asymmetry, although the disturbances are not large enough for us
to confidently classify these objects as disturbed. We show three
examples of such objects: 1618, 3156 and 3796. These objects
typically reside in the UV blue cloud, suggesting that they may
indeed be disturbed but that the tidal features may be below the
surface brightness limit of the images or are not easily visible
due to the orientation of the galaxy. We discuss this issue
further in Section 5.1.
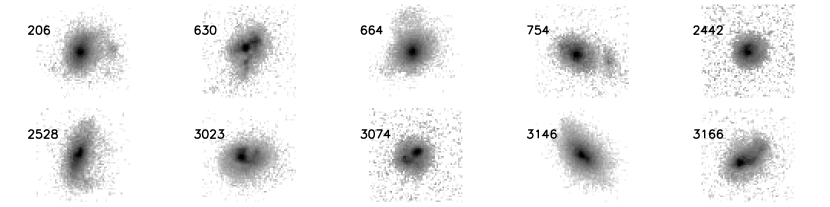
Disturbed ETGs
These are ETGs which either exhibit morphological disturbances
indicative of a recent merger or are in the process of undergoing
such a merger. Strictly speaking these objects are, to high
confidence, ETG progenitors, which will settle into
early-type morphology after signs of the merger disappear. Figure
3 shows typical examples of galaxies
classified as disturbed ETGs across the entire magnitude range
considered in this study (). Note that,
similar to their relaxed counterparts, objects in this category
have smooth, centrally concentrated light distributions in the
main body of the galaxy. While some of the objects have relaxed
cores and exhibit disturbances only in the outer regions of the
galaxy (e.g. 206 and 664), others appear to still be in the
process of assimilating material from a recent merger (e.g. 630,
2442, 3023 and 3074). Tidal tails are visible in 2528 and 3166.
While the main body of the disturbed ETGs resemble their relaxed
counterparts, they are all visibly asymmetric to different
degrees.
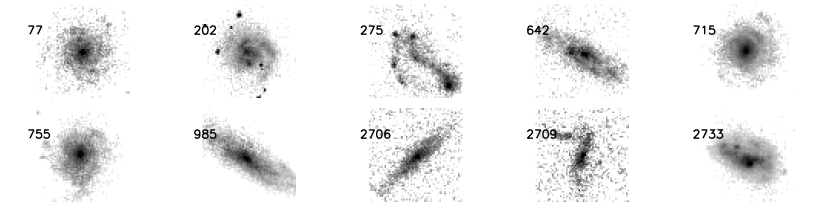
Late-type galaxies (LTGs)
These are objects that do not fall within the above categories. We
present examples of such objects in Figure 4.
We purposely show several examples of face-on spirals (77, 202,
715 and 755) that are most likely to be confused with early-type
galaxies in any method of morphological classification. It is
apparent that, within the magnitude range considered in this study
(), the high angular resolution of the HST images reveals
the internal structure in the face-on spirals, allowing them to be
differentiated from ETGs (in which the light distributions are
much smoother). This category includes relaxed spirals (such as 77
and 715), irregulars (such as 275 and 2709) and disturbed
late-types (such as 642 and 2733). For the purposes of this study
these subdivisions are collated since we are only interested in
objects that are either relaxed early-types or will eventually
settle into an early-type morphology after signs of the merger
disappear.
The classification itself is performed in two stages. First, each galaxy in the sample is visually inspected and assigned a classification. Colour or magnitude information is not used during this process to avoid biasing the results. This procedure is repeated until the numbers in the disturbed ETG category begin to converge i.e. the numbers in this category between classification runs are within 1% of each other. In our case, such convergence was achieved after 4 such runs.
In the second stage, we perform a ‘comparative check’ of the images. We tile 25 random galaxies at a time, in which 10 are relaxed ETGs or disturbed ETGs and the rest are LTGs. This step is performed as a final check of the classifications and to correct possible mistakes in marginal cases. It is potentially important because the fine structure that we are looking for in the disturbed ETGs is, in some cases, quite subtle and it is important to ensure consistency throughout the classification process. For example, in rare cases (3 objects) we found that an object originally labelled as a disturbed ETG - when inspected next to a set of relaxed ETGs - did not show enough morphological disturbance to warrant being called disturbed. In this case the classification was changed to a relaxed ETG. We did not find any cases where the converse was true, neither was any re-labelling required between the ETG and LTG categories.
The bulk of the classification effort was performed by SK, with subsets verified by RSE. For the relaxed ETG and disturbed ETG categories, the agreement between the classifiers was 99.1%. The fraction of galaxies brighter than that were identified as either relaxed or disturbed ETGs was , with the disturbed ETGs forming of this population. It is instructive to compare the results of our visual inspection for the ETG population to previous studies. At similar limits in redshift and magnitude, Bundy et al. (2005) found their ETG fraction to be 33%. Ferreras et al. (2005) found a similar number of 34%. Since the number density of massive ETGs is seen to remain stable since (Ferreras et al. 2009), it is useful to compare these values to similar work in the low-redshift Universe. Schawinski et al. (2007) visually inspected 48,023 galaxies from a volume-limited sample ( and ) from the SDSS and found 15,729 ETGs, giving an ETG fraction of 33%. Similarly Kaviraj (2010a) used the deep -band imaging in the SDSS Stripe82 and found an ETG fraction of 34% in the local Universe (). The Stripe82 images are 2 magnitudes deeper than the standard SDSS imaging. Thus, the range of values for the ETG fraction appears clustered around 33-34% at late epochs and our value of 35% compares very well with previous studies that have employed visual inspection, both in the local Universe and at intermediate redshifts.
Finally, it is worth comparing the fraction of disturbed ETGs (32%) found in this study to other similar works in the literature. Cassata et al. (2005) separate their ETG and LTG populations into their relaxed and disturbed subclasses. Their sample spans a much broader range of redshifts () than our study and the sample size is more than a factor of 10 smaller (300 objects as opposed to 4000 galaxies in our sample). Nevertheless, they find a disturbed ETG fraction of around 20% (the fraction of disturbed LTGs is 38%). Assuming counting errors this value could be between 16% and 28%. Noting that small tidal disturbances will become harder to discern at higher redshifts (because tidal features will be smaller and due to surface brightness dimming), one would expect a smaller disturbed ETG fraction in Cassata et al. (2005). Coupled with the range of values for the disturbed ETG fraction in this study (16-28%), our results seem consistent with this work. Jogee et al. (2009) suggest that 68% of massive galaxies (M 2.5 1010 M⊙) carry morphological disturbances indicative of a recent merger in the redshift range . Although their estimate is higher, we note that the look-back time sampled by Jogee et al. is 4 Gyrs as opposed to 1.5 Gyrs in this work, and that, while the massive galaxy population may be dominated by ETGs, Jogee et al. do not split their galaxy population by morphology. Both these factors would be expected to result in a higher value for the disturbed galaxy fraction. Finally, Kaviraj (2010a) found that the fraction of ETGs which carry morphological peculiarities in the local Universe is around 25%. The lower surface brightness limit of the Stripe82 images (26 mag arcsec-2), coupled with the declining merger rate (Khochfar & Silk 2006), suggests that the lower disturbed ETG fraction in Kaviraj (2010a) is not inconsistent with the findings of our study.
3 Morphology and rest-frame UV colours of the ETG population
We begin our analysis, in Figure 5, by presenting the colour-magnitude relations (CMRs) of our galaxy sample, split by their morphological types. Recall that the observed colours traces the rest-frame colour at these redshifts. Red circles indicate relaxed ETGs, blue circles represent disturbed ETGs and black dots indicate the rest of the galaxy population. Galaxies separate into a broad UV red sequence and blue cloud around .
In the top panel of Figure 5 we show the colours as a function of the observed -band magnitudes. The dashed line indicates the detection limit, based on the nominal -band filter depth (). The UV red sequence is detectable across almost the entire magnitude range of interest in this paper (). In the bottom panel of this figure we show the CMR as a function of the absolute -band magnitude of the galaxies.
The CMR indicates that the relaxed and disturbed ETGs are reasonably well-separated in the rest-frame UV colour. The separation is shown more explicitly in the top panel of Figure 6 which shows that, while the relaxed ETGs peak in the UV red sequence with a minor tail in the UV blue cloud (), the disturbed ETG population peaks in the UV blue cloud with a significant tail into the UV red sequence. Not unexpectedly, the late-type population is almost completely contained within the UV blue cloud. Note that this pattern persists if the galaxy population is split into luminosity bins.
The information in these colour distributions is summarised further in Figure 7. In the top panel we show the median colour of each morphological class in three luminosity bins. Note that the points are plotted at the mid-points of each luminosity bin. It is apparent that, regardless of luminosity, ETGs that carry morphological signatures of merging are at least 1.5 mags bluer than their relaxed counterparts in the rest-frame UV colour. Luminous () disturbed ETGs appear redder in the colour than late-types of comparable luminosity by mags, with the colours becoming comparable in the lowest luminosity bin ().
The bottom panel of this figure shows the fraction of each morphological class that lies on the UV red sequence (red lines) and the fraction that inhabits the UV blue cloud (blue lines). In the two highest luminosity bins () the relaxed ETGs (filled circles) lie almost exclusively on the UV red sequence. In the lowest luminosity bin the red fraction is lower (90%) but the overwhelming majority of relaxed ETGs still inhabit the red sequence.
In contrast, the disturbed ETG population resides mainly in the UV blue cloud, regardless of luminosity. In the two highest luminosity bins, 60% of the disturbed ETGs reside in the blue cloud with this fraction climbing to 86% in the lowest luminosity bin. The abrupt change in behaviour in the lowest luminosity bin (), both in terms of the median colour and the red/blue fractions, is most probably driven by incompleteness at the faint end of the red sequence. The top panel of Figure 5 indicates that the detection limit begins to encroach upon the red sequence population around , although it is worth noting that detections at fainter magnitudes do exist. However, it is possible that fewer red sequence objects are detected in the lowest luminosity bin, reducing the red fractions in all morphological types.
4 Quantifying the star formation histories
We proceed by quantifying the RSF history of the ETG population to explore the ages and mass fractions of the young stellar populations that are forming in the disturbed ETGs and study the differences between the relaxed ETGs and their disturbed counterparts. We estimate parameters governing the star formation history (SFH) of each galaxy by comparing its multi-wavelength COSMOS photometry to a library of synthetic photometry, generated using a large collection of model SFHs that are specifically designed for studying ETGs. The chosen parametrisation describes the broad characteristics of ETG SFHs with a minimum of free parameters. A key feature of the scheme is that the RSF episode is decoupled from the star formation that creates the bulk, underlying population.
Since the existing literature on ETGs demonstrates that the bulk of the stellar mass in these galaxies is metal-rich and forms at high redshift over short timescales (see introduction), we model the underlying stellar population using an instantaneous burst at high redshift. We put this first burst at and assume that it has solar metallicity. The RSF episode is modelled by a second instantaneous burst, which is allowed to vary in (a) age between 0.01 Gyrs and the look-back time corresponding to in the rest-frame of the galaxy (b) mass fraction between 0 and 1 and (c) metallicity between 0.05Z⊙ and 2.5Z⊙. In addition, we allow a range of dust values, parametrised by , in the range 0 to 0.5. The dust is applied to the model galaxy as a whole and the empirical law of Calzetti et al. (2000) is adopted to calculate the dust-extincted SEDs. The free parameters are the age (), mass fraction () and metallicity () of the second burst and the dust content () of the galaxy.
Note that putting the first burst at , or even , does not affect our conclusions about the RSF, because the first burst does not contribute to the UV, which is dominated by hot, massive main sequence stars with short lifetimes. The UV decays after around a Gyr (and has almost completely disappeared after 2 Gyrs) as the UV-producing stars come to the end to their lifetimes. Recall that the highest redshift being sampled in this study is which corresponds to an age of 5 Gyrs if star formation begins at in a standard cosmology. It is worth noting that our parametrisation is similar to previous ones used to study elliptical galaxies at low redshifts using UV/optical photometry (e.g. Ferreras & Silk 2000a) and spectroscopic line indices (e.g. Trager et al. 2000).
To build a model library of synthetic photometry, each combination of the free parameters is combined with the stellar models of Yi (2003) and convolved with the correct COSMOS ()111Note that the -band filter is from the CFHT Mega-Prime instrument, the filters are from the Subaru Suprime-Cam instrument and the filter is from the KPNO FLAMINGOS instrument. filtercurves. The library contains individual models. Since our galaxy sample spans a range in redshift, equivalent libraries are constructed at redshift intervals in the redshift range . Note that the stellar models assume a Salpeter (1955) initial mass function.
For each ETG in our sample, parameters are estimated by choosing the model library that is closest to it in redshift and comparing its () photometry to every model in the synthetic library. The likelihood of each model () is calculated using the value of , computed in the standard way. The error in is computed by adding, in quadrature, the observational uncertainties in the COSMOS filters with errors adopted for the stellar models, which we assume to be 0.05 mags for each optical filter and 0.1 mags for the filter (see Yi 2003). From the joint probability distribution, each free parameter is marginalised to extract its one-dimensional probability distribution function (PDF). We take the median value of the PDF to be the best estimate of the parameter in question. The 25th and 75th quartile values provide an estimate of the uncertainties in these estimates. This procedure yields, for every galaxy in our sample, a best estimate and error for each free parameter. Note that the accuracy of the photometric redshifts provided in the catalogue is sufficient for accurate parameter estimation. Past experience suggests that, given the degeneracies within the parameter space, the added accuracy of spectroscopic redshifts does not change the derived distributions of parameter values in such a study.
It is worth noting that the presence of (Type II) AGN will not affect our analysis of the UV colours or the derived values of the RSF parameters (our sample does not contain quasars). The contamination from a Type II AGN is likely to be less than around 15% in UV flux (Salim et al. 2007), which translates to around 0.15 mags in the () colour, much smaller than the observed spread (around 4 mags) in the UV colour-magnitude relation (see Figure 5 above). Previous work on ETGs using UV/optical data at low redshift indicates that blue ETG colours are not restricted to galaxies hosting emission line AGN (Schawinski et al. 2007). The same analyses also show that the quality of the SED fitting is equally good in galaxies which carry emission-line signatures of AGN and those that do not show any signs of AGN, indicating that there is no measurable contribution from a power-law component in the UV and optical spectrum. Finally, a study of the GALEX (Martin et al. 2005) UV images of nearby AGN hosts indicates that the UV emission is extended, making it unlikely that it comes from a central source (Kauffmann et al. 2007). In summary, the parameter estimation performed in this study is immune to the presence of a Type II AGN.
In the top panel of Figure 8 we present the space for the ETG population studied in this paper. Relaxed ETGs are shown using filled circles and disturbed ETGs are shown using crosses. Galaxies are colour-coded according to their colours. We find that the RSF ages in the disturbed ETGs are typically between Gyrs and Gyrs. Not unexpectedly, the relaxed ETG population, which predominantly resides on the UV red sequence, tends to occupy high values of . However, it is worth noting that, within errors, the values of in the top panel of Figure 8 indicate that some relaxed ETGs, especially those that are bluer than , are likely to contain intermediate-age (1-3 Gyr old) stellar populations. In other words, while their photometry does not indicate the presence of RSF, it is also inconsistent with their entire stellar populations forming at high redshift. Such objects are therefore likely to host intermediate-age stellar components.
The mass fractions formed in the RSF events are typically less than 10% (with a small tail to higher values). Note that the median estimate for the mass fraction typically has a large error (more than half a decade). The reason for these large uncertainties becomes apparent if we refer back to Figure 1, which shows the evolution of the colour as a function of the RSF mass fraction at a given RSF age. For all RSF ages, increasing the mass fraction beyond a threshold value of 10-20% does not produce any further significant changes in the colour. This is because, beyond a point, the spectral energy distribution (SED) becomes dominated by the young stellar component, so that increasing its mass fraction further only changes the normalisation of the SED but not its shape (which determines the colours). Hence, the same colour can be consistent with a large range of mass fractions, producing a large degeneracy in the mass fraction values. Note, however, that the colour evolves rapidly with age regardless of mass fraction, making the rest-frame UV a more robust indicator of the RSF age () than the RSF mass fraction ().
In the bottom panel of this figure we present the remaining free parameters in the analysis: the metallicity of the RSF and the dust extinction applied to the galaxy. Similar to red early-types at low redshift, the relaxed ETG population is typically dust-poor, with values less than 0.1. Not unexpectedly, the bulk of the disturbed ETGs are dustier (), since their star-forming regions (which dominate the UV fluxes) are gas-rich and therefore expected to also contain dust. An interesting result is that the RSF metallicities are typically sub-solar but reasonably high, suggesting that the gas that forms the young stars could already be metal-enriched. Recall that the metallicity grid spans a wide range of values (0.05-2.5Z⊙) and very low metallicities are included in the grid.
5 What dominates the star formation in the ETG population at late epochs?
The preponderance of disturbed ETGs in the UV blue cloud indicates that merger-induced star formation plays an important role in driving the residual star formation activity observed in the ETG population. Luminous ETGs, such as the ones studied here, could either have undergone equal mass mergers (major mergers) or experienced satellite accretion where the mass ratios are typically smaller than 1:3 (generically referred to as minor mergers).
Empirically determined major merger rates (e.g. Patton et al. 2000; Le Fèvre et al. 2000; Patton et al. 2002; Conselice et al. 2003; Lin et al. 2004; Bell et al. 2006; Lotz et al. 2006; Conselice 2007; Conselice et al. 2009; Bundy et al. 2009; Jogee et al. 2009) indicate that major merger activity in galaxies with masses such as the ones considered in this paper becomes infrequent after . It is worth noting that while all of these works have carefully explored the frequency of equal-mass mergers, some discrepancy remains in the reported values for the major merger rate, possibly driven by different selection techniques and cosmic variance. While some studies (e.g. Bell et al. 2006; Lotz et al. 2006; Conselice 2007) indicate that each massive galaxy undergoes 0.5 major mergers after , i.e. only 50% of the massive galaxy population undergoes a major merger since , other efforts (e.g. Lin et al. 2004; López-Sanjuan et al. 2009) suggest a lower value (%). Similarly, Jogee et al. (2009) find that 16% of massive galaxies in the redshift range have undergone a major merger. Given the uncertainty in these estimates it is important to compare them to those derived from cosmological simulations. The study of Stewart et al. (2008) indicates that the fraction of massive haloes (with masses between 1012 and 1013 M⊙) that have undergone a major merger (mass ratios 1:3) since is around 20% (left-hand panel of Fig. 5 or right-hand panel of Fig. 6 in this paper). The observations bracket this value, with the theoretical estimates being closer to the Lin et al. (2004) and López-Sanjuan et al. (2009) studies. The fraction of ETGs that could be remnants of major mergers in the redshift range probed by this study () can be estimated as:
| (1) |
where ( Gyrs) is the time elapsed between and , 7.71 Gyrs is the look-back time to , ‘0.4 Gyrs’ is the visibility timescale of a major merger (e.g. Naab et al. 2006; Bell et al. 2006; Lotz et al. 2010) and is the fraction of galaxies that have experienced a major merger since . We find that adopting (e.g. Bell et al. 2006; Lotz et al. 2006; Conselice 2007; Conselice et al. 2009) implies a major merger contribution of % to the disturbed ETG population studied in this paper, while adopting from Lin et al. (2004) yields a negligible value of %. It is apparent that even the higher value for the major merger contribution (%) is not sufficient to satisfy the observed disturbed ETG fraction (%) found in our galaxy sample. Recall from above that the theoretical estimates of the major merger rate (e.g. Stewart et al. 2008) are lower than , so that the major merger contribution could well be lower than %.
Since the mass fractions formed in these events are typically small, it is likely that any major mergers that do take place do not lead to significant star formation. This suggests, in agreement with recent theoretical work (Khochfar & Silk 2009), that the progenitors of major mergers at late epochs are either both early-type (and therefore reasonably gas-poor) or that at most one progenitor is a late-type galaxy. It is worth noting that recent theoretical studies have shown that even major mergers involving gas-rich progenitors are not particularly efficient at driving significant star formation (e.g. Kapferer et al. 2005; Di Matteo et al. 2007; 2008; Cox et al. 2008; Robaina et al. 2009). However, the results of Kaviraj et al. (2009) indicate that the bluest ETGs in the UV CMR are compatible with merger mass ratios between 1:4 and 1:6. While this does suggest that major mergers are unlikely to dominate the blue ETG population, the reader is cautioned that a major-merger origin for some of the blue ETGs cannot be completely ruled out.
Since morphological disturbances do typically accompany UV blue colours, and there are too many disturbed ETGs than can be accounted for by major mergers alone, our results point towards minor mergers contributing the bulk of the RSF in the ETG population at late epochs, with at least 60% (and perhaps % if the Lin et al. (2004) value is more representative) of the disturbed ETGs having experienced a minor merger i.e. the accretion of a small gas-rich satellite onto a massive spheroid.
It is worth noting that the scatter in UV/optical colours of the ETG population persists over the last 8 billion years (Kaviraj et al. 2008). Since each RSF event is expected to remain ‘visible’ due to blue UV colours for Gyr (after which the UV decays rapidly), it is reasonable to suggest that ETGs, on average, may experience several such (minor merger) events over their lifetimes. The contribution from major mergers is almost certainly larger at higher redshifts () and plausibly declines at later epochs, although consensus on the actual rate of that decline requires more investigation (see e.g. Bundy et al. 2009).
As we briefly noted in the introduction several works in the recent literature, that have explored various aspects of massive galaxy or specifically ETG evolution at late epochs, support our findings and highlight the potentially significant impact of minor merging on the evolution of the ETG population. In a direct parallel to our conclusions, Naab et al. (2009) have used hydrodynamical simulations to demonstrate that, even though major mergers do occur, the evolution in the size and density profiles of luminous early-type galaxies is likely to be driven by repeated minor merging at late epochs (). A similar result has been determined from an observational viewpoint by Bezanson et al. (2009), albeit for a mass range that is higher than the population studied here (M⊙).
Several efforts aimed at correlating the rate of major mergers with the evolution of massive galaxies indicate that the observed major merger rate at late epochs appears insufficient to satisfy the evolution in the number densities of massive galaxies since (Bundy et al. 2007; Bundy et al. 2009) and that the contribution of major merger activity to the cosmic star formation rate is small (e.g. Robaina et al. 2009; Jogee et al. 2009). While environmental processes may induce morphological transformations in regions of high density (see e.g. Kawata & Mulchaey 2008; Rasmussen et al. 2008; and references therein), the paucity of major mergers may indicate that the buildup of the field ETG population (as studied here) is significantly influenced by minor merging, since these events are capable of producing remnants that resemble present-day early-type galaxies (Naab et al. 2009; Bournaud et al. 2007).
The kinematic properties of early-types in our local neighbourhood provide further clues on the impact of minor mergers. Results from the SAURON project (de Zeeuw et al. 2002), which has used integral field spectroscopy to perform a systematic study of the stellar and gas kinematics in a representative sample of 48 early-types in the local Universe, indicates that 75% of early-types are ‘fast rotators’222This value is probably closer to 90%, based on results from the ATLAS project, which is the successor to SAURON and based on a complete sample of ETGs within the local 40 Mpc volume (Emsellem et al. 2010, in prep.; Roger Davies and Martin Bureau, priv. comm.). The survey homepage can be found here: http://www-astro.physics.ox.ac.uk/atlas3d/ i.e. their stellar velocity fields show a clear large-scale rotation pattern. Since stellar disks are easily perturbed in major mergers, even in the presence of moderate amounts of gas (Naab et al. 2006), the properties of the fast rotators indicate that the overwhelming majority of the SAURON ETGs have experienced one or more minor mergers up to (Emsellem et al. 2007).
While this study provides an explicit link between star formation activity and minor mergers, taken together with the aforementioned parts of the literature, it is reasonable to conclude that the evolution in both structural properties and star formation activity and consequently the overall evolution of the ETG population at late epochs may be significantly influenced by minor mergers.
5.1 Faint morphological disturbances in the relaxed ETGs?
We should note that the detection of morphological disturbances depends on the surface brightness limit of the images. The advantages of deeper imaging have been revealed in a recent study by van Dokkum (2005; VD2005 hereafter), who used very deep optical imaging (to a limiting surface brightness mags arcsec-2) to study local galaxies on the optical red sequence. VD2005 found widespread signatures of recent merging in a large fraction (70%) of their ETG sample, which are invisible in shallower imaging from e.g. the SDSS survey (see also Tal et al. 2009). It is likely, therefore, that many of the galaxies that are classified as relaxed ETGs (regardless of their UV colour) harbour tidal disturbances that are fainter than the surface brightness limit of the COSMOS images used in this study.
For example, as we noted in Section 2.2, the visual classification identifies some relaxed ETGs in the UV blue cloud (see objects 1618, 3156 and 3796 in Figure 2). Object 3796 might have a slightly elongated core compared to the other relaxed ETGs, suggesting that it may be in the very last stages of a recent merger. Similarly, there is a hint that object 1618 may exhibit some low surface brightness disturbances in the north western part of the galaxy which may be more readily visible in deeper imaging. While the putative features in these galaxies are too faint for us to confidently classify them as disturbed ETGs, it is reasonable to suggest that many of the relaxed ETGs (regardless of whether they have red or blue colours) might harbour unseen morphological disturbances that are too faint to be detected in the COSMOS images.
5.2 Alternative drivers of star formation in ETGs?
While our results present a strong case for the RSF in the ETG population to be driven by merging activity, it is instructive to study other potential sources of gas that might contribute to the observed star formation.
A potential source of cold gas comes from internally recycled material, injected into the interstellar medium (ISM) through stellar winds and supernovae. Up to 30% of the IMF could be expected to return over the lifetime of a stellar population (e.g. Ferreras & Silk 2000b) and some or all of this gas could be expected to fuel star formation. However, Kaviraj et al. (2007; see their Section 6) have suggested that the recycled gas mass at late epochs is almost an order of magnitude too low to produce early-type galaxies in the blue cloud. This is supported by detailed spatial studies of (ionised) gas in ETGs using integral field spectroscopy in the SAURON project (e.g. Sarzi et al. 2006), which indicate that the kinematics of the gas is typically decoupled from the stellar field, indicating, at least in part, an external origin. Crucially, RSF caused by internally recycled gas would not alter the morphology of the galaxy. Hence, in the context of this study, if the RSF was indeed driven by this channel, one would expect many relaxed ETGs in the UV blue cloud, something that is clearly not observed. Therefore, it is reasonable to suggest that internally recycled gas is not the primary driver of RSF in the ETG population at intermediate redshifts.
A second possible route to driving star formation, without recourse to mergers, is through condensation of gas from hot gas reservoirs (the galactic equivalent of a ‘cooling flow’). This mechanism will only operate in the most luminous ETGs (specifically the central galaxies in the central of large potential wells such as clusters), since their moderate and low luminosity counterparts do not have hot gas envelopes (e.g. Fabbiano 1989; Mathews & Brighenti 2003). However, the total mass of hot gas in massive ETGs typically forms a small fraction (a few percent or less) of the stellar mass of these systems (e.g. Bregman et al. 1992; O’Sullivan et al. 2003; Mathews & Brighenti 2003). Recalling that the RSF mass fractions are themselves around % or less and form within a few tens of Myrs at most, it is difficult to envisage a substantial fraction of the hot gas reservoir cooling over such timescales to produce the observed RSF. Furthermore, as in the argument against internally recycled gas, one would expect condensation-driven RSF to leave the morphology of the galaxy unchanged, so that we would see a reasonably large number of relaxed ETGs in the UV blue cloud, which is not observed.
Finally, it should also be noted that some contribution from cold flows (e.g. Kereš et al. 2005; Birnboim & Dekel 2003; Birnboim et al. 2007) cannot be completely ruled out. Numerical simulations indicate that the contribution of cold flows is largest in the high-redshift Universe. Accretion of gas through filaments onto central galaxies is seen to become inefficient at , while the process continues to affect satellite galaxies in haloes until , with mergers becoming the dominant process driving star formation thereafter (Khalatyan et al. 2008). As with the mechanisms discussed above, star formation driven by filamentary cold flows would not induce strong morphological disturbances in the main body of the galaxy. However, while the vast majority of disturbed ETGs in our sample show clearly disturbed morphologies, some systems, e.g. 3074 in Figure 3, exhibit a mild morphological disturbance in the main body of the galaxy but may show some evidence for asymmetric gas accretion. Given the redshift of our galaxy sample () and the fact that the disturbed ETGs typically carry significant morphological disturbances, cold flows are unlikely to be the main driver of RSF in ETGs at these epochs. Nevertheless, their contribution to some of the star formation cannot be completely ruled out.
6 Summary and conclusions
We have exploited rest-frame UV and optical photometry of intermediate-redshift () early-type galaxies (ETGs) in the COSMOS survey to demonstrate that the low-level star formation activity in these systems is likely to be dominated by minor mergers. is the closest redshift at which the COSMOS -band filter traces the rest-frame near-UV (NUV) spectrum (Å). Selecting galaxies as near as possible also maximises the accuracy of eyeball morphological classifications and minimises morphological -corrections. Furthermore, placing the study at redshifts greater than ensures that the UV flux in the early-type population comes exclusively from young stars. Potential contributions to the UV from old horizontal branch stars and their progeny do not exist at these redshifts because the Universe is not old enough for the HB to have developed.
Visual inspection of the COSMOS HST images has been used to split the ETG population into galaxies which show morphological signatures of recent merging and those that are relaxed in the COSMOS HST images. The disturbed ETGs form % of the ETG population. The relaxed ETGs are almost completely contained within the UV red sequence (). At luminosities greater than , less than 5% of relaxed ETGs occupy the UV blue cloud, while at fainter luminosities the fraction residing in the UV blue cloud rises marginally to 10%. In contrast, the morphologically disturbed ETGs favour the UV blue cloud at all luminosities. At luminosities greater than , more than 50% of the disturbed ETGs reside in the UV blue cloud (), while at lower luminosities the fraction is substantially higher (85%). This abrupt change in the blue fraction at lower luminosities may be partly affected by incompleteness on the UV red sequence. At a given luminosity, the disturbed ETGs are at least 1.5 mags bluer in their rest-frame UV colours than their relaxed counterparts. Most importantly, at all luminosities, the scatter to blue colours in the early-type population is dominated by the disturbed ETG population. The recent star formation (RSF) in the disturbed ETGs typically has ages between Myrs and Myrs and contributes less than 10% of the mass fraction of the remnants.
The general lack of relaxed ETGs in the UV blue cloud argues against the RSF being driven by either internal mass loss or condensation from hot gas reservoirs, since these processes are not expected to perturb the morphology of the galaxies. The preponderance of disturbed ETGs in the UV blue cloud indicates that merging plays a dominant role in driving the star formation activity in these galaxies. Empirically and theoretically derived major merger rates suggest that the frequency of major merging in galaxies with masses similar to the ones considered here is too low to fully account for the significant fraction of disturbed ETGs. While major mergers play a lesser role, minor mergers between massive spheroids and small gas-rich satellites are likely to be responsible for at least 60% (and possibly %) of the disturbed ETG population at intermediate redshift. As we noted in Section 5 above, the large scatter in the UV/optical colours and associated star formation in the ETG population persists over the redshift range , which corresponds to 8 Gyrs in look-back time. Since the UV signatures of any given RSF event is expected to decay after 2 Gyrs or less, it is reasonable to suggest that ETGs, on average, may experience several minor merger events over their lifetimes. Since several studies have suggested that the evolution in the structural properties of ETGs are also consistent with minor merging, we have argued that our results, taken together with the recent literature, suggests that the overall evolution of the ETG population over the last 60% of the lifetime of the Universe may be significantly influenced (or perhaps even driven) by minor mergers.
Despite recent interest (e.g. Jogee et al. 2009; López-Sanjuan et al. 2010; and this paper), minor mergers remain a largely unexplored topic in the modern galaxy evolution effort. Pair studies, on which much of our understanding of merging is based, require a spectroscopic detection of both progenitors in a galaxy pair, since the relative velocity is part of the pair criterion. The population of pairs that can be extracted from a particular survey therefore depends critically on the spectroscopic limit of the survey in question. While major mergers are easily identified, minor mergers are harder to detect because the smaller progenitor is often fainter than the spectroscopic limit of the survey. The accumulating evidence for the significance of minor mergers calls for deep spectroscopic surveys in the future that would allow statistical studies of minor merging to be conducted, so as to quantify the impact of this potentially important process on the evolution of the galaxy population, especially in the redshift range .
Acknowledgements
The anonymous referee is gratefully acknowledged for a thorough report which significantly improved the original manuscript. SK acknowledges an Imperial College Junior Research Fellowship, a Research Fellowship from the Royal Commission for the Exhibition of 1851, a Senior Research Fellowship from Worcester College, Oxford and support from the BIPAC institute at Oxford. Some of this work was supported by a Leverhulme Early-Career Fellowship (SK). RSE acknowledges support from the Royal Society. Roger Davies, Kevin Bundy, Martin Bureau, Chris Conselice, Jerry Sellwood and Sukyoung Yi are thanked for interesting discussions and useful comments. Some of this research utilised the undergraduate computing facilities in the Department of Physics at the University of Oxford.
References
- Abraham et al. (1996) Abraham R. G., Tanvir N. R., Santiago B. X., Ellis R. S., Glazebrook K., van den Bergh S., 1996, MNRAS, 279, L47
- Abraham et al. (2003) Abraham R. G., van den Bergh S., Nair P., 2003, ApJ, 588, 218
- Adelman-McCarthy et al. (2008) Adelman-McCarthy J. K., Agüeros M. A., Allam S. S., et al. 2008, ApJS, 175, 297
- Bell et al. (2006) Bell E. F., Naab T., McIntosh D. H., et al. 2006, ApJ, 640, 241
- Bell et al. (2005) Bell E. F., Papovich C., Wolf C., et al. 2005, ApJ, 625, 23
- Bell et al. (2004) Bell E. F., Wolf C., Meisenheimer K., et al. 2004, ApJ, 608, 752
- Bender (1997) Bender R., 1997, in ASP Conf. Ser. 116: The Nature of Elliptical Galaxies; 2nd Stromlo Symposium Structure; Formation and Ages of Elliptical Galaxies. pp 11–+
- Bernardi et al. (2003) Bernardi M., Sheth R. K., Annis J., et al. 2003, AJ, 125, 1882
- Bezanson et al. (2009) Bezanson R., van Dokkum P. G., Tal T., Marchesini D., Kriek M., Franx M., Coppi P., 2009, ApJ, 697, 1290
- Birnboim & Dekel (2003) Birnboim Y., Dekel A., 2003, MNRAS, 345, 349
- Birnboim et al. (2007) Birnboim Y., Dekel A., Neistein E., 2007, MNRAS, 380, 339
- Bournaud et al. (2007) Bournaud F., Jog C. J., Combes F., 2007, A&A, 476, 1179
- Bower et al. (1992) Bower R. G., Lucey J. R., Ellis R., 1992, MNRAS, 254, 589
- Bregman et al. (1992) Bregman J. N., Hogg D. E., Roberts M. S., 1992, ApJ, 387, 484
- Bundy et al. (2005) Bundy K., Ellis R. S., Conselice C. J., 2005, ApJ, 625, 621
- Bundy et al. (2009) Bundy K., Fukugita M., Ellis R. S., Targett T. A., Belli S., Kodama T., 2009, ApJ, 697, 1369
- Bundy et al. (2007) Bundy K., Treu T., Ellis R. S., 2007, ApJ, 665, L5
- Calzetti et al. (2000) Calzetti D., Armus L., Bohlin R. C., Kinney A. L., Koornneef J., Storchi-Bergmann T., 2000, ApJ, 533, 682
- Capak et al. (2007) Capak P., Aussel H., Ajiki M., et al. 2007, ApJS, 172, 99
- Cassata et al. (2005) Cassata P., Cimatti A., Franceschini A., et al. 2005, MNRAS, 357, 903
- Conselice (2007) Conselice C. J., 2007, in Combes F., Palous J., eds, IAU Symposium Vol. 235 of IAU Symposium. pp 381–384
- Conselice et al. (2003) Conselice C. J., Bershady M. A., Dickinson M., Papovich C., 2003, AJ, 126, 1183
- Conselice et al. (2009) Conselice C. J., Yang C., Bluck A. F. L., 2009, MNRAS, 394, 1956
- Cox et al. (2008) Cox T. J., Jonsson P., Somerville R. S., Primack J. R., Dekel A., 2008, MNRAS, 384, 386
- Darg et al. (2010) Darg D. W., Kaviraj S., Lintott C. J., et al. 2010, MNRAS, 401, 1043
- de Zeeuw et al. (2002) de Zeeuw P. T., Bureau M., Emsellem E., et al. 2002, MNRAS, 329, 513
- Di Matteo et al. (2008) Di Matteo P., Bournaud F., Martig M., Combes F., Melchior A., Semelin B., 2008, A&A, 492, 31
- Di Matteo et al. (2007) Di Matteo P., Combes F., Melchior A., Semelin B., 2007, A&A, 468, 61
- Dickinson (2000) Dickinson M., 2000, in Astronomy, physics and chemistry of H Vol. 358 of Royal Society of London Philosophical Transactions Series A, The first galaxies: structure and stellar populations. pp 2001–+
- Ellis et al. (2001) Ellis R. S., Abraham R. G., Dickinson M., 2001, ApJ, 551, 111
- Ellis et al. (1997) Ellis R. S., Smail I., Dressler A., Couche W. J., Oemler A. J., Butcher H., Sharples R. M., 1997, ApJ, 483, 582
- Elmegreen et al. (2005) Elmegreen D. M., Elmegreen B. G., Rubin D. S., Schaffer M. A., 2005, ApJ, 631, 85
- Emsellem et al. (2007) Emsellem E., Cappellari M., Krajnović D., et al. 2007, MNRAS, 379, 401
- Fabbiano (1989) Fabbiano G., 1989, AR&A, 27, 87
- Faber et al. (2007) Faber S. M., Willmer C. N. A., Wolf C., et al. 2007, ApJ, 665, 265
- Feldmann et al. (2008) Feldmann R., Mayer L., Carollo C. M., 2008, ApJ, 684, 1062
- Ferreras et al. (2005) Ferreras I., Lisker T., Carollo C. M., Lilly S. J., Mobasher B., 2005, ApJ, 635, 243
- Ferreras et al. (2009) Ferreras I., Lisker T., Pasquali A., Khochfar S., Kaviraj S., 2009, MNRAS, 396, 1573
- Ferreras & Silk (2000a) Ferreras I., Silk J., 2000a, ApJL, 541, L37
- Ferreras & Silk (2000b) Ferreras I., Silk J., 2000b, MNRAS, 316, 786
- Forbes et al. (1998) Forbes D. A., Ponman T. J., Brown R. J. N., 1998, ApJ, 508, L43
- Franx (1993) Franx M., 1993, PASP, 105, 1058
- Franx (1995) Franx M., 1995, in van der Kruit P. C., Gilmore G., eds, IAU Symp. 164: Stellar Populations Measuring the Evolution of the M/L Ratio from the Fundamental Plane. pp 269–+
- Giavalisco et al. (2004) Giavalisco M., Ferguson H. C., Koekemoer A. M., et al. 2004, ApJ, 600, L93
- Gladders et al. (1998) Gladders M. D., Lopez-Cruz O., Yee H. K. C., Kodama T., 1998, ApJ, 501, 571
- Han et al. (2003) Han Z., Podsiadlowski P., Maxted P. F. L., Marsh T. R., 2003, MNRAS, 341, 669
- Hopkins et al. (2010) Hopkins P. F., Bundy K., Hernquist L., Wuyts S., Cox T. J., 2010, MNRAS, 401, 1099
- Jogee et al. (2009) Jogee S., Miller S. H., Penner K., et al. 2009, ApJ, 697, 1971
- Jorgensen et al. (1996) Jorgensen I., Franx M., Kjaergaard P., 1996, MNRAS, 280, 167
- Kapferer et al. (2005) Kapferer W., Knapp A., Schindler S., Kimeswenger S., van Kampen E., 2005, A&A, 438, 87
- Kauffmann et al. (2007) Kauffmann G., Heckman T. M., Budavári T., et al. 2007, ApJS, 173, 357
- Kaviraj (2010a) Kaviraj S., 2010a, MNRAS, 406, 382
- Kaviraj (2010b) Kaviraj S., 2010b, arXiv:1007.4810
- Kaviraj et al. (2008) Kaviraj S., Khochfar S., Schawinski K., et al. 2008, MNRAS, 388, 67
- Kaviraj et al. (2009) Kaviraj S., Peirani S., Khochfar S., Silk J., Kay S., 2009, MNRAS, 394, 1713
- Kaviraj et al. (2007) Kaviraj S., Schawinski K., Devriendt J. E. G., et al. 2007, ApJS, 173, 619
- Kawata & Mulchaey (2008) Kawata D., Mulchaey J. S., 2008, ApJ, 672, L103
- Kawata et al. (2006) Kawata D., Mulchaey J. S., Gibson B. K., Sánchez-Blázquez P., 2006, ApJ, 648, 969
- Kereš et al. (2005) Kereš D., Katz N., Weinberg D. H., Davé R., 2005, MNRAS, 363, 2
- Khalatyan et al. (2008) Khalatyan A., Cattaneo A., Schramm M., Gottlöber S., Steinmetz M., Wisotzki L., 2008, MNRAS, 387, 13
- Khochfar & Burkert (2001) Khochfar S., Burkert A., 2001, ApJ, 561, 517
- Khochfar & Silk (2006) Khochfar S., Silk J., 2006, MNRAS, 370, 902
- Khochfar & Silk (2009) Khochfar S., Silk J., 2009, MNRAS, pp 816–+
- Koekemoer et al. (2007) Koekemoer A. M., Aussel H., Calzetti D., et al. 2007, ApJS, 172, 196
- Le Fèvre et al. (2000) Le Fèvre O., Abraham R., Lilly S. J., et al. 2000, MNRAS, 311, 565
- Lin et al. (2004) Lin L., Koo D. C., Willmer C. N. A., et al. 2004, ApJ, 617, L9
- Lisker (2008) Lisker T., 2008, ApJS, 179, 319
- López-Sanjuan et al. (2010) López-Sanjuan C., Balcells M., Pérez-González P. G., Barro G., Gallego J., Zamorano J., 2010, ArXiv e-prints
- López-Sanjuan et al. (2009) López-Sanjuan C., Balcells M., Pérez-González P. G., Barro G., García-Dabó C. E., Gallego J., Zamorano J., 2009, A&A, 501, 505
- Lotz et al. (2010) Lotz J. M., Jonsson P., Cox T. J., Primack J. R., 2010, MNRAS, 404, 575
- Lotz et al. (2006) Lotz J. M., Madau P., Giavalisco M., Primack J., Ferguson H. C., 2006, ApJ, 636, 592
- Lotz et al. (2004) Lotz J. M., Primack J., Madau P., 2004, AJ, 128, 163
- Martin et al. (2005) Martin D. C., Fanson J., Schiminovich D., et al. 2005, ApJ, 619, L1
- Mathews & Brighenti (2003) Mathews W. G., Brighenti F., 2003, AR&A, 41, 191
- Menanteau et al. (2001) Menanteau F., Abraham R. G., Ellis R. S., 2001, MNRAS, 322, 1
- Mobasher et al. (2007) Mobasher B., Capak P., Scoville N. Z., et al. 2007, ApJS, 172, 117
- Naab et al. (2006) Naab T., Jesseit R., Burkert A., 2006, MNRAS, 372, 839
- Naab et al. (2009) Naab T., Johansson P. H., Ostriker J. P., 2009, ApJ, 699, L178
- O’Sullivan et al. (2003) O’Sullivan E., Ponman T. J., Collins R. S., 2003, MNRAS, 340, 1375
- Patton et al. (2000) Patton D. R., Carlberg R. G., Marzke R. O., Pritchet C. J., da Costa L. N., Pellegrini P. S., 2000, ApJ, 536, 153
- Patton et al. (2002) Patton D. R., Pritchet C. J., Carlberg R. G., et al. 2002, ApJ, 565, 208
- Peebles (2002) Peebles P. J. E., 2002, in ASP Conf. Ser. 283: A New Era in Cosmology pp 351–+
- Rao (1994) Rao S. M., 1994, PhD thesis, Pittsburgh Univ.
- Rasmussen et al. (2008) Rasmussen J., Ponman T. J., Verdes-Montenegro L., Yun M. S., Borthakur S., 2008, MNRAS, 388, 1245
- Robaina et al. (2009) Robaina A. R., Bell E. F., Skelton R. E., et al. 2009, ApJ, 704, 324
- Saglia et al. (1997) Saglia R. P., Colless M., Baggley G., et al. 1997, in Arnaboldi M., Da Costa G. S., Saha P., eds, ASP Conf. Ser. 116: The Nature of Elliptical Galaxies; 2nd Stromlo Symposium The EFAR Fundamental Plane. pp 180–+
- Salim et al. (2007) Salim S., Rich R. M., Charlot S., et al. 2007, ApJS, 173, 267
- Salpeter (1955) Salpeter E. E., 1955, ApJ, 121, 161
- Sarzi et al. (2006) Sarzi M., Falcón-Barroso J., Davies R. L., et al. 2006, MNRAS, 366, 1151
- Schawinski et al. (2007) Schawinski K., Kaviraj S., Khochfar S., et al. 2007, ApJS, 173, 512
- Schawinski et al. (2007) Schawinski K., Thomas D., Sarzi M., Maraston C., Kaviraj S., Joo S., Yi S. K., Silk J., 2007, MNRAS, 382, 1415
- Schweizer & Seitzer (1992) Schweizer F., Seitzer P., 1992, AJ, 104, 1039
- Schweizer et al. (1990) Schweizer F., Seitzer P., Faber S. M., Burstein D., Dalle Ore C. M., Gonzalez J. J., 1990, ApJ, 364, L33
- Scoville et al. (2007) Scoville N., Aussel H., Brusa M., et al. 2007, ApJS, 172, 1
- Serra & Oosterloo (2010) Serra P., Oosterloo T. A., 2010, MNRAS, 401, L29
- Spergel et al. (2007) Spergel D. N., Bean R., Doré O., et al. 2007, ApJS, 170, 377
- Stanford et al. (1998) Stanford S. A., Eisenhardt P. R. M., Dickinson M., 1998, ApJ, 492, 461
- Stewart et al. (2008) Stewart K. R., Bullock J. S., Wechsler R. H., Maller A. H., Zentner A. R., 2008, ApJ, 683, 597
- Tal et al. (2009) Tal T., van Dokkum P. G., Nelan J., Bezanson R., 2009, AJ, 138, 1417
- Thomas et al. (1999) Thomas D., Greggio L., Bender R., 1999, MNRAS, 302, 537
- Toomre (1977) Toomre A., 1977, in Tinsley B. M., Larson R. B., eds, Evolution of Galaxies and Stellar Populations pp 401–+
- Trager et al. (2000) Trager S. C., Faber S. M., Worthey G., González J. J., 2000, AJ, 120, 165
- van Dokkum (2005) van Dokkum P. G., 2005, AJ, 130, 2647
- van Dokkum & Franx (1996) van Dokkum P. G., Franx M., 1996, MNRAS, 281, 985
- van Dokkum et al. (2000) van Dokkum P. G., Franx M., Fabricant D., Illingworth G. D., Kelson D. D., 2000, ApJ, 541, 95
- Wolf et al. (2005) Wolf C., Bell E. F., McIntosh D. H., et al. 2005, ApJ, 630, 771
- Worthey (1994) Worthey G., 1994, ApJS, 95, 107
- Yi et al. (1997) Yi S., Demarque P., Oemler A. J., 1997, ApJ, 486, 201
- Yi et al. (1999) Yi S., Lee Y.-W., Woo J.-H., Park J.-H., Demarque P., Oemler A. J., 1999, ApJ, 513, 128
- Yi (2003) Yi S. K., 2003, ApJ, 582, 202
- Yi et al. (2005) Yi S. K., Yoon S.-J., Kaviraj S., et al. 2005, ApJ, 619, L111