A search for galaxies in and around an HI overdense region at ††thanks: Based on data collected at Subaru Telescope and in part obtained from data archive at Astronomical Data Analysis Center, which are operated by the National Astronomical Observatory of Japan.
Abstract
We present the discovery of a large-scale structure of emission-line galaxies at redshift behind a massive cluster of galaxies, A1689. Previous spectroscopic observations of a galaxy, A1689-7.1 at , near this structure, revealed a possible overdense region of inter-galactic medium (IGM) around the galaxy, which extends at least comoving Mpc along the line of sight. In order to investigate whether this IGM overdense region contains a galaxy overdensity, we undertook narrow- and broad-band imaging observations around A1689-7.1 with Subaru/Suprime-Cam. We detected 51 candidate Ly emitters (LAEs) at redshift in the arcmin2 field of view. After correction for lensing by the foreground cluster, we found a large-scale ( comoving Mpc) overdense region of galaxies around A1689-7.1 in the source plane at . The densest peak in this region has an overdensity of , suggesting that this structure is probably a good candidate for a protocluster which may evolve into a massive cluster of galaxies in the present-day Universe. A1689-7.1 is located at the edge of this region, where the local galaxy density is times the mean density and is close to the density contrast in the IGM along the line of sight to A1689-7.1 estimated from the optical depth. The overdensities of galaxies we have found may suggest that at least some parts of the IGM overdense region have already started to form galaxies and moreover they relate to the formation of a protocluster. Although we lack information on the three dimensional distributions of both IGM and galaxy overdense regions, the similarity of the scales of both regions may suggest that the two are parts of a single large-scale structure, which would be an large edge-on sheet along the line of sight with a size of comoving Mpc.
keywords:
cosmology: observations – galaxies: formation – galaxies: evolution – galaxies: individual: A1689-7.1.1 Introduction
Galaxies are believed to interact frequently with the surrounding intergalactic medium (IGM) (e.g., Kereš et al., 2005; Kobayashi, Springel, & White, 2007). There are several observational studies of these interactions using correlation between galaxies and IGM absorption-lines at (e.g., Adelberger et al., 2003, 2005; Crighton et al., 2009). While the studies of IGM absorption-lines usually need a bright background source, such as a QSO or a gamma-ray burst (e.g., Rauch, 1998; Chen et al., 2005), Frye et al. (2008) claimed the existence of an overdense region of the IGM at using a galaxy, A1689-7.1 at , which is lensed by the foreground massive galaxy cluster A1689 at .
In the spectrum of A1689-7.1, the HI flux transmission at Å (Ly HI absorption-lines at ) is only of the average value at the same redshift derived from QSO spectra, suggesting that this overdensity of inter-galactic H I gas clouds around A1689-7.1 extends at least 80 comoving Mpc along the line of sight. Although individual H I absorption-lines could not be resolved at the resolution of their spectrum, they claimed that this structure is likely to be made by overlapping of many intergalactic H I gas clouds rather than a few overlapping of very high H I column density clouds, because of absence of metal absorption-lines from these clouds on the continuum long-ward of the Ly emission.
Such a large-scale IGM overdense region would provide us with an unique opportunity to study the formation of galaxies within baryonic large-scale structure at . Although there have been several high- emission-line galaxy searches targeting QSO absorption-line systems, the targets for most of these searches were absorption-line systems by very high H I column density clouds, such as damped Ly absorbers rather than large-scale overdense regions of low H I column density clouds (e.g., Fynbo, Möller, & Thomsen, 2001; Francis et al., 2001; Palunas et al., 2004). Frye et al. (2008) claimed that this IGM structure may be an example of the earliest phase of baryonic large-scale structure that subsequently evolve into the filamentary cosmic web of galaxies (including clusters of galaxies) observed in the present-day Universe. How can we test the possibility? Does the IGM overdense region already contain galaxies and even galaxy overdensities? If the overdensity of galaxies exists, what is the size, density, and morphology of the structure? In order to answer these questions, we undertook a wide-field, deep Ly imaging survey for emission-line galaxies at in the A1689 field.
In this letter, we use AB magnitudes and adopt cosmological parameters, , and km s-1 Mpc-1. In this cosmology, the Universe at is 1.2 Gyr old and arcmin corresponds to a comoving length of 2.3 Mpc at (Wright, 2006).

2 Observations and Data Reduction
| Filter | /a | Exposure Time | (lim)b | FWHM |
|---|---|---|---|---|
| (Å/Å) | (sec) | (AB mag) | (arcsec) | |
| 7126/73 | 11700 () | 25.7 | 0.8 | |
| 7046/100 | 1800 () | — | — | |
| 5447/935 | 1920 () | 26.3 | 0.8 | |
| 6498/1124 | 5400 () | 26.8 | 0.6 | |
| 7633/1489 | 7200 () | 26.3 | 0.7 | |
| 7066/2541 | – | 26.6 | 0.8 |
aThe central wavelength and FWHM of the filters.
bThe limiting magnitudes within arcsec diameter apertures.
cSignificant ghosts appeared in images.
We obtained narrow- and broad-band imaging centred at (,) = 13:11:29.5, 01:20:17 (J2000.0) on 2009 May 23 – 24 (UT) using Suprime-Cam (Miyazaki et al., 2002) on the 8.2-m Subaru Telescope (Iye et al., 2004) as an open use normal programme (S09A-104). We also used archival -band data of the same field taken on 2001 Apr 24 (UT). Details of the observations are listed in Table 1. Our original plan was to use two narrow-band filters, and (Ouchi et al., 2003; Shimasaku et al., 2003, 2004, see Fig. 1). We prioritized imaging because covers the redshift range for Ly at (46 comoving Mpc), which perfectly matches the redshift range of the IGM overdense region at . Unfortunately, the filter holder of had problems and significant ghosts appeared in our scientific images.111The filter holder problems were fixed by the staff of the Subaru Telescope immediately after the run. We immediately changed filter from to . Although the redshift coverage of (, 33 comoving Mpc) has a smaller overlap with the redshift range of the IGM overdense region than , imaging is still useful to search for emission-line galaxies around A1689-7.1.
The raw data were reduced with sdfred (Yagi et al., 2002; Ouchi et al., 2004) and iraf. We flat fielded using the median sky image after masking objects. We did background sky subtraction adopting the mesh size parameter of 64 pixels (13 arcsec) before combining the images. We calibrated the astrometry of the images using the 2MASS All-Sky Catalog of Point Sources (Cutri et al., 2003). Photometric calibration was obtained from the photometric and spectrophotometric standard stars, SA104, SA110-232, and Hz44 (Oke, 1990; Landolt, 1992; Smith et al., 2002). The magnitudes were corrected for Galactic extinction of mag (Schlegel, Finkbeiner, & Davis, 1998). The variation of the extinction in this field is small (peak to peak, mag) and thus it does not affect our results.
The combined images were aligned and smoothed with Gaussian kernels to match their seeing to a FWHM of arcsec. We made a image [] for the continuum with an effective central wavelength similar to . The total size of the field analyzed here is arcmin2 after removal of low S/N regions near the edges of the images. We also masked out the halos of the bright stars. The resultant total effective area is 723 arcmin2.
Object detection and photometry were performed using SExtractor version 2.5.0 (Bertin & Arnouts, 1996). The object detections were made on the image using a Gaussian detection kernel with FWHM of arcsec. We detected 173,864 objects that had 5 connected pixels above of the sky background. The magnitudes and colours are measured in arcsec diameter apertures. The magnitude limits of the observations are reported in Table 1.
3 Results
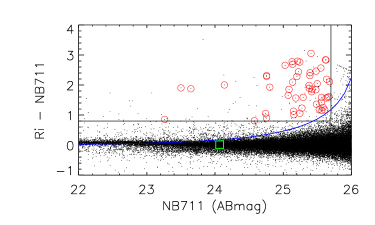
Fig. 2 shows a colour-magnitude plot for the detected sample. We selected 51 candidates as Ly emitters (LAEs) down to ( limit) with the following criteria;
-
(1).
( Å),
-
(2).
,
-
(3).
,
-
(4).
or () ,
-
(5).
,
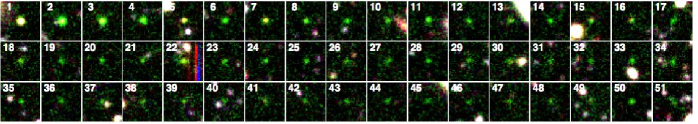
where the is the ratio between the excess and the uncertainty of colour based on photometric errors of both and for objects with constant spectra. The criteria, (1), (2), and (3) are the same as used by Ouchi et al. (2003) and Shimasaku et al. (2003) to select LAEs with the same filter sets. The criterion (4) is applied to exclude the contamination from low- emitters, such as [OII] emitters at , [OIII] emitters at , and H emitters at . The colour limit in (4) was determined using the expected colour of galaxies by Songaila (2004). The criterion (5) was applied to exclude the contamination from non-emitters due to photometric errors. The properties of the 51 LAEs are listed in Table A1 and displayed in Fig. 3. We note that A1689-7.1 was not selected as a LAE, because it failed to satisfy the criteria, (1), (3), and (5).
We corrected the measured magnitudes of LAEs to intrinsic (unlensed) magnitudes using the mass model of A1689 from Limousin et al. (2007) which combines both strong- and weak-lensing constraints (see also Richard et al., 2009). While the magnification factor of A1689-7.1 equates to 2.5 magnitudes (Frye et al., 2008), for our LAE sample, individual magnification factors range from 0 to 0.9 magnitudes. We found that the intrinsic magnitudes () of six LAEs are fainter than the magnitude limit (). Lensing also reduces our surveyed area by the magnification factor, and we estimated a surface of arcmin2 in the source plane, smaller than the observed field of view. We also estimated from the mass model the angular displacement of each candidate back to the source plane at , typically 10 to 60 arcsec towards the centre of the cluster (the displacements from the measured positions, see Fig. 4) and perform all further calculations in the source plane.
We tested whether the entire field of view of the A1689 image (in the source plane) exhibits an overdensity by comparing to the surveys in Subaru Deep Field (SDF) (Ouchi et al., 2003; Shimasaku et al., 2003). In the SDF, they detected 43 LAEs down to in arcmin2. The number density of LAEs in the SDF is arcmin-2. The uncertainty is a Poisson error. Applying the same (intrinsic) magnitude limit to the A1689 field data, we detected 33 LAEs in arcmin2. The number density of LAEs in the A1689 field is arcmin-2. Thus the number density of LAEs in the A1689 field is similar to that in the SDF at least for a sub-sample of slightly bright LAEs (L(Ly) erg s-1). Thus the A1689 field does not show evidence for overdensity in the entire field of view if we use the SDF as a blank field.
.
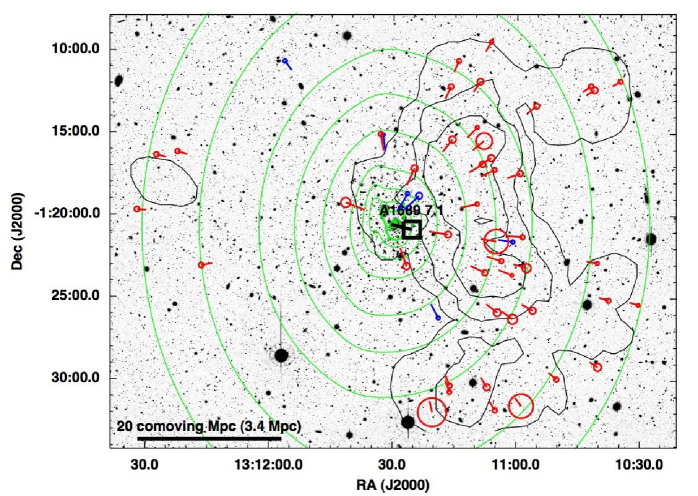
Fig. 4 shows the spatial distribution of the 51 candidate LAEs in the A1689 field and the smoothed density map in the source plane. To avoid effects from the spatial distribution of the lensing magnification, we made the density map using intrinsic magnitude limited sample of 45 LAEs with rather than the full 51 LAE sample. We used a top-hat smoothing kernel of 8 comoving Mpc radius, which is the same as that used in Shimasaku et al. (2003). We defined high-density regions as the regions with the overdensity . There is a large-scale overdense region with an extent of arcmin2 ( comoving Mpc) surrounding A1689-7.1. While the densest peak in this overdense region has an overdensity of , with a significance level of , A1689-7.1 is located at the edge of this region, where the overdensity is .
We tested the reliability of the structure in the following way: (a) We slightly changed the criteria for LAEs (i.e. mag), but the properties of the structure do not change significantly. We conclude that the structure is stable against small changes in our sample definitions. (b) We divided the field of view into eastern and western parts, and selected low- emitters from detected sources down to , satisfying criteria (1), (3), and (5), but not satisfying (2) or (4). The numbers of low- emitters in the eastern and western parts are and , respectively. The uncertainties are Poisson errors. These numbers agree to within , showing that there is no clear systematic effect to select excess objects. (c) We also selected red objects down to , satisfying criteria (2) and (4). The numbers of red objects in the eastern and western parts are and , respectively. These numbers also agree to within , showing that there is no clear systematic effect to select red objects with and colours. In contrast to low- emitters and red objects, the numbers of LAEs in the eastern and western parts are and , respectivley. Thus systematic errors of colours in the field of view should not affect the large-scale structure of LAEs significantly.
4 Discussion and Conclusions
What does the large-scale structure of galaxies (i.e., LAEs) we have found evolve into? This large-scale structure of galaxies is a good candidate for a protocluster. Numerical simulations of structure formation suggested that most () of structures with a size of comoving Mpc and with a peak overdensity of at will evolve into rich clusters () in the present-day Universe (Suwa, Habe, & Yoshikawa, 2006; Overzier et al., 2009). This structure has a size of comoving Mpc and the densest region has an overdensity of . Hence we conclude that this structure is probably a good candidate for a protocluster.
How does the galaxy overdensity relate to the IGM overdensity in this structure? If we assume the optical depth in the IGM is proportional to the square of local gas density over the mean gas density [] (e.g., Rauch, 1998), then the gas density in the IGM overdense region would be estimated to be times the mean gas density at by using the optical depth from Frye et al. (2008). The local galaxy density at the position of A1689-7.1 is times the mean density, and hence it is close to that of the IGM. However, our current observations may have only probed the back-part of the IGM overdense region, and thus it is possible that the galaxy density will be higher in the foreground along the line of sight to A1689-7.1. Although there is a small overlap of the observed redshift ranges of the IGM and galaxy structures (), the current results suggest that at least some parts of the IGM overdense region may have already started to form galaxies and moreover they are probably related to the formation of a protocluster.
Is it possible that these galaxy and IGM overdense regions are parts of a single large-scale structure? Unfortunately, at present, we lack information on the three dimensional distributions of both IGM and galaxy structures. Without spectroscopy, it is unclear whether the structure is concentrated in a particular redshift or smoothly extends to the whole redshift range (). Similarly, it is still unclear whether or not the IGM overdense region extends in a transverse direction or to higher redshift than that of A1689-7.1. Nevertheless, the similarity of the scales of both structures (a few times ten comoving Mpc) may suggest that the two are parts of a single structure. If the IGM and galaxy overdense regions are parts of a single structure, this would be an large edge-on sheet along the line of sight with a size of comoving Mpc. The future observations of LAEs at with will be a direct test of this possibility.
Acknowledgments
We thank the anonymous referee for insightful comments which have significantly improved the paper. We thank Tom Theuns, Mark Swinbank, Jim Geach, Ichi Tanaka, Fumiaki Nakata, and Tomoki Saito for help and useful discussions. YM and IRS acknowledge support from STFC. JR acknowledges support from an European Union Marie-Curie Fellowship. BF acknowledges support from the Science Foundation Ireland Research Frontiers Programme grant PHY008.
References
- Adelberger et al. (2003) Adelberger K. L., Steidel C. C., Shapley A. E., Pettini M., 2003, ApJ, 584, 45
- Adelberger et al. (2005) Adelberger K. L., Shapley A. E., Steidel C. C., Pettini M., Erb D. K., Reddy N. A., 2005, ApJ, 629, 636
- Bertin & Arnouts (1996) Bertin, E., & Arnouts, S. 1996, A&A, 117, 393
- Chen et al. (2005) Chen H.-W., Prochaska J. X., Bloom J. S., Thompson I. B., 2005, ApJ, 634, L25
- Crighton et al. (2009) Crighton N. H. M., Morris S. L., Bechtold J., Crain R. A., Jannuzi B. T., Shone A., Theuns T., 2009, arXiv, arXiv:0911.0368
- Cutri et al. (2003) Cutri R. M., et al., 2003, tmc..book,
- Iye et al. (2004) Iye M., et al., 2004, PASJ, 56, 381
- Francis et al. (2001) Francis P. J., et al., 2001, ApJ, 554, 1001
- Frye et al. (2008) Frye B. L., et al., 2008, ApJ, 685, L5
- Fynbo, Möller, & Thomsen (2001) Fynbo J. U., Möller P., Thomsen B., 2001, A&A, 374, 443
- Kereš et al. (2005) Kereš D., Katz N., Weinberg D. H., Davé R., 2005, MNRAS, 363, 2
- Kobayashi, Springel, & White (2007) Kobayashi C., Springel V., White S. D. M., 2007, MNRAS, 376, 1465
- Landolt (1992) Landolt A. U., 1992, AJ, 104, 340
- Limousin et al. (2007) Limousin M., et al., 2007, ApJ, 668, 643
- Miyazaki et al. (2002) Miyazaki S., et al., 2002, PASJ, 54, 833
- Oke (1990) Oke, J. B. 1990, AJ, 99, 1621
- Ouchi et al. (2003) Ouchi M., et al., 2003, ApJ, 582, 60
- Ouchi et al. (2004) Ouchi M., et al., 2004, ApJ, 611, 660
- Overzier et al. (2009) Overzier R. A., Guo Q., Kauffmann G., De Lucia G., Bouwens R., Lemson G., 2009, MNRAS, 394, 577
- Palunas et al. (2004) Palunas P., Teplitz H. I., Francis P. J., Williger G. M., Woodgate B. E., 2004, ApJ, 602, 545
- Rauch (1998) Rauch M., 1998, ARA&A, 36, 267
- Richard et al. (2009) Richard J., et al., 2009, arXiv, arXiv:0911.3302
- Schlegel, Finkbeiner, & Davis (1998) Schlegel D. J., Finkbeiner D. P., Davis M., 1998, ApJ, 500, 525
- Shimasaku et al. (2003) Shimasaku K., et al., 2003, ApJ, 586, L111
- Shimasaku et al. (2004) Shimasaku K., et al., 2004, ApJ, 605, L93
- Smith et al. (2002) Smith J. A., et al., 2002, AJ, 123, 2121
- Songaila (2004) Songaila A., 2004, AJ, 127, 2598
- Suwa, Habe, & Yoshikawa (2006) Suwa T., Habe A., Yoshikawa K., 2006, ApJ, 646, L5
- Yagi et al. (2002) Yagi M., Kashikawa N., Sekiguchi M., Doi M., Yasuda N., Shimasaku K., Okamura S., 2002, AJ, 123, 66
- Wright (2006) Wright E. L., 2006, PASP, 118, 1711
Appendix A Source Catalog
| IDc | Coordinate (J2000)c | Offsetd | log LLyα | ||||||||
|---|---|---|---|---|---|---|---|---|---|---|---|
| LAE | (h:m:s) (d:m:s) | (arcsec) | (ABmag) | (erg s-1) | (Å) | ||||||
| 1 | 13:10:58.70 01:31:33.0 | 23.2 | 30.2 | 23.26 | 24.12 | 25.97 | 24.63 | 23.69 | 23.28 | 43.04 | 93 |
| 2 | 13:11:20.32 01:31:56.9 | 9.4 | 40.8 | 23.50 | 25.40 | 26.88 | 25.80 | 25.03 | 23.53 | 43.11 | 415 |
| 3 | 13:11:04.92 01:21:33.2 | 57.1 | 8.3 | 23.65 | 25.52 | 27.62 | 26.17 | 25.04 | 23.74 | 43.00 | 400 |
| 4 | 13:11:08.02 01:15:27.5 | 41.1 | -34.2 | 24.14 | 26.14 | 28.00 | 26.93 | 25.65 | 24.21 | 42.84 | 472 |
| 5 | 13:10:56.04 01:25:45.0 | 40.0 | 22.6 | 24.58 | 25.39 | 27.08 | 26.06 | 24.90 | 24.61 | 42.48 | 85 |
| 6 | 13:11:00.93 01:26:16.7 | 38.8 | 28.0 | 24.76 | 27.07 | 28.00 | 27.89 | 26.53 | 24.80 | 42.62 | 707 |
| 7 | 13:11:08.33 01:16:52.6 | 48.6 | -29.5 | 24.75 | 25.65 | 28.00 | 26.59 | 25.09 | 24.85 | 42.41 | 100 |
| 8 | 13:10:57.56 01:23:10.5 | 48.0 | 14.2 | 24.80 | 26.73 | 27.83 | 27.50 | 26.23 | 24.85 | 42.58 | 428 |
| 9 | 13:10:40.21 01:29:10.2 | 29.4 | 19.0 | 25.03 | 27.68 | 28.00 | 28.36 | 27.25 | 25.04 | 42.54 | 1137 |
| 10 | 13:10:41.23 01:12:20.5 | 30.4 | -19.0 | 25.07 | 26.73 | 27.75 | 27.31 | 26.28 | 25.09 | 42.46 | 301 |
| 11 | 13:11:41.52 01:19:14.1 | -69.0 | -25.9 | 24.76 | 27.04 | 28.00 | 28.07 | 26.51 | 25.10 | 42.51 | 682 |
| 12 | 13:11:07.07 01:30:24.4 | 22.7 | 35.9 | 25.09 | 26.94 | 28.00 | 27.26 | 26.66 | 25.12 | 42.46 | 389 |
| 13 | 13:12:22.38 01:16:09.8 | -35.5 | -11.0 | 25.15 | 26.28 | 27.96 | 26.73 | 25.90 | 25.16 | 42.34 | 144 |
| 14 | 13:11:04.63 01:25:52.7 | 40.3 | 30.9 | 25.13 | 27.91 | 28.00 | 28.67 | 27.27 | 25.19 | 42.49 | 1357 |
| 15 | 13:11:03.72 01:22:44.7 | 53.1 | 16.2 | 25.16 | 26.17 | 27.66 | 26.72 | 25.74 | 25.23 | 42.28 | 120 |
| 16 | 13:10:34.98 01:11:49.3 | 28.6 | -17.0 | 25.24 | 26.31 | 27.61 | 26.85 | 25.88 | 25.25 | 42.30 | 130 |
| 17 | 13:11:15.69 01:15:22.8 | 35.5 | -45.4 | 25.14 | 27.83 | 28.00 | 28.44 | 27.61 | 25.26 | 42.46 | 1197 |
| 18 | 13:11:07.70 01:23:27.5 | 52.3 | 24.7 | 25.18 | 26.75 | 28.00 | 28.00 | 26.15 | 25.28 | 42.36 | 267 |
| 19 | 13:11:08.96 01:11:51.4 | 25.3 | -37.9 | 25.24 | 28.00 | 28.00 | 28.52 | 27.65 | 25.29 | 42.45 | 1326 |
| 20 | 13:11:06.27 01:16:29.7 | 46.5 | -28.6 | 25.21 | 28.00 | 27.92 | 28.67 | 27.45 | 25.29 | 42.45 | 1391 |
| 21 | 13:12:27.48 01:16:21.8 | -33.9 | -9.2 | 25.29 | 26.88 | 27.49 | 27.51 | 26.47 | 25.30 | 42.36 | 276 |
| 22 | 13:11:26.68 01:23:05.3 | 23.8 | 66.6 | 24.74 | 25.80 | 28.00 | 26.76 | 25.25 | 25.36 | 42.26 | 129 |
| 23 | 13:12:32.17 01:19:42.2 | -34.1 | -1.7 | 25.38 | 27.37 | 28.00 | 28.67 | 26.70 | 25.39 | 42.36 | 463 |
| 24 | 13:12:16.51 01:23:05.0 | -40.2 | 8.0 | 25.38 | 27.27 | 27.89 | 27.64 | 27.00 | 25.40 | 42.36 | 409 |
| 25 | 13:10:55.28 01:13:19.8 | 33.9 | -25.9 | 25.39 | 27.80 | 28.00 | 28.67 | 27.10 | 25.42 | 42.38 | 803 |
| 26 | 13:11:05.11 01:31:49.0 | 20.1 | 33.7 | 25.42 | 27.19 | 28.00 | 27.94 | 26.76 | 25.44 | 42.32 | 351 |
| 27 | 13:11:16.10 01:12:10.4 | 20.3 | -44.1 | 25.39 | 27.71 | 28.00 | 28.16 | 27.31 | 25.45 | 42.36 | 708 |
| 28 | 13:10:59.21 01:17:25.2 | 47.7 | -17.6 | 25.41 | 28.46 | 28.00 | 28.67 | 28.01 | 25.46 | 42.40 | 2132 |
| 29 | 13:11:16.13 01:30:19.5 | 16.2 | 41.8 | 25.42 | 27.28 | 28.00 | 28.25 | 26.72 | 25.47 | 42.32 | 392 |
| 30 | 13:11:33.08 01:15:04.2 | -10.3 | -59.8 | 25.27 | 26.50 | 28.00 | 27.26 | 26.01 | 25.47 | 42.26 | 168 |
| 31 | 13:10:37.64 01:25:07.6 | 35.4 | 11.5 | 25.48 | 27.32 | 28.00 | 27.94 | 26.85 | 25.49 | 42.32 | 383 |
| 32 | 13:10:42.13 01:12:07.7 | 30.1 | -19.7 | 25.48 | 27.94 | 28.00 | 28.67 | 27.36 | 25.49 | 42.36 | 865 |
| 33 | 13:11:24.84 01:17:08.0 | 27.7 | -61.6 | 25.14 | 27.24 | 27.65 | 27.86 | 26.83 | 25.50 | 42.34 | 533 |
| 34 | 13:11:16.65 01:21:09.3 | 69.7 | 11.5 | 25.22 | 27.66 | 28.00 | 28.67 | 27.08 | 25.53 | 42.34 | 840 |
| 35 | 13:11:14.19 01:10:36.4 | 17.7 | -40.5 | 25.50 | 27.54 | 28.00 | 28.41 | 26.99 | 25.54 | 42.32 | 498 |
| 36 | 13:10:50.21 01:29:55.2 | 28.4 | 24.8 | 25.55 | 28.12 | 28.00 | 28.67 | 27.26 | 25.57 | 42.32 | 999 |
| 37 | 13:11:06.34 01:09:26.5 | 20.1 | -34.6 | 25.56 | 26.99 | 27.37 | 27.25 | 26.74 | 25.59 | 42.23 | 221 |
| 38 | 13:11:09.67 01:14:38.1 | 36.2 | -37.9 | 25.53 | 26.72 | 28.00 | 27.25 | 26.32 | 25.60 | 42.18 | 159 |
| 39 | 13:10:30.41 01:25:23.2 | 32.6 | 9.9 | 25.61 | 26.78 | 28.00 | 27.36 | 26.35 | 25.62 | 42.18 | 154 |
| 40 | 13:11:09.63 01:19:17.7 | 60.8 | -13.3 | 25.49 | 26.85 | 28.00 | 27.12 | 26.54 | 25.62 | 42.20 | 202 |
| 41 | 13:11:01.11 01:23:36.6 | 48.7 | 18.9 | 25.57 | 26.72 | 28.00 | 27.27 | 26.30 | 25.63 | 42.18 | 151 |
| 42 | 13:10:40.40 01:22:51.6 | 39.0 | 6.8 | 25.63 | 27.20 | 28.00 | 27.88 | 26.77 | 25.65 | 42.23 | 268 |
| 43 | 13:11:16.15 01:30:42.8 | 15.3 | 41.2 | 25.64 | 27.83 | 28.00 | 28.67 | 27.22 | 25.68 | 42.28 | 604 |
| 44 | 13:10:58.57 01:21:17.7 | 51.9 | 4.6 | 25.63 | 28.46 | 27.66 | 28.67 | 28.01 | 25.68 | 42.30 | 1480 |
| 45 | 13:11:05.46 01:17:12.8 | 49.7 | -24.3 | 25.62 | 28.46 | 28.00 | 28.67 | 28.01 | 25.70 | 42.28 | 1497 |
| 46 | 13:11:56.43 01:10:39.4 | -24.6 | -33.3 | 25.68 | 27.79 | 28.00 | 28.37 | 27.36 | 25.71 | 42.26 | 542 |
| 47 | 13:11:00.93 01:21:34.6 | 53.6 | 6.9 | 25.67 | 27.28 | 28.00 | 28.37 | 26.70 | 25.74 | 42.20 | 284 |
| 48 | 13:11:18.93 01:26:12.7 | 27.2 | 50.3 | 25.65 | 27.24 | 28.00 | 28.13 | 26.74 | 25.78 | 42.18 | 274 |
| 49 | 13:11:32.51 01:15:06.7 | -8.5 | -60.3 | 25.58 | 26.84 | 28.00 | 27.33 | 26.45 | 25.79 | 42.11 | 174 |
| 50 | 13:11:23.72 01:18:48.3 | 53.0 | -50.7 | 25.20 | 27.48 | 28.00 | 28.67 | 26.85 | 25.85 | 42.20 | 678 |
| 51 | 13:11:26.53 01:18:40.9 | 35.4 | -63.3 | 25.56 | 27.15 | 27.55 | 27.57 | 26.85 | 26.42 | 41.92 | 275 |
a The properties are based on photometry with arcsec diameter apertures. Magnitudes below are replaced to upper limits.
b The LAEs are ranked in terms of intrinsic (unlensed) magnitude, .
c The measured positions of LAEs.
d Offsets (RA and Dec in arcsec) of LAEs on the source plane. The positive values show offsets to East and North directions.