Previous addresses: ]Departement für Physik, Universität Basel and Institut für Kernphysik, Forschungszentrum Karlsruhe, D-76021 Karlsruhe.
Previous address: ]Institut für Kernphysik, Forschungszentrum Karlsruhe, D-76021 Karlsruhe. Previous address: ]Institut für Kernphysik, Forschungszentrum Karlsruhe, D-76021 Karlsruhe.
Stellar (n,) cross sections of -process isotopes
Part 1: 102Pd, 120Te, 130,132Ba, and 156Dy
Abstract
We have investigated the cross sections of -process isotopes with the activation technique. The measurements were carried out at the Karlsruhe Van de Graaff accelerator using the 7Li7Be source for simulating a Maxwellian neutron distribution of = 25 keV. Stellar cross section measurements are reported for the light -process isotopes 102Pd, 120Te, 130,132Ba, and 156Dy. In a following paper the cross sections of 168Yb, 180W, 184Os, 190Pt, and 196Hg will be discussed. The data are extrapolated to -process energies by including information from evaluated nuclear data libraries. The results are compared to standard Hauser-Feshbach models frequently used in astrophysics.
pacs:
25.40.Lw, 26.30.-k, 27.50.+e, 97.10.CvI Introduction
Astrophysical models can explain the origin of most nuclei beyond the iron group by a combination of processes involving neutron captures on long (-process) or short (-process) time scales Burbidge et al. (1957); Langanke and Wiescher (2001).
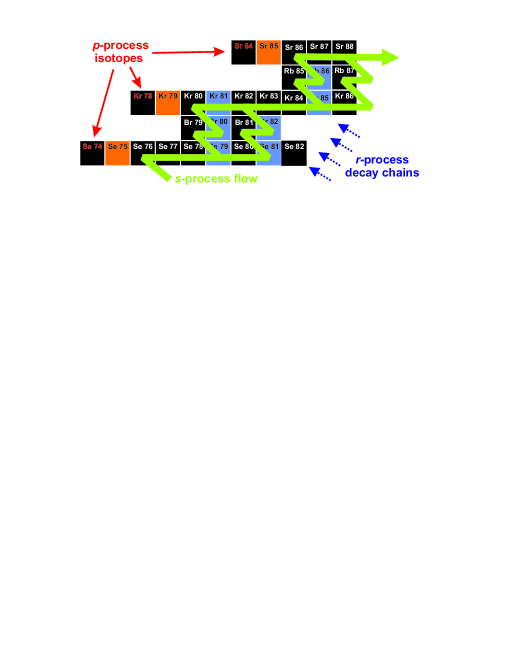
However, 32 proton-rich stable isotopes between 74Se and 196Hg cannot be formed in these neutron capture processes, because they are either shielded by stable isotopes from the -process decay chains or lie outside the -process flow (Fig. 1). These isotopes, which are ascribed to the so-called ”-process”, are 10 to 100 times less abundant than their - and -process neighbors. So far, the astrophysical site of the -process is still under discussion, since the solar -abundances can not be completely described by current models.
Historically, the -process was thought to proceed via proton captures, but a plausible site with the required amount of free protons could not be identified. Moreover, elements with large cannot be produced by proton captures because the temperatures necessary to overcome the Coulomb repulsion favor photodisintegration rather than charged-particle capture.
The most plausible astrophysical site is the explosively burning Ne/O layer in core collapse supernovae, which is heated to ignition temperatures by the outgoing shock front Woosley and Howard (1978, 1990); Rayet et al. (1995). In this high-temperature environment proton-rich nuclei are produced by sequences of photo-dissociations and decays. In stars 20 times more massive than the sun the -process temperatures for efficient photo-disintegration are already reached at the end of hydrostatic Ne/O burning Rauscher et al. (2002). This mechanism is also called ” process” because proton-rich isotopes are produced by () reactions on pre-existing seed nuclei from the - and - processes. When () and () reactions become comparable or faster than (), the reaction path branches out from the initial isotopic chain and feeds nuclei with lower atomic number . While photodisintegration dominates in the early, hot phase, the initially released neutrons can be recaptured at a later time, when the material cools down after the passage of the shockwave. The typical -process abundance pattern exhibits maxima at 92Mo (=50) and 144Sm (=82).
The solar abundances of the -nuclei are reproduced by current models of the process within factors of two to three on average Rayet et al. (1995, 1990); Rauscher et al. (2002), except for two regions with nuclei of and Rauscher et al. (2002). The most abundant -isotopes, 92,94Mo and 96,98Ru, are significantly underproduced because appropriately abundant seed nuclei are missing. Alternative processes and sites have been proposed in order to explain this deficiency, i.e. reactions induced by the strong neutrino fluxes in the deepest ejected layers of core-collapse supernovae (the process Fröhlich et al. (2006)), or explosive hydrogen burning in proton-rich, hot matter accreted onto the surface of neutron stars (the process Schatz et al. (1998, 2001)). An alternative site for additional production of the has not been suggested so far.
A few -nuclides may also be produced by neutrino reactions during the process. This ” process” Woosley et al. (1990) could be the origin of the odd-odd isotopes 138La and 180Tam, which are strongly underproduced in the process. The abundances of both -nuclei may be explained by neutrino scattering on their abundant neighbor isotopes to states above the neutron emission threshold.
The isotopes 152Gd, 164Er, and 180Tam were sometimes also considered as -nuclei but it was found that significant fractions are produced indeed by the -process Arnould and Goriely (2003).
The fact that self-consistent studies of the process have problems to synthesize the -nuclei in the mass regions and Rauscher et al. (2002) may result from difficulties related to the astrophysical models as well as from systematic uncertainties of the nuclear physics input. Therefore, the improvement of nuclear reaction cross sections is crucial for further progress in -process models, either by directly replacing theoretical predictions by experimental data or by testing the reliability of predictions if the relevant energy range is not accessible by experiments.
In this context we have carried out an extensive experimental program to measure the () cross sections of 13 -only isotopes by means of the activation technique. Two publications are already available concerning 74Se, 84Sr Dillmann et al. (2006), and 174Hf Vockenhuber et al. (2007). The present paper continues this series of measurements with the isotopes 102Pd, 120Te, 130,132Ba, and 156Dy, and a follow-up paper will cover the remaining heavy -isotopes 168Yb, 180W, 184Os, 190Pt, and 196Hg. A concluding paper will present -process network calculations based on a new version of the ”Karlsruhe Astrophysical Database of Nucleosynthesis in Stars” (KADoNiS) Dillmann et al. (2005), where the available experimental and semi-empirical () cross sections for the -process will be added to the already existing data library for the -process. Thereby, the KADoNiS project will be extended to provide the -process community with updated experimental information. These data will necessarily remain a complement to the indispensable theoretical predictions for the vast majority of the mostly unstable isotopes in the -process network, which are not accessible to cross section measurements with present experimental techniques. Nevertheless, these data provide important tests of existing calculations in the Hauser-Feshbach statistical model Hauser and Feshbach (1952), i.e. with the codes NON-SMOKER Rauscher and Thielemann (2000, 2001) or MOST Goriely (2005).
II Experimental technique
This section contains a concise discussion of the experimental technique. More detailed information can be found in Refs. Beer and Käppeler (1980); Ratynski and Käppeler (1988).
II.1 Neutron activation
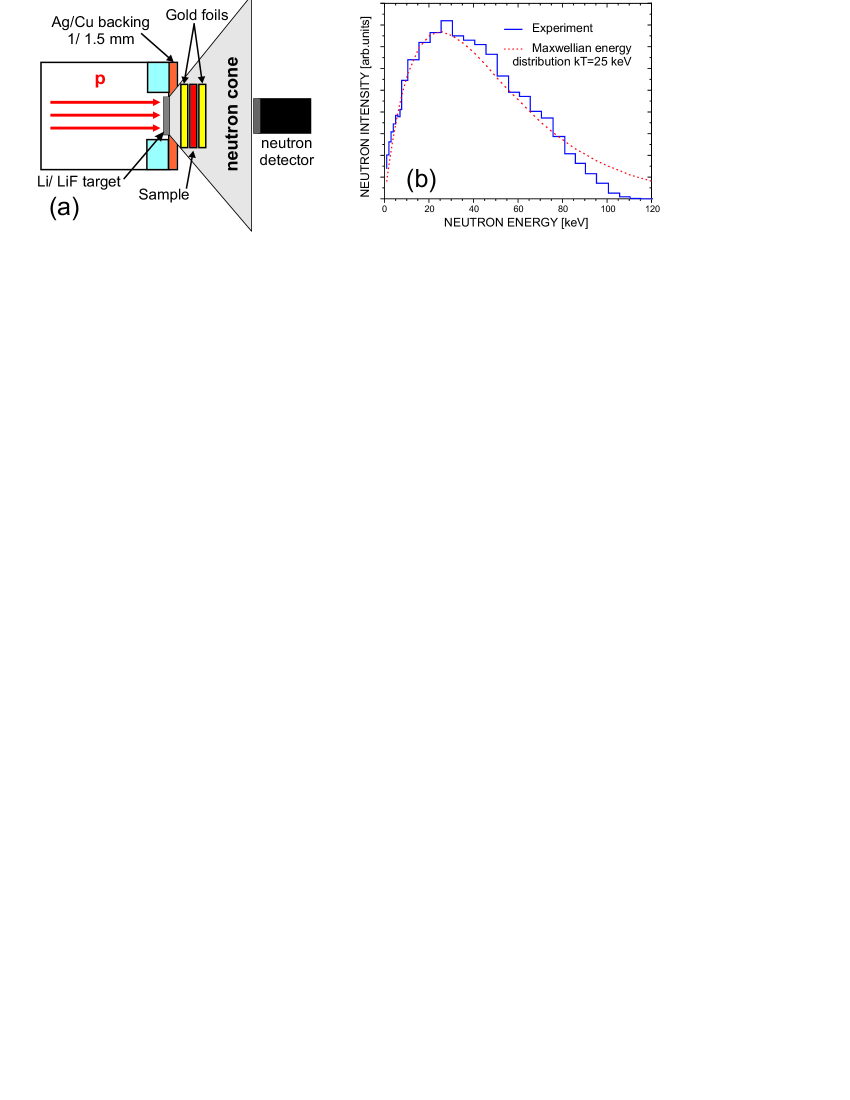
The present capture measurements were carried out at the (now closed) Karlsruhe 3.7 MV Van de Graaff accelerator using the activation technique. Neutrons were produced with the 7Li()7Be source by bombarding 30 m thick layers of metallic Li or crystalline LiF on water-cooled Cu backings with protons of 1912 keV, 31 keV above the threshold of the 7Li()7Be reaction at 1881 keV. Under these conditions, all neutrons are emitted into a forward cone of 120∘ opening angle. The resulting neutron field represents a quasi-stellar spectrum, which approximates a Maxwell-Boltzmann distribution for = 25.0 0.5 keV Ratynski and Käppeler (1988) (see Fig. 2). Activation in this spectrum yields, therefore, directly the Maxwellian averaged cross section (MACS), with only a small correction for the fact that the quasi-stellar spectrum is truncated at = 106 keV. Neutron scattering in the Cu backing is negligible, since the transmission is 98% in the energy range of interest.
In all cases, the sample material was of natural composition and high elemental purity (), either in metallic form or as a compound (Table 1). However, it has to be emphasized that the large uncertainty of the 120Te abundance given in De Laeter et al. (2003) originates from the fractionation of tellurium in various materials and the fact that up to now no absolute isotopic abundance measurement has been carried out.
The recommended value of 0.09 (1)% in De Laeter et al. (2003) is commented with ”An electron multiplier was used for these measurements and the measured abundances were adjusted using a ’square root of the masses’ correction factor” Smith et al. (1978). Independent relative measurements of the isotope ratios have been carried out later by De Laeter et al. De Laeter (1994) with a Faraday Cup collector and Lee et al. Lee and Halliday (1995) using ICP-MS (inductively coupled plasma mass spectrometry). Both methods revealed 120Te abundances of 0.0918 (7)% and 0.0927 (4)%, respectively, which are in clear disagreement with the ”best value” assignment of 0.0960 (7)% by Smith et al. Smith et al. (1978) given in the latest IUPAC Technical Report 2003 De Laeter et al. (2003). In De Laeter (1994) the value from Smith et al. Smith et al. (1978) was corrected with the above mentioned factor and one can calculate a value of 0.0935 (7)% from the given isotope ratios. The correction is due to a mass discrimination which occurs when using electron multipliers. The signal from light isotopes is enhanced compared to that from heavier isotopes because the secondary electron yield at the first dynode is velocity dependent De Laeter (1994). The methods using Faraday cups De Laeter (1994) or ICP-MS Lee and Halliday (1995) do already account for this. From these three values we can derive a weighted average of 0.0927 (9)% where the uncertainty is derived from the standard deviation of the measurements. We decided to use this value for our measurement instead of the ”representative isotopic composition” given in De Laeter et al. (2003).
. Element Isotope Sample material Rel. abundance [%] Pd 102Pd Pd (metal) 1.02 (1) Te 120Te Te (metal) 0.09 (1)a Ba 130Ba BaCO3 0.106 (1) 132Ba BaCO3 0.101 (1) Dy 156Dy Dy (metal) 0.056 (3) a See text. Used value is 0.0927 (9)%.
Apart from the Pd samples, which were cut from 25 m thick foils, thin pellets 6 to 10 mm in diameter were pressed from the respective powder or granules and enclosed in thin cannings made from 15 m thick aluminum foil. During the irradiations the samples were sandwiched between 10-30 m thick gold foils of the same diameter. In this way the neutron flux can be determined relative to the well-known capture cross section of 197Au Ratynski and Käppeler (1988).
The activation measurements were carried out with the Van de Graaff accelerator operated in DC mode with a current of 100 A (for the Li targets) or even higher currents (up to 150 A) for the LiF targets. To ensure homogeneous illumination of the entire surface, the proton beam was continuously wobbled across the Li target. The samples were irradiated in close contact with the Li target with average neutron intensities of (1.5–3)109 s-1 at the position of the samples. The neutron intensity was recorded in intervals of 60 or 90 s using a 6Li-glass detector 91 cm downstream of the lithium target. With this information, fluctuations in the neutron yield could be properly considered in the later correction of the number of nuclei, which decayed during the activation.
Over the course of the present measurements, several independent activations have been carried out for each isotope with modified experimental parameters (see Table 2).
| Target | Sample | Diameter | Mass | a | ||
|---|---|---|---|---|---|---|
| isotope | [mm] | [mg] | [1018 atoms] | [min] | [1014 n] | |
| 102Pd | pd-1 | 10 | 452.5 | 26.1 | 9770 | 8.18 |
| pd-2 | 8 | 301.5 | 17.4 | 5751 | 4.83 | |
| pd-3 | 12 | 339.5 | 19.6 | 7585 | 3.48 | |
| 120Te | te-1 | 10 | 352.9 | 1.54 | 2617 | 1.96 |
| te-2 | 10 | 441.2 | 1.93 | 1600 | 1.52 | |
| te-3 | 8 | 349.3 | 1.53 | 1406 | 1.56 | |
| te-4 | 8 | 417.2 | 1.83 | 4142 | 3.03 | |
| te-5 | 8 | 409.6 | 1.79 | 2593 | 3.09 | |
| 130Ba | ba-1 | 8 | 106.9 | 0.346 | 7721 | 6.93 |
| 132Ba | 0.330 | |||||
| 130Ba | ba-2 | 8 | 145.5 | 0.471 | 4014 | 2.70 |
| 132Ba | 0.448 | |||||
| 130Ba | ba-3 | 10 | 149.7 | 0.484 | 4280 | 4.48 |
| 132Ba | 0.461 | |||||
| 156Dy | dy-1 | 6 | 28.3 | 0.0588 | 964 | 0.995 |
| dy-2 | 10 | 80.1 | 0.166 | 362 | 0.416 | |
| dy-3 | 6 | 61.6 | 0.128 | 902 | 1.73 | |
a Total neutron exposure during activation.
II.2 Activity measurements
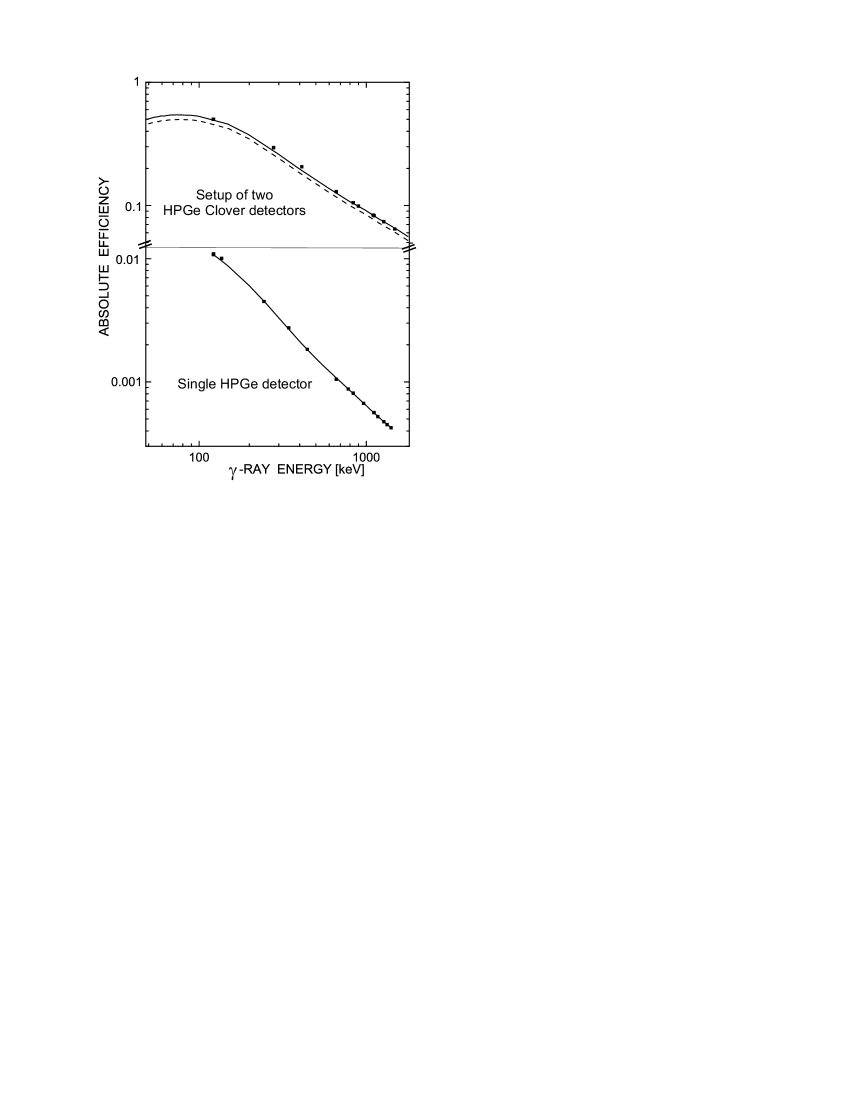
For the measurement of the induced activities two detector setups were available. A single high purity Germanium (HPGe) detector with a well defined measuring position at 76.00.5 mm from the detector surface was used for counting the activities of the gold foils and of the 121Te, 131Ba, and 133Bam decays. The detector was shielded by 10 cm of lead and 5 mm of copper. Energy and efficiency calibrations have been carried out with a set of reference -sources in the energy range between 60 keV and 2000 keV (see Fig. 3).
The small activities of 103Pd and 133Bag were measured with a system of two HPGe Clover detectors (see Ref. Dababneh et al. (2004) for more details). Each Clover detector consists of four independent HPGe n-type crystals in a common cryostat. The two Clovers were placed face to face, in contact with a 5.2 mm thick sample holder, corresponding nearly to a 4 geometry. The sample position in the very center of the system could be reproduced within 0.1 mm. The whole assembly was shielded against room background with 10 cm of lead and a 5 mm thick layer of copper. The data from the eight Ge crystals of the two Clover detectors were processed by separate analog to digital converters (ADCs) and could, therefore be analyzed independently. In Clover measurements, the contributions of the eight crystals were added to represent the total number of events per -ray line. The efficiency calibration of the Clover system was carried out with a set of weak reference sources.
III Data analysis
III.1 General procedure
The total amount of activated nuclei at the end of each irradiation can be deduced from the number of events in a particular -ray line registered in the HPGe detector during the measuring time Beer and Käppeler (1980),
| (1) |
where denotes the waiting time between irradiation and activity measurement, the efficiency of the HPGe detector, and the relative intensity per decay of the respective transition. is a correction factor which is either the self-absorption correction factor (Eq 2) or the total correction factor (Table 4). The decay properties of the investigated product nuclei are summarized in Table 3.
| Product | t1/2 | Decay mode | Eγ | Iγ | Reference |
|---|---|---|---|---|---|
| nucleus | [keV] | [%] | |||
| 103Pd | 16.991 (19) d | EC | 357.5 | 0.0221 (7) | de Frenne and Jacobs (2001) |
| 121Teg | 19.16 (5) d | EC | 573.1 | 80.3 (25) | Tamura (2000) |
| 121Tem | 154 (7) d | IT (88.6 (11) %) | 212.2 | 81.4 (1) | |
| 121Tem | EC (11.4 (11) %) | 1102.1 | 2.54 (6) | ||
| 131Ba | 11.50 (6) d | EC | 216.1 | 20.4 (4) | Khazov et al. (2006) |
| EC | 496.3 | 48.0 (4) | |||
| 133Bag | 10.52 (13) yr | EC | 356.0 | 62.05 (19) | Shaheen (1995) |
| 133Bam | 38.9 (1) h | IT (99.99 %) | 275.9 | 17.8 (6) | |
| 157Dy | 8.14 (4) h | EC | 326.3 | 93 (3) | Helmer (2004) |
| 198Au | 2.69517 (21) d | - | 411.8 | 95.58 (12) | Chunmei (2002) |
The large distance between sample and detector in the measurements with the single HPGe detector allowed us to calculate the correction for -ray self-absorption from the expression for disk samples of thickness Beer and Käppeler (1980),
| (2) |
using the -ray absorption coefficients from Ref. Hubbell and Seltzer (2004). This correction factor was negligible for the thin (10-30 m) gold foils.
The close geometry of the Clover detectors required a more elaborate treatment of the sample-related corrections in the measurement of the small activities of 103Pd and 133Bag. The correction factors for -ray self absorption, for the extended geometry of the sample, and for the summing effect of cascade transitions have the been calculated by means of Monte Carlo simulations with the GEANT4 toolkit Agostinelli et al. (2003) and a detailed computer model of the setup Dababneh et al. (2004) (Table 4). The summing correction factor of sample pd-3 is slightly higher than for samples pd-1 and pd-2 due to the varying thickness. The thinner sample pd-3 absorbs less X-rays and thus more coincident summing with decay -rays can occur.
| Sample | Thickness | ||||
|---|---|---|---|---|---|
| [mm] | |||||
| pd-1 | 0.5 | 0.9976 | 0.9563 | 0.9991 | 0.9531 |
| pd-2 | 0.5 | 0.9986 | 0.9569 | 0.9951 | 0.9509 |
| pd-3 | 0.25 | 0.9972 | 0.9762 | 0.9663 | 0.9407 |
| ba-1 | 0.48 | 1.0002 | 0.9820 | 0.9575 | 0.9405 |
| ba-2 | 0.65 | 1.0022 | 0.9752 | 0.9608 | 0.9390 |
| ba-3 | 0.43 | 0.9994 | 0.9841 | 0.9570 | 0.9412 |
The number of activated nuclei can be written as
| (3) |
where is the time-integrated neutron flux and the number of atoms of species in the sample. As our measurements are carried out relative to 197Au as a standard, the neutron flux cancels out in the ratio,
| (4) |
The correction factor
| (5) |
for the decay of activated nuclei during the irradiation time is calculated from the neutron flux history recorded with the 6Li glass detector downstream of the neutron target. This correction includes also the effect of variations in the neutron flux.
The cross section is given in brackets to indicate that it represents an average over the quasi-stellar spectrum of the 7Li(p,n)7Be source. The reference value for the experimental averaged 197Au cross section was adopted as = mbarn Ratynski and Käppeler (1988).
III.2 Partial cross sections
In the activations of 120Te, 130Ba, and 132Ba, neutron capture populates ground and isomeric states in the product nucleus. The partial cross section to 131Bam could not be measured in this work because the isomer is too short short-lived ( min). Therefore, only the total capture cross section of 130Ba was derived from the ground state activity after an appropriate waiting time. Similarly, the isomeric state in 133Ba decays with 99.99% probability by internal transitions with a half-life of 38.9 h so that the total cross section can later be derived from the ground-state activity ( yr). In this case, the isomer lived long enough that the partial cross section could be determined as well.
In cases where the half-lives of ground state and isomer are of the same order of magnitude, as for 121Te, where the isomer (88.6% IT, 11.4% EC) is even longer-lived than the ground-state, the contributions of both states to the total cross section have to be properly disentangled. The partial cross section to the ground state can be deduced from the spectra of the first few days, where the contribution from the isomer decay is still small. The exact correction for the ground-state was discussed in detail in Ref. Dillmann et al. (2006) and has been used here.
IV Uncertainties
The experimental uncertainties are summarized in Table 5. Since nearly every stellar neutron cross section measurement was carried out relative to gold, the 1.4% uncertainty of the gold cross section Ratynski and Käppeler (1988) cancels out in most astrophysical applications.
| Source of uncertainty | Uncertainty (%) | |||||||
|---|---|---|---|---|---|---|---|---|
| 197Au | 102Pd | 120Teg | 120Tem | 130Ba a | 132Bam | 132Bag+m | 156Dy | |
| Gold cross section | 1.4b | – | – | – | – | – | – | – |
| Isotopic abundance | – | 1.0 | 0.9 | 0.9 | 0.9 | 1.0 | 1.0 | 5.4 |
| Detector efficiency | 2.0 | 2.0 | ||||||
| Divergence of flux | – | 2.0 | ||||||
| Sample mass | 0.2 | – | – | – | – | – | – | 0.1 |
| -Ray intensity | 0.1 | 3.1 | 3.1 | 0.1 | 1.5/1.4 | 3.4 | 0.3 | 3.2 |
| -Ray self-absorption | – | 0.2 | ||||||
| Summing corrections | – | 0.4 | – | – | – | – | 0.4 | – |
| Counting statistics | 0.1 - 1.0 | 0.3 - 0.6 | 0.4 - 0.8 | 2.0-2.6 | 0.4 - 1.4 | 2.6 - 3.1 | 1.2 - 1.4 | 1.2 - 2.4 |
| Total uncertaintyc | 4.8 | 4.8 | 4.1 - 4.5 | 3.7 - 4.0 | 5.4 - 5.8 | 3.6 - 3.9 | 7.3 - 7.6 | |
a -Ray lines at 216 and 373 keV.
b Not included in final uncertainty, see text.
c Including the respective uncertainty of gold (2.0-2.2%).
Significant uncertainties were contributed by the sample position, detector efficiencies, and -ray intensities. In the activations the position of the samples relative to the Au foils was estimated to 0.25 mm, leading to a 2% uncertainty in the neutron flux. The same uncertainty had to be assigned to the efficiency calibration of both detector systems. The largest uncertainties were in most cases introduced by the adopted -ray intensities, , an aspect that can be improved if more accurate spectroscopic data become available.
Minor uncertainties arise from the sample masses, which were determined to 0.1 mg, self absorption corrections, and counting statistics. The isotopic compositions also exhibit rather small uncertainties, except for 120Te and 156Dy, where 11.1% and 5.4% are assigned in Ref. De Laeter et al. (2003), respectively (Table 1). Similar to other rare isotopes, i.e. 184Os, 190Pt, or 180Ta, the uncertainties were conservatively treated to ”cover the range of probable isotope-abundance variations among different materials as well as experimental errors” De Laeter et al. (2003). As described in Sec. II we have therefore for 120Te calculated a weighted average of two recent measurements De Laeter (1994); Lee and Halliday (1995) and a corrected value from an older measurement Smith et al. (1978); De Laeter (1994) with a standard deviation of 0.9%.
Summing corrections are another potential source of uncertainties. In the measurements with the single HPGe detector these corrections are small due to the low efficiency and can be completely avoided by selecting cascades with only one strong transition. In case of the measurements with the Clover system, the summing corrections were determined by detailed GEANT simulations Agostinelli et al. (2003) of the complete setup Dababneh et al. (2004). Since these corrections turned out to be rather small (Table IV) the related uncertainties have almost no impact on the final results.
In all cases, the total uncertainties include the 2.0-2.2% uncertainty of the gold measurements.
V Results
In this section, the results of the present work are presented in tabular form with a short discussion of the various measurements. The comparison with previous results will be given in the Sec. VI for the Maxwellian average cross sections calculated on the basis of the measured reported here.
V.1 102Pd(n,)103Pd
Due to the weak transitions the activated samples were counted with the Clover system. The spectra of the Pd samples were analyzed via the ”strongest” transition in 103Rh at 357 keV. The second strongest transition at 497 keV was already too weak and could not be analyzed. The experimental neutron capture cross section is mbarn (Table 6).
| Sample | [mbarn] |
|---|---|
| = 357 keV | |
| pd-1 | 374 18 |
| pd-2 | 357 17 |
| pd-3 | 403 19 |
| Weighted average | 376 17 |
V.2 120Te(n,)121Te
The Te samples were analyzed via the 573 keV -line from the decay of 121Teg into 121Sb. The partial cross section to the isomeric state could be determined only after a waiting time of 80 d, when the large Compton background around 210 keV, which was observed immediately after the irradiation, was sufficiently reduced to reveal the expected 212 keV line from the IT decay to the ground state. The results are 470.622.7 mbarn for the neutron capture cross section to the ground-state and 67.62.9 mbarn for the partial cross section to the isomeric state, leading to a total () cross section of = 538.225.6 mbarn (Table 7).
| Sample | [mbarn] | |
|---|---|---|
| 121Teg | 121Tem | |
| = 573 keV | 212 keV | |
| te-1 | 474.422.9 | 66.62.8 |
| te-2 | 465.522.4 | 70.12.9 |
| te-3 | 484.023.2 | 66.52.8 |
| te-4 | 462.222.3 | 65.72.9 |
| te-5 | 468.222.7 | 69.43.1 |
| Weighted average | 470.622.7 | 67.62.9 |
| Total (n,) cross section | 538.225.6 | |
V.3 130Ba(n,)131Ba
The 130Ba cross section has been measured via the transitions at 216 and 373 keV from the decay into 131Cs. The two strongest transitions, 124 keV (=29.8 (3) %) and 496 keV (=48.0 (4) %), were not used in this analysis because these lines are affected by coincidence summing effects (summing-out into the 620 keV transition). Due to the short isomeric half-life of 14.6 min the partial cross section to the isomer could not be determined. The resulting total experimental cross section is = 73629 mbarn (Table 8).
| Sample | [mbarn] | |
|---|---|---|
| = 216 keV | 373 keV | |
| ba-1 | 724 29 | 737 29 |
| ba-2 | 748 29 | 752 30 |
| ba-3 | 718 27 | 743 29 |
| Weighted average | 736 29 | |
V.4 132Ba(n,)133Ba
For 132Ba the partial cross section to the isomeric state ( h) could be measured in addition to the total (n,) cross section. The latter measurement was performed with the Clover detector because of the long half life of 133Bag ( yr). The partial cross section to the isomer 133Bam was measured via the 276 keV line (99.99% IT) to mbarn. The EC part of the isomeric decay is only 0.0096% and was, therefore, neglected. The total capture cross section of mbarn was determined via the strongest transition in the EC decay to 133Cs at 356.0 keV (Table 9).
| Sample | [mbarn] | |
|---|---|---|
| 133Batot | 133Bam | |
| = 356 keV | 276 keV | |
| ba-1 | 396.015.2 | 32.71.9 |
| ba-2 | 403.915.6 | 39.62.3 |
| ba-3 | 381.813.7 | 35.41.9 |
| Weighted average | 392.814.8 | 35.52.0 |
V.5 156Dy(n,)157Dy
The (n,) cross section of 156Dy was measured via the strongest line in the decay of 157Dy at 326 keV. The uncertainty of the measured value = 1641 117 mbarn (Table 10) is dominated by the contributions from the -ray intensity (3.2%) and from the isotopic abundance (5.4%).
| Sample | [mbarn] |
|---|---|
| = 326 keV | |
| dy-1 | 1669 121 |
| dy-2 | 1638 114 |
| dy-3 | 1619 114 |
| Weighted average | 1641 117 |
V.6 Isomeric ratios
Isomeric ratios
| (6) |
were calculated for 121Te and 133Ba from the measured partial and total (n,) cross sections. The present results at =25 keV are 0.1260.012 and 0.0900.009, respectively. These results are compatible with the thermal values at = 25 meV, which are 0.1450.026 for 121Te and 0.071 for 133Ba Mughabghab et al. (1981); Mughabghab (2006).
VI Maxwellian averaged cross sections
VI.1 General remarks
In an astrophysical environment with temperature , interacting particles are quickly thermalized by collisions in the stellar plasma, and the neutron energy distribution can be described by a Maxwell-Boltzmann spectrum:
| (7) |
The experimental neutron spectrum of the 7Li()7Be reaction simulates the energy dependence of the flux with =25.0 0.5 keV almost perfectly Ratynski and Käppeler (1988). However, the cutoff at = 106 keV and small deviations from the shape of the ideal Maxwellian spectrum require a correction of the measured cross section for obtaining a true Maxwellian average, . This correction is determined by means of the energy-dependent cross sections from data libraries.
VI.2 Evaluated cross sections from data libraries
The corrections for the spectrum differences as well as the extrapolations of the MACS to lower and higher values of were determined with the evaluated energy-dependent cross sections, (En), from the data libraries provided by the online database JANIS 3.0 (”Java-based Nuclear Information Software”, www.nea.fr/janis/) Soppera et al. (2008). The libraries used were the ”Joint Evaluated Fission and Fusion General Purpose File” (JEFF 3.0A and JEFF 3.1, www.nea.fr/html/dbdata/JEFF/), the ”Japanese Evaluated Nuclear Data Library” (JENDL 3.3 Shibata et al. (2002), wwwndc.tokai-sc.jaea.go.jp/jendl/), and the ”Evaluated Nuclear Data File” (ENDF-B/VII.0 Chadwick et al. (2006), www.nndc.bnl.gov/), which are partially based on experimental resonance parameters.
| Isotope | JEFF 3.0A | JEFF 3.1 | JENDL 3.3 | ENDF-B/VII.0 |
|---|---|---|---|---|
| 102Pd | 397 | 397 | 250 | 820 |
| 120Te | – | – | – | – |
| 130Ba | 2030 | 2530 | 2530 | 2800 |
| 132Ba | – | – | – | 130 |
| 156Dy | 101.3 | – | – | 91 |
For the investigated cases, the most recent data for (En) are provided by ENDF-B/VII.0, which makes use of resonance parameters from the latest evaluation Mughabghab (2006). The differences between the four data libraries with respect to the resolved resonance region (RRR) are summarized in Table 11. Table 12 shows that the contributions of the RRR to the respective Maxwellian averaged cross sections for =5-100 keV are almost negligible, except for the lower temperatures in 130Ba, where the RRR reaches up to about 3 keV. In all libraries, the () cross sections in the unresolved resonance region (URR) were obtained by Hauser-Feshbach (HF) calculations. Since this region contributes the most important part to the extrapolation towards the higher temperatures of the -process, it is discussed in more detail.
The Hauser-Feshbach calculations in the JENDL-3.3 evaluations were performed with the statistical model code CASTHY Igarasi and Fukahori (1991) for the isotopes investigated in this work. More specifically, the -ray strength function for 132Ba was adjusted to reproduce the available experimental capture cross section of Ref. Bradley et al. (1979). For JEFF-3.0A, the HF calculations are not documented, and in JEFF-3.1 an unspecified HF prediction with a Moldauer potential was used for 102Pd and 120Te, whereas the CASTHY code was also used for the URR of 130,132Ba. In ENDF/B-VII.0, the URR in 102Pd was obtained with the GNASH code Young et al. (1998), and for 156Dy results from EMPIRE Herman et al. (2007) were used. For 120Te and 130,132Ba the respective URR cross sections from JENDL-3.3 have been adopted also in ENDF/B-VII.0.
| [keV] | 5 | 10 | 15 | 20 | 25 | 30 | 40 | 50 | 60 | 80 | 100 |
|---|---|---|---|---|---|---|---|---|---|---|---|
| 102Pd | |||||||||||
| JEFF 3.0A | 2.5 | 0.9 | 0.5 | 0.3 | 0.3 | 0.2 | 0.1 | 0.1 | 0.1 | 0 | 0 |
| JEFF 3.1 | 2.5 | 0.9 | 0.5 | 0.3 | 0.3 | 0.2 | 0.1 | 0.1 | 0.1 | 0 | 0 |
| JENDL 3.3 | 1.4 | 0.5 | 0.3 | 0.2 | 0.1 | 0.1 | 0.1 | 0 | 0 | 0 | 0 |
| ENDF-B/VII.0 | 4.4 | 1.8 | 1.0 | 0.7 | 0.5 | 0.4 | 0.3 | 0.2 | 0.1 | 0.1 | 0.1 |
| 130Ba | |||||||||||
| JEFF 3.0A | 8.1 | 3.8 | 2.4 | 1.6 | 1.2 | 1.0 | 0.6 | 0.5 | 0.4 | 0.2 | 0.2 |
| JEFF 3.1 | 12.5 | 5.7 | 3.2 | 2.0 | 1.5 | 1.2 | 0.9 | 0.7 | 0.5 | 0.3 | 0.2 |
| JENDL 3.3 | 12.5 | 5.7 | 3.2 | 2.0 | 1.5 | 1.2 | 0.9 | 0.7 | 0.5 | 0.3 | 0.2 |
| ENDF-B/VII.0 | 11.6 | 5.2 | 3.1 | 2.1 | 1.5 | 1.1 | 0.7 | 0.5 | 0.4 | 0.2 | 0.2 |
| 132Ba | |||||||||||
| ENDF-B/VII.0 | 1.5 | 0.5 | 0.3 | 0.2 | 0.1 | 0.1 | 0.1 | 0 | 0 | 0 | 0 |
| 156Dy | |||||||||||
| JEFF 3.0A | 0.7 | 0.3 | 0.2 | 0.1 | 0.1 | 0.1 | 0 | 0 | 0 | 0 | 0 |
| ENDF-B/VII.0 | 0.5 | 0.2 | 0.1 | 0.1 | 0.1 | 0 | 0 | 0 | 0 | 0 | 0 |
VI.3 Calculation of Maxwellian average cross sections
In a first step, the evaluated cross sections were folded with the experimental neutron spectrum. The ratios of the measured cross sections and the corresponding averages of the evaluated data,
| (8) |
are listed in Table 13 for all investigated cases. Since the RRR contributes an almost negligible part to the MACS at higher temperatures, can be used in very good approximation as normalization factor for the URR. This holds even for 130Ba, where the RRR contributes sensibly at lower thermal energies, because in this case the values are very close to unity.
| 102Pd | 120Te | 130Ba | 132Ba | 156Dy | |
|---|---|---|---|---|---|
| JEFF 3.0A | 1.852 | – | 0.990 | 0.870 | 1.069 |
| JEFF 3.1 | 1.852 | 1.263 | 1.024 | 0.869 | – |
| JENDL 3.3 | 0.967 | 1.843 | 1.025 | 0.873 | – |
| ENDF-B/VII.0 | 0.818 | 1.843 | 1.028 | 0.873 | 1.059 |
| NON-SMOKER | 0.985 | 0.978 | 1.019 | 0.840 | 1.518 |
| MOST 2005a | 0.550 | 1.752 | 1.505 | 1.746 | 0.781 |
aIncluding stellar enhancement factors without further specification.
In principle, a full normalization of the evaluated data would change the thermal cross section as well as the resolved resonances. Since these data are (partially) based on experimental information, the contribution from the RRR has been decoupled from the normalization procedure and the MACS were calculated using the RRR contributions listed in Table 12. The contribution from the URR was then determined from the renormalized part of the evaluated cross sections, which consist of theoretical data obtained in HF calculations:
| (9) |
This expression is equivalent to obtaining a Maxwellian average from the energy-differential cross section after only the URR has been modified (Eq. 10). The respective Maxwellian averaged cross sections are
| (10) |
The values for thermal energies between =5 and 100 keV in Table 14 were derived by normalization with the respective factors listed in Table 13. Evaluations yielding the same normalization factors are (obviously) based on the same resonance parameters (see discussion in Sec. VI.2). Additionally the original and normalized values from the recommendations in Bao et al. Bao et al. (2000) are listed in Table 14 for comparison. Note that the previous semi-empirical estimates for 102Pd, 120Te, and 132Ba in the Bao et al. compilation Bao et al. (2000) were based on scaled NON-SMOKER predictions (see Sec. VI.4 for further details).
| [keV] | 5 | 10 | 15 | 20 | 25 | 30 | 40 | 50 | 60 | 80 | 100 |
|---|---|---|---|---|---|---|---|---|---|---|---|
| 102Pd | |||||||||||
| Bao Bao et al. (2000) | 894 | 657 | 540 | 466 | 414 | 375118a | 320 | 283 | 257 | 222 | 199 |
| Bao norm. | 875 | 643 | 529 | 456 | 405 | 36717 | 313 | 277 | 252 | 217 | 195 |
| ENDF/B-VII.0 | 83541 | 61129 | 51124 | 44921 | 40518 | 37117 | 32315 | 29213 | 27012 | 24311 | 22510 |
| JEFF-3.0A/3.1 | 91341 | 65730 | 53424 | 45821 | 40418 | 36516 | 31114 | 27512 | 25011 | 21810 | 1989 |
| JENDL-3.3 | 90536 | 64427 | 52723 | 45520 | 40618 | 37017 | 32115 | 28913 | 26712 | 23911 | 22210 |
| f∗ Rauscher and Thielemann (2000) | 1.000 | 1.000 | 1.000 | 1.000 | 1.000 | 1.000 | 1.000 | 1.000 | 1.000 | 1.003 | 1.011 |
| 120Te | |||||||||||
| Bao Bao et al. (2000) | 1037 | 708 | 578 | 504 | 455 | 420103a | 372 | 341 | 318 | 286 | 263 |
| Bao norm. | 1331 | 909 | 742 | 647 | 584 | 53926 | 477 | 438 | 408 | 367 | 337 |
| ENDF/B-VII.0 | 131958 | 91942 | 74935 | 64931 | 58328 | 53526 | 47222 | 43121 | 40319 | 36818 | 34817 |
| JEFF-3.1 | 121563 | 88044 | 73336 | 64531 | 58528 | 54026 | 47822 | 43621 | 40719 | 36818 | 34517 |
| JENDL-3.3 | 131958 | 91942 | 74935 | 64931 | 58328 | 53526 | 47222 | 43121 | 40319 | 36818 | 34817 |
| f∗ Rauscher and Thielemann (2000) | 1.000 | 1.000 | 1.000 | 1.000 | 1.000 | 1.000 | 1.000 | 1.000 | 1.000 | 1.003 | 1.010 |
| 130Ba | |||||||||||
| Bao Bao et al. (2000) | 2379 | 1284 | 1031 | 901 | 818 | 760110 | 683 | 634 | 601 | 556 | 526 |
| Bao norm. | 2333 | 1259 | 1011 | 884 | 802 | 74529 | 670 | 622 | 589 | 545 | 516 |
| ENDF/B-VII.0 | 160067 | 116345 | 97938 | 87434 | 80531 | 75629 | 68727 | 64225 | 61024 | 56822 | 54221 |
| JEFF-3.0/A | 186264 | 129145 | 104038 | 89434 | 79731 | 72829 | 63527 | 57525 | 53224 | 47022 | 42521 |
| JEFF-3.1 | 163469 | 117145 | 98238 | 87434 | 80431 | 75429 | 68627 | 64025 | 60824 | 56622 | 54021 |
| JENDL-3.3 | 163469 | 117145 | 98238 | 87434 | 80431 | 75429 | 68627 | 64025 | 60824 | 56622 | 54021 |
| f∗ Rauscher and Thielemann (2000) | 1.000 | 1.000 | 1.000 | 1.000 | 1.000 | 1.000 | 1.000 | 1.002 | 1.006 | 1.024 | 1.056 |
| 132Ba | |||||||||||
| Bao Bao et al. (2000) | 1029 | 659 | 526 | 455 | 410 | 379137a | 339 | 315 | 298 | 276 | 261 |
| Bao norm. | 1070 | 685 | 547 | 473 | 426 | 39415 | 353 | 328 | 310 | 287 | 271 |
| ENDF/B-VII.0 | 92935 | 64124 | 53020 | 46818 | 42716 | 39815 | 35814 | 33113 | 31312 | 29011 | 27711 |
| JEFF-3.0A/3.1 | 91535 | 63724 | 52820 | 46718 | 42616 | 39715 | 35714 | 33113 | 31212 | 29011 | 27611 |
| JENDL-3.3 | 91535 | 63724 | 52820 | 46718 | 42616 | 39715 | 35714 | 33113 | 31212 | 29011 | 27611 |
| f∗ Rauscher and Thielemann (2000) | 1.000 | 1.000 | 1.000 | 1.000 | 1.000 | 1.000 | 1.000 | 1.001 | 1.004 | 1.018 | 1.040 |
| 156Dy | |||||||||||
| Bao Bao et al. (2000) | 5442 | 2712 | 2126 | 1850 | 1682 | 1567145 | 1412 | 1307 | 1229 | 1117 | 1039 |
| Bao norm. | 5742 | 2862 | 2243 | 1952 | 1775 | 1653118 | 1490 | 1379 | 1297 | 1179 | 1096 |
| ENDF/B-VII.0 | 4742336 | 3012214 | 2355168 | 2001143 | 1775126 | 1616115 | 1408100 | 127491 | 118084 | 105275 | 96869 |
| JEFF-3.0A | 4060288 | 2710193 | 2216158 | 1948139 | 1775126 | 1651118 | 1478105 | 135997 | 126991 | 114281 | 105675 |
| f∗ Rauscher and Thielemann (2000) | 1.000 | 1.000 | 1.001 | 1.007 | 1.022 | 1.046 | 1.106 | 1.163 | 1.210 | 1.283 | 1.341 |
a Semi-empirical estimates.
As can be seen in Table 14 extrapolation to lower or higher energies reveal large differences. For this reason we cannot recommend one or the other evaluation in this paper and leave it to the reader which energy dependence to use.
The uncertainties given for the evaluations were derived from Eq. 9. For the contribution of the RRR we assumed a conservative uncertainty of 20%. The uncertainty of each data point in the evaluation is not provided, so must be set to 0 and is defined as . is the uncertainty of the URR which is based on Hauser-Feshbach predictions. The estimate for this uncertainty is even more difficult, but could be done in principle by comparing different Hauser-Feshbach models which use different input parameters, as in our cases (see discussion in Sec. VI.2). The large deviations among the different evaluations towards higher energies reflect the influence of the input parameters, but for the individual evaluations we set =0. Thus the quoted total uncertainty is
| (11) |
In view of the remaining uncertainties, in particular at higher neutron energies, time-of-flight (TOF) data with experimental uncertainties are needed to replace the present extrapolations.
Since experimentally determined cross sections refer only to target nuclei in their ground states, the effective stellar cross sections have to be corrected for the fact that low-lying excited nuclear states can be thermally populated in the hot stellar photon bath. This is achieved by introducing the stellar enhancement factor (Eq. 12)
| (12) |
where the stellar cross section
| (13) |
accounts for the transitions of thermally populated target states to all possible final states , whereas the laboratory cross section only includes the ground state of the target nuclei. The stellar enhancement factors are tabulated, e.g., in Refs. Rauscher and Thielemann (2000); Rauscher (2009); Bao et al. (2000), and can increase strongly with temperature. While the values remain close to unity under typical -process conditions, they become significantly larger at the higher temperatures of the -process (Table 16).
VI.4 Comparison of 30 keV MACS with previous data
The comparison with previous recommendations Bao et al. (2000); Allen et al. (1971), experimental data Bradley et al. (1979); Beer (1985), and theoretical predictions Holmes et al. (1976); Harris (1981); Zhao et al. (1988); Rauscher and Thielemann (2000); Goriely (2005) is summarized in Table 15 for the MACS at keV.
| Reference | 102Pd | 120Te | 130Ba | 132Ba | 156Dy |
|---|---|---|---|---|---|
| Bao norm. | 36717 | 53926 | 74529 | 39415 | 1653118 |
| ENDF/B-VII.0 | 37117 | 53526 | 75629 | 39815 | 1616115 |
| JEFF-3.0A | 36516 | – | 72829 | 39715 | 1651118 |
| JEFF-3.1 | 36516 | 54026 | 75429 | 39715 | – |
| JENDL-3.3 | 37017 | 53526 | 75429 | 39715 | – |
| Experimental data | |||||
| Bradley et al. Bradley et al. (1979) | – | – | 76162 | – | – |
| Beer Beer (1985) | – | – | – | – | 1589145 |
| Recommended data in compilations | |||||
| Bao et al. Bao et al. (2000) | 375118a | 420103a | 760110 | 379137a | 1567145 |
| Allen Allen et al. (1971) | 320 | 400 | 2000 | 650 | 870 |
| Theoretical predictions | |||||
| Holmes et al. Holmes et al. (1976) | 247 | 275 | 397 | 250 | 1840 |
| Harris Harris (1981) | 363 | 776 | 1012 | 442 | 1637 |
| Zhao et al. Zhao et al. (1988) | 13745 | 29396 | – | 28092 | 850280 |
| NON-SMOKER Rauscher and Thielemann (2000) | 323 | 506 | 605 | 374 | 1190 |
| MOST Goriely (2005)b | 665 | 307 | 490 | 227 | 2126 |
a Semi-empirical estimates.
b Includes unspecified stellar enhancement factors.
The cross sections of 102Pd, 120Te, and 132Ba had not been measured in the stellar energy range so far. Therefore, the recommended cross sections in the compilation of Bao et al. Bao et al. (2000) are semi-empirical estimates, using NON-SMOKER results Rauscher and Thielemann (2000) normalized to the local cross section systematics of neighboring nuclei.
The only previous experimental value for 130Ba in the keV region was measured with a filtered neutron beam of keV Bradley et al. (1979). The result of mbarn was transformed into a MACS at keV of 761 mbarn Bao et al. (2000), in good agreement with the more accurate value of this work.
Also for 156Dy a previous measurement has been reported Beer (1985) that was performed with the same activation technique used here, but only a single activation had been made and the result was given as a preliminary value. Nevertheless, there is fair agreement with the result obtained in the present series of activations.
The measurements cover a considerable mass range and consider nuclei with different properties which makes a comparison to predictions interesting but difficult to interpret. The NON-SMOKER predictions for 102Pd, 120Te, 130Ba, and – to some extent – for 132Ba have been confirmed by the experimental results, but the prediction for 156Dy is too low by 28%, similar to the situation for 160Dy. These isotopes are strongly deformed but so are the heavier, stable Dy isotopes. Since the level density of the proton-rich isotopes is high one might expect that the Hauser-Feshbach model would be more reliable. Accordingly, the HF parameterization has to be checked in these cases. The contribution of single resonances, implicitly included in the measurement of the MACS, may be stronger than predicted by the Hauser-Feshbach approach.
The predictions from MOST had to be derived from the stellar reaction rates given in Ref. Goriely (2005), which already include unspecified stellar enhancement factors (see Eq. 12). These factors should be close to unity for =30 keV. The values from MOST Goriely (2005) show significant deviations from the measured data for all considered nuclei, ranging from as much as -45% for 102Pd to +75% for 132Ba at keV.
VI.5 Extrapolation to -process energies
Maxwellian averaged cross sections are also needed at the higher temperatures of the -process of GK, corresponding to thermal energies of keV. Using the energy-dependencies of the normalized evaluated cross sections discussed before, this extrapolation yields the MACS listed in Table 16. In this energy range any contributions from the RRR are completely negligible but the uncertainties introduced by the extrapolation become significant.
| [keV] | 170 | 215 | 260 |
|---|---|---|---|
| 102Pd | |||
| ENDF/B-VII.0 | 1919 | 1778 | 1688 |
| JEFF-3.0A/3.1 | 1647 | 1517 | 1416 |
| JENDL-3.3 | 1929 | 1828 | 1738 |
| f∗ Rauscher and Thielemann (2000) | 1.11 | 1.19 | 1.27 |
| 120Te | |||
| ENDF/B-VII.0 / JENDL-3.3 | 31115 | 29614 | 28414 |
| JEFF-3.1 | 30415 | 29114 | 28114 |
| f∗ Rauscher and Thielemann (2000) | 1.10 | 1.18 | 1.25 |
| 130Ba | |||
| ENDF/B-VII.0 | 50520 | 50020 | 50320 |
| JEFF-3.0A | 32320 | 28020 | 24820 |
| JEFF-3.1/JENDL-3.3 | 50420 | 49920 | 50120 |
| f∗ Rauscher and Thielemann (2000) | 1.23 | 1.35 | 1.42 |
| 132Ba | |||
| Evaluations | 25810 | 25410 | 25310 |
| f∗ Rauscher and Thielemann (2000) | 1.16 | 1.23 | 1.28 |
| 156Dy | |||
| ENDF/B-VII.0 | 81958 | 77255 | 73853 |
| JEFF-3.0A | 89564 | 84160 | 80257 |
| f∗ Rauscher and Thielemann (2000) | 1.50 | 1.55 | 1.56 |
The stellar reaction rate can be determined via
| (14) |
with being the reduced mass, the stellar enhancement factor (Eq. 12), and the Avogadro constant. With the given numerical prefactor, the units for the MACS, , the thermal energy , and the reaction rate NA are [mbarn], [keV], and [cm3 mole-1 s-1], respectively.
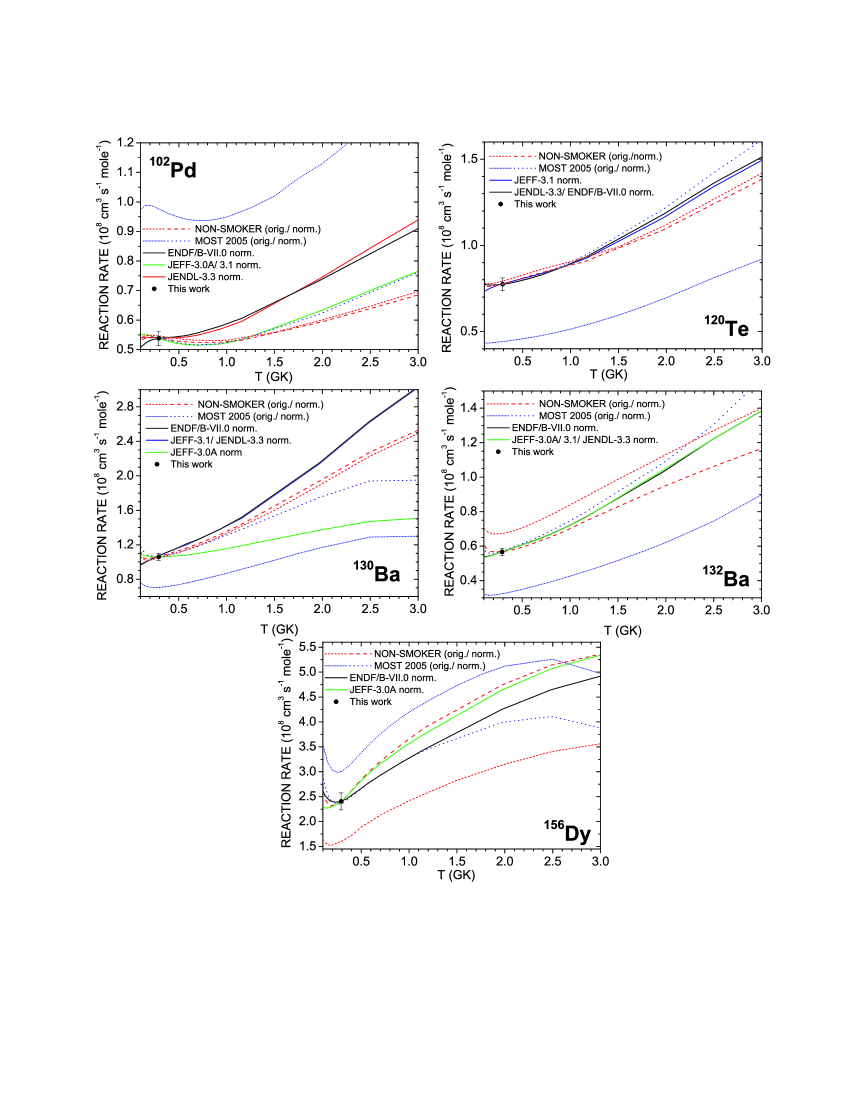
A comparison between the normalized values from this work and the predictions of NON-SMOKER Rauscher and Thielemann (2000); Rauscher (2009) and MOST Goriely (2005) is shown in Fig. 4. As can be seen and was already mentioned before, the individual evaluated data sets increasingly deviate the further the energy is from the normalization point at kT=25 keV (T=0.29 GK).
Although the MOST results include the stellar enhancement factors, it is only a small correction at 25 keV as can be seen in Table 14. It has to be emphasized again that the comparison for energies keV is actually a comparison with weighted Hauser-Feshbach predictions which are implicitly contained in the databases (see the discussion in Sec. VI.2) and this way entering our extrapolation.
Therefore, Fig. 4 also illustrates the necessity for cross section measurements with the time-of-flight method over a wider energy range from the resonance region up to about 1 MeV, in particular for nuclei involved in the -process network. Unfortunately, this will be hard to achieve, mostly because isotopically pure samples of the rare -isotopes are difficult to obtain.
VII Summary and Outlook
The (n,) cross sections of the -isotopes 102Pd, 120Te, 130,132Ba, and 156Dy have been measured in a quasi-stellar neutron spectrum corresponding to a thermal energy of keV by means of the activation technique. The results for 102Pd, 120Te, and 132Ba represent the first experimental data, thus replacing rather uncertain theoretical predictions. For 130Ba and 156Dy the previously available experimental information could be significantly extended and improved. The measured cross sections were converted into Maxwellian averaged cross sections for a range of thermal energies between and 100 keV, and further extrapolated to the temperature region of the -process. The extrapolation still relies on theory and this underscores the necessity for future measurements covering a wider energy range.
The present work will be complemented by a second paper on the () cross sections of 168Yb, 180W, 184Os, 190Pt, and 196Hg, followed by a discussion of the astrophysical implications in a third, concluding paper.
Acknowledgements.
We thank M. Brock, E. P. Knaetsch, D. Roller, and W. Seith for their help and support during the irradiations at the Van de Graaff accelerator. This work was supported by the Swiss National Science Foundation Grants 2024-067428.01 and 2000-105328.References
- Burbidge et al. (1957) E. Burbidge, G. Burbidge, W. Fowler, and F. Hoyle, Rev. Mod. Phys. 29, 547 (1957).
- Langanke and Wiescher (2001) K. Langanke and M. Wiescher, Rep. Prog. Phys. 64, 1657 (2001).
- Woosley and Howard (1978) S. Woosley and W. Howard, Astrophys. J. Suppl. 36, 285 (1978).
- Woosley and Howard (1990) S. Woosley and W. Howard, Astrophys. J. 354, L21 (1990).
- Rayet et al. (1995) M. Rayet, M. Arnould, M. Hashimoto, N. Prantzos, and K. Nomoto, Astron. Astrophys. 298, 517 (1995).
- Rauscher et al. (2002) T. Rauscher, A. Heger, R. Hoffman, and S. Woosley, Astrophys. J. 576, 323 (2002).
- Rayet et al. (1990) M. Rayet, M. Arnould, and N. Prantzos, Astron. Astrophys. 227, 271 (1990).
- Fröhlich et al. (2006) C. Fröhlich, G. Martínez-Pinedo, M. Liebendörfer, F.-K. Thielemann, E. Bravo, W. R. Hix, K. Langanke, and N. T. Zinner, Phys. Rev. Lett. 96, 142502 (2006).
- Schatz et al. (1998) H. Schatz, A. Aprahamian, J. Görres, M. Wiescher, T. Rauscher, J. Rembges, F.-K. Thielemann, B. Pfeiffer, P. Möller, H. Herndl, et al., Phys. Rep. 294, 167 (1998).
- Schatz et al. (2001) H. Schatz, A. Aprahamian, V. Barnard, L. Bildsten, A. Cumming, M. Ouellette, T. Rauscher, F.-K. Thielemann, and M. Wiescher, Phys. Rev. Lett. 86, 3471 (2001).
- Woosley et al. (1990) S. Woosley, D. Hartmann, R. Hoffman, and W. Haxton, Astrophys. J. 356, 272 (1990).
- Arnould and Goriely (2003) M. Arnould and S. Goriely, Phys. Rep. 384, 1 (2003).
- Dillmann et al. (2006) I. Dillmann, M. Heil, F. Käppeler, T. Rauscher, and F.-K. Thielemann, Phys. Rev. C 73, 015803 (2006).
- Vockenhuber et al. (2007) C. Vockenhuber, I. Dillmann, M. Heil, F. Käppeler, N. Winckler, W. Kutschera, A. Wallner, M. Bichler, S. Dababneh, S. Bisterzo, et al., Phys. Rev. C 75, 015804 (2007).
- Dillmann et al. (2005) I. Dillmann, M. Heil, F. Käppeler, R. Plag, T. Rauscher, and F.-K. Thielemann, Proceedings of the 12th Int. Conference on Capture Gamma-Ray Spectroscopy and Related Topcis, Notre Dame/USA, Sept. 4-9, 2005, AIP Conf. Proc 819, 123 (2005).
- Hauser and Feshbach (1952) W. Hauser and H. Feshbach, Phys. Rev. 87, 366 (1952).
- Rauscher and Thielemann (2000) T. Rauscher and F.-K. Thielemann, At. Data Nucl. Data Tables 75, 1 (2000).
- Rauscher and Thielemann (2001) T. Rauscher and F.-K. Thielemann, At. Data Nucl. Data Tables 79, 47 (2001).
- Goriely (2005) S. Goriely, Hauser-Feshbach rates for neutron capture reactions (version 08/26/05), http://www-astro.ulb.ac.be/Html/hfr.html (2005).
- Beer and Käppeler (1980) H. Beer and F. Käppeler, Phys. Rev. C 21, 534 (1980).
- Ratynski and Käppeler (1988) W. Ratynski and F. Käppeler, Phys. Rev. C 37, 595 (1988).
- De Laeter et al. (2003) J. De Laeter, J. Böhlke, P. de Bievre, H. Hidaka, H. Peiser, K. Rosman, and P. Taylor, Pure and Appl. Chem. 75, 683 (2003).
- Smith et al. (1978) C. Smith, K. Rosman, and J. De Laeter, Int. J. Mass Spectrom. Ion Phys. 28, 7 (1978).
- De Laeter (1994) J. De Laeter, Astrophys. J. 434, 695 (1994).
- Lee and Halliday (1995) D.-C. Lee and A. Halliday, Int. J. Mass Spectrom. Ion Proc. 146/147, 35 (1995).
- Dababneh et al. (2004) S. Dababneh, N. Patronis, P. Assimakopoulos, J. Görres, M. Heil, F. Käppeler, D. Karamanis, S. O’Brien, and R. Reifarth, Nucl. Instr. and Meth. A 517, 230 (2004).
- de Frenne and Jacobs (2001) D. de Frenne and E. Jacobs, Nucl. Data Sheets 93, 447 (2001).
- Tamura (2000) T. Tamura, Nucl. Data Sheets 90, 107 (2000).
- Khazov et al. (2006) Y. Khazov, I. Mitropolsky, and A. Rodionov, Nucl. Data Sheets 1072, 2715 (2006).
- Shaheen (1995) R. Shaheen, Nucl. Data Sheets 75, 491 (1995).
- Helmer (2004) R. Helmer, Nucl. Data Sheets 103, 565 (2004).
- Chunmei (2002) Z. Chunmei, Nucl. Data Sheets 95, 59 (2002).
- Hubbell and Seltzer (2004) J. Hubbell and S. Seltzer, Table of X-Ray Mass Attenuation Coefficients and Mass Energy-Absorption Coefficients (v. 1.4), National Institute of Standards and Technology, Gaithersburg, MD ; http://physics.nist.gov/PhysRefData/XrayMassCoef/ (2004).
- Agostinelli et al. (2003) S. Agostinelli, J. Allison, K. Amako, J. Apostolakis, H. Araujo, P. Arce, M. Asai, D. Axen, S. Banerjee, G. Barrand, et al., Nucl. Instr. Meth. A 506, 250 (2003).
- Mughabghab et al. (1981) S. Mughabghab, M. Divadeenam, and N. Holden, Neutron Cross Sections, BNL-325, 1st ed., 1 (1981).
- Mughabghab (2006) S. Mughabghab, Atlas of Neutron Resonances (5th ed.), Elsevier, ISBN 0-444-52035-X (2006).
- Soppera et al. (2008) N. Soppera, M. Bossant, H. Henriksson, P. Nagel, and Y. Rugama, International Conference on Nuclear Data for Science and Technology, Nice/ France 2007, edts. O. Bersillon, F. Gunsing, E. Bauge, R. Jacqmin, S. Leray, EDP Sciences, ISBN: 978-2-7598-0091-9 p. 773 (2008).
- Shibata et al. (2002) K. Shibata, T. Kawano, and T. Nakagawa, Japanese Evaluated Nuclear Data Library Version 3 Revision 3: JENDL 3.3, J. Nucl. Sci. Technol. 39, 1125 (2002).
- Chadwick et al. (2006) M. Chadwick, P. Oblozinsk , M. Herman, N. Greene, R. McKnight, D. Smith, P. Young, R. MacFarlane, G. Hale, S. Frankle, et al., Nuclear Data Sheets 107, 2931 (2006).
- Igarasi and Fukahori (1991) S. Igarasi and T. Fukahori, JAERI 1321 (1991).
- Bradley et al. (1979) T. Bradley, Z. Parsa, M. Stelts, and R. Chrien, Nuclear Cross Sections for Technology, edt. by J.L. Fowler, C.H. Johnson, and C.D. Bowman (National Bureau of Standards, Washington D.C.) p. 344 (1979).
- Young et al. (1998) P. Young, V. Arthur, and M. Chadwick, Proceedings of the IAEA Workshop on Nuclear Reaction Data and Nuclear Reactors: Physics, Design and Safety, edt. by A. Gandini and G. Reffo, Trieste/Italy, 1996, World Scientific Publishing, Ltd., Singapore p. 227 (1998).
- Herman et al. (2007) M. Herman, R. Capote, B. Carlson, P. Obložinský, M. Sin, A. Trkov, H. Wienke, and V. Zerkin, Nucl. Data Sheets 108, 2655 (2007).
- Rauscher (2009) T. Rauscher, HTML Interface to NON-SMOKER; Online: http://nucastro.org/nonsmoker (2009).
- Bao et al. (2000) Z. Bao, H. Beer, F. Käppeler, F. Voss, K. Wisshak, and T. Rauscher, At. Data Nucl. Data Tables 76, 70 (2000).
- Allen et al. (1971) B. Allen, J. Gibbons, and R. Macklin, Adv. Nucl. Phys. 4, 205 (1971).
- Beer (1985) H. Beer, Technical report KfK-3969, Kernforschungszentrum Karlsruhe p. 14 (1985).
- Holmes et al. (1976) J. Holmes, S. Woosley, W. Fowler, and B. Zimmerman, At. Data Nucl. Data Tables 18, 305 (1976).
- Harris (1981) M. Harris, Astrophys. Space Sci. 77, 357 (1981).
- Zhao et al. (1988) Z. Zhao, D. Zhou, and D. Cai, Nuclear Data for Science and Technology, edts. S. Igarasi (Saikon, Tokyo) p. 513 (1988).