A High Spatial Resolution Mid-Infrared Spectroscopic Study of the Nuclei and Star-Forming Regions in Luminous Infrared Galaxies
Abstract
We present a high spatial (diffraction-limited) resolution (0.3″) mid-infrared (MIR) spectroscopic study of the nuclei and star-forming regions of 4 local luminous infrared galaxies (LIRGs) using T-ReCS on the Gemini South telescope. We investigate the spatial variations of the features seen in the -band spectra of LIRGs on scales of 100 pc, which allow us to resolve their nuclear regions and separate the AGN emission from that of the star formation (SF). We compare (qualitatively and quantitatively) our Gemini T-ReCS nuclear and integrated spectra of LIRGs with those obtained with Spitzer IRS. Star-forming regions and AGNs show distinct features in the MIR spectra, and we spatially separate these, which is not possible using the Spitzer data. The 9.7 silicate absorption feature is weaker in the nuclei of the LIRGs than in the surrounding regions. This is probably due to the either clumpy or compact environment of the central AGN or young, nuclear starburst. We find that the [Ne ii]12.81 µm luminosity surface density is tightly and directly correlated with that of Pa for the LIRG star-forming regions (slope of 1.000.02). Although the 11.3 µm PAH feature shows also a trend with Pa, this is not common for all the regions and the slope is significantly lower. We also find that the [Ne ii]12.81 µm/Pa ratio does not depend on the Pa equivalent width (EW), i.e., on the age of the ionizing stellar populations, suggesting that, on the scales probed here, the [Ne ii]12.81 µm emission line is a good tracer of the SF activity in LIRGs. On the other hand, the 11.3 µm PAH/Pa ratio increases for smaller values of the Pa EW (increasing ages), indicating that the 11.3 µm PAH feature can also be excited by older stars than those responsible for the Pa emission. Finally, more data are needed in order to address the different physical processes (age of the stellar populations, hardness and intensity of the radiation field, mass of the star-forming regions) affecting the energetics of the PAH features in a statistical way. Additional high spatial resolution observations are essential to investigate the star formation in local LIRGs at the smallest scales and to probe ultimately whether they share the same physical properties as high- LIRGs, ULIRGs and submillimiter galaxies and therefore belong to the same galaxy population.
Subject headings:
galaxies: nuclei — galaxies: star clusters — galaxies: starburst — infrared: galaxies1. Introduction
The monochromatic mid-infrared (MIR) emission (8 and 24: Wu et al. 2005; Calzetti et al. 2007; Alonso-Herrero et al. 2006b), as well as several MIR features such as the neon forbidden emission lines ([Ne ii]12.81 µm and/or [Ne iii]15.55 µm: Roche et al. 1991; Ho & Keto 2007) are known to be related to the global (integrated) star formation in starburst and luminous infrared galaxies (LIRGs, 1010). The [Ne ii]12.81 µm line emission is also correlated with the number of ionizing photons in starburst galaxies, LIRGs and star-forming regions and therefore there is also a direct relation between the [Ne ii]12.81 µm flux and the star formation rate (SFR) (Roche et al. 1991), although the relative abundance of Ne + and Ne ++ ions should be taken into account (Ho & Keto 2007).
The presence of polycyclic aromatic hydrocarbons (PAHs, for example the 6.2, 7.7 and 11.3 features) has largely been associated to regions of star formation (from ground-based studies: Roche et al. 1991; to studies based on ISO: Genzel et al. 1998; Lutz et al. 1998b; Rigopoulou et al. 1999; and Spitzer observations: Brandl et al. 2006; Beirão et al. 2006; Smith et al. 2007; Desai et al. 2007; Houck et al. 2007; Farrah et al. 2007) and, in particular, to their photo-dissociation regions (PDRs) (Peeters et al. 2004; Povich et al. 2007). However, recent works have suggested that the infrared (IR) luminosities of star-forming galaxies, as estimated using their PAH emission, should be taken with caution. For instance, the PAH ratios can vary by up to an order of magnitude among Galactic star-forming regions, Magellanic H ii regions, and galaxies (Galliano et al. 2008), and the PAH emission relative to the total IR emission may change from galaxy to galaxy (Smith et al. 2007). Additionally, the PAH emission appears to better trace recent rather than current, massive star formation (Peeters et al. 2004). PAHs also have an interstellar origin and it has been demonstrated that their emission is more extended than that of hydrogen line emission, which is more compact and probe mainly the ionizing stellar populations (Alonso-Herrero et al. 2006b; Díaz-Santos et al. 2008). Furthermore, recently PAH features have been detected in the spectra of a significant number of local dusty elliptical galaxies (Kaneda et al. 2008).
The local physical environment in which the star formation is taking place can also affect the PAH emission. The metallicity, the properties of the dust, and the intensity and hardness of the radiation field can alter the ratios among the PAH features and modify the absolute amount of PAH emission generated by the star-forming regions (Wu et al. 2006; Engelbracht et al. 2008; Gordon et al. 2008). Moreover, there is some evidence that the PAH molecules might be destroyed not only by the harsh radiation field of an AGN (Wu et al. 2007) but also by that of a young star-forming region if the PAH carriers are sufficiently close to the source (Mason et al. 2007). On the other hand, PAH emission has been detected in the vicinity of AGNs (e.g., Circinus, Roche et al. 2007; NGC 1068, Mason et al. 2006).
MIR observations of high redshift LIRGs, ULIRGs and submillimiter galaxies (SMGs) suggest that the star formation in these galaxies is extended over several kpcs (Farrah et al. 2008; Menéndez-Delmestre et al. 2009). In turn, a significant fraction of the star formation taking place in local (U)LIRGs is, however, mostly confined to their nuclei, within the inner few kpcs (e.g., Gallais et al. 2004; Egami et al. 2006; García-Marín et al. 2006; Alonso-Herrero et al. 2006a; Díaz-Santos et al. 2007, 2008; Alonso-Herrero et al. 2009a). Besides, the fact that the star-forming regions from where the MIR emission arises are very compact (hundred of pc or less), prevents us from spatially resolving them in individual sources using current space-based observations (IRAS, ISO or even Spitzer). In this paper we present high spatial (sub-arcsecond, FWHM0.3″) resolution ground-based MIR spectroscopy of 4 local LIRGs (NGC 3256, IC 4518W, NGC 5135 and NGC 7130), in which star formation and AGN activity are isolated or mixed on different spatial scales. Using the spectral features found in the -band () Gemini T-ReCS spectra of these LIRGs, we characterize the nature and properties of their energy sources and perform a detailed study of the star formation in these galaxies on scales of a few hundreds of pc. The organization of this paper is as follows. In §2 we present the MIR observations and the data reduction; in §3 we present the complementary data at MIR and other wavelengths; §4 regards the analysis of the data; in §5 we compare the MIR spectra of the LIRGs at different spatial scales; in §6 we examine the strength and spatial variations of the 9.7 silicate feature in the nuclear region of the galaxies; in §7 we explore the use of the [Ne ii]12.81 µm emission line as reliable tracer of the SFR at scales of a few hundreds of pc and in §8 we study the effect of the intensity and hardness of the radiation field in the emission of the 11.3 µm PAH feature; finally, in §9 we summarize the main results obtained in this paper. Additionally, in the Appendix we analyze the spatial profiles of the fluxes of the main -band spectral features and give detailed information about the specific results found for each LIRG.
2. MIR Spectroscopy at Sub-arcsecond Scales
We selected 4 galaxies from the sample of local LIRGs of Alonso-Herrero et al. (2006b): NGC 3256, IC 4518W, NGC 5135 and NGC 7130. The galaxies were chosen to cover a variety of morphologies (compact/extended) and to include star-forming processes and AGN activity in various environments and mixed on different physical scales. In Table 1 we summarize the main properties of these LIRGs.
| Galaxy | z | Dist | log | Type | 12+log(O/H) |
|---|---|---|---|---|---|
| name | [Mpc] | [] | |||
| (1) | (2) | (3) | (4) | (5) | (6) |
| NGC 3256 | 0.00935 | 40.4 | 11.67 | H ii | 8.8 |
| IC 4518W | 0.01573 | 68.2 | 11.09 | Sy2 | 8.6 |
| NGC 5135 | 0.01369 | 59.3 | 11.27 | Sy2 | 8.7 |
| NGC 7130 | 0.01615 | 70.1 | 11.39 | L/Sy | 8.8 |
Note. — (1) Galaxy name; (2) Redshift (from NED); (3) Distance as obtained with the cosmology: , , ; (4) Infrared luminosity () as computed from IRAS fluxes (Sanders et al. 2003) and using the prospect given in (Sanders & Mirabel 1996); their Table 1); (5) Nuclear activity of the galaxy; (6) Oxygen abundances (see Díaz-Santos et al. 2008 and references therein).
2.1. High spatial Resolution T-ReCS -band Observations
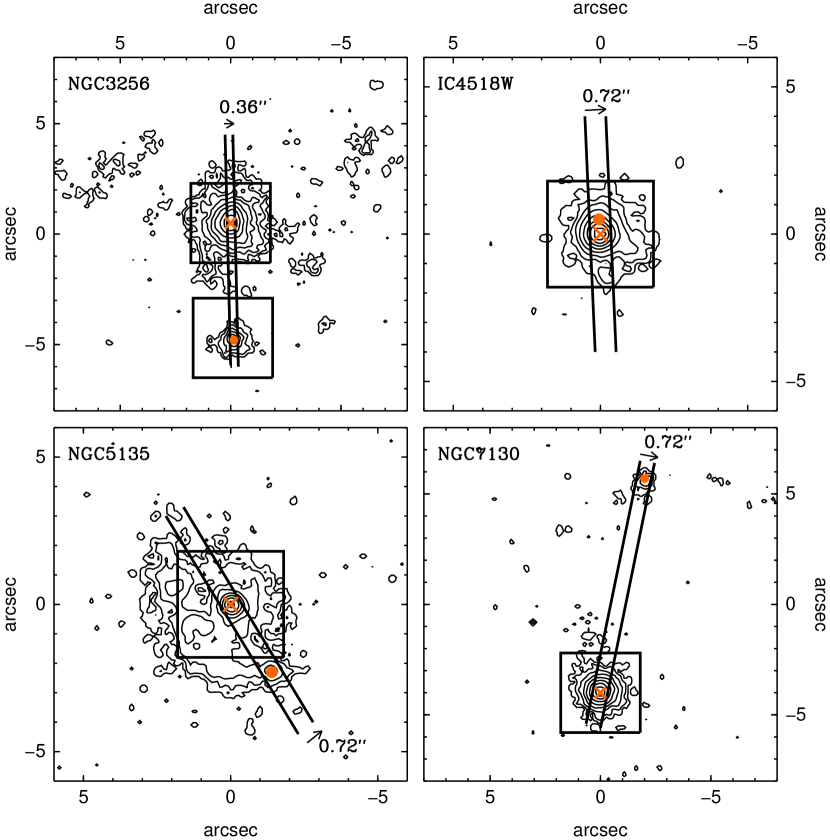
We obtained -band, low-resolution (from at to at ), long-slit spectroscopy of the 4 LIRGs mentioned above with T-ReCS on the 8.1 m Gemini South telescope. The observations were carried out during 2005 and 2006 under programs GS-2005B-Q-10, GS-2006A-Q-7 and GS-2006A-DD-15 (PI: Packham). T-ReCS has a pixel detector with a plate scale of 0.09″, which provides a field of view of . We used a slit width of 0.72″ for NGC 5135, IC 4518W, and NGC 7130, and of 0.36″ for NGC 3256. The slits were placed to cover the nucleus of the galaxies as well as some regions of interest (see Figure 1, orange crosses and dots, respectively).
The observations were obtained in a standard chop-nod strategy to remove the time-variable sky background, telescope thermal emission, and the 1/f detector noise (see also Packham et al. 2005). The chop throw was 15″ and perpendicular to the slit. The observations were scheduled to be done in a single night but they were divided in various datasets to avoid observing problems or a sudden change in weather conditions.
We observed two Cohen standard stars (Cohen et al. 1999) for each galaxy to obtain the wavelength and absolute-flux calibration of the spectra. The standard star observations were taken with the same instrument configuration and immediately before and after the target to minimize the uncertainties in the photometric calibration. The standard stars were chosen to have similar air-masses as the galaxies at the time of the observations. In order to place the slit along the regions of interest, the instrument was rotated accordingly. The standard stars were observed with the same configuration.
Details about the integration times and the final useful data available for each galaxy after discarding chop/nod pairs affected by noise are given in Table 2.
| Galaxy | Slit width | Date | Seeing | |
|---|---|---|---|---|
| name | [″] | [s] | [″] | |
| (1) | (2) | (3) | (4) | (5) |
| NGC 3256 | 0.36″ | 1800 | 2006/03/07 | 0.35″ |
| IC 4518W | 0.72″ | 1900 | 2006/04/17 | 0.36″ |
| NGC 5135 | 0.72″ | 633 | 2006/03/06 | 0.30″ |
| 0.72″ | 1267 | 2006/03/10 | 0.29″ | |
| NGC 7130 | 0.72″ | 490 | 2005/09/18 | 0.37″ |
| 0.72″ | 760* | 2006/06/04 | 0.30″ | |
| 0.72″ | 633 | 2006/08/29 | 0.36″ | |
| 0.72″ | 1267* | 2006/09/16 | 0.33″ | |
| 0.72″ | 1267 | 2006/09/25 | 0.40″ |
Note. — Note.– (1) Galaxy; (2) Slit width; (3) Useful on-source integration time; in the observations marked with an asterisk, only the spectrum of the nucleus (i.e., not including the H ii region) was obtained; (4) Date(s) of the observations (YYYY/MM/DD); (5) Mean seeing (FWHM of the reference standard star(s) observed right before and/or after the target) throughout each night of observations.
2.2. Data Reduction And Photometric Calibration
2.2.1 Obtaining the 2-D Spectra
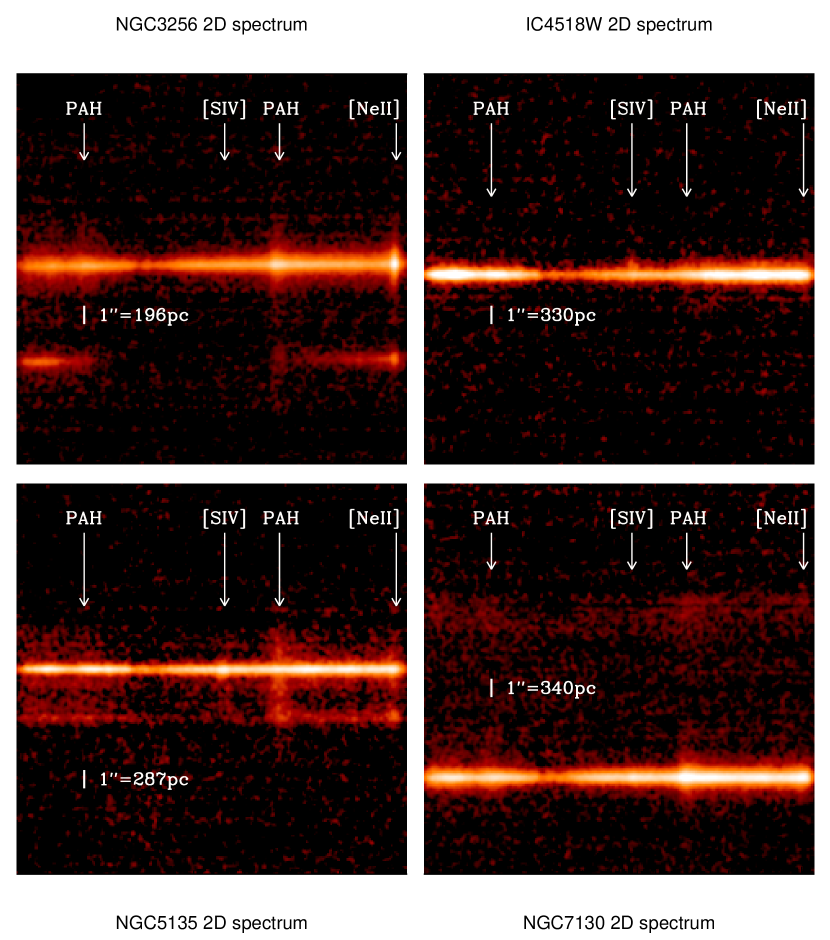
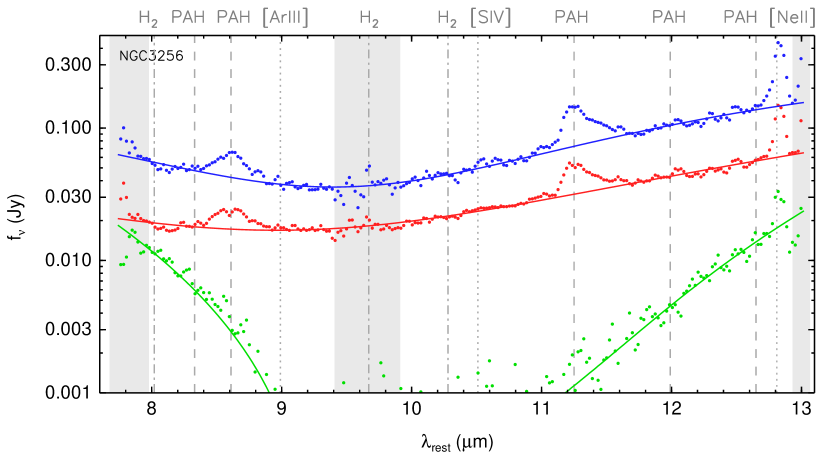
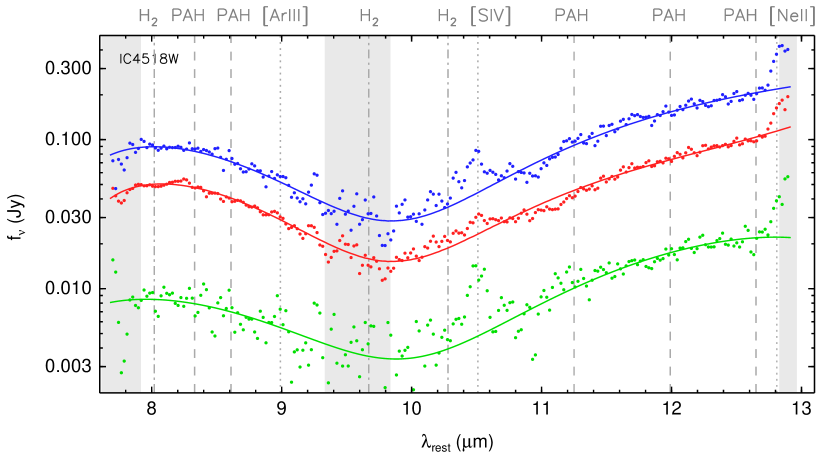
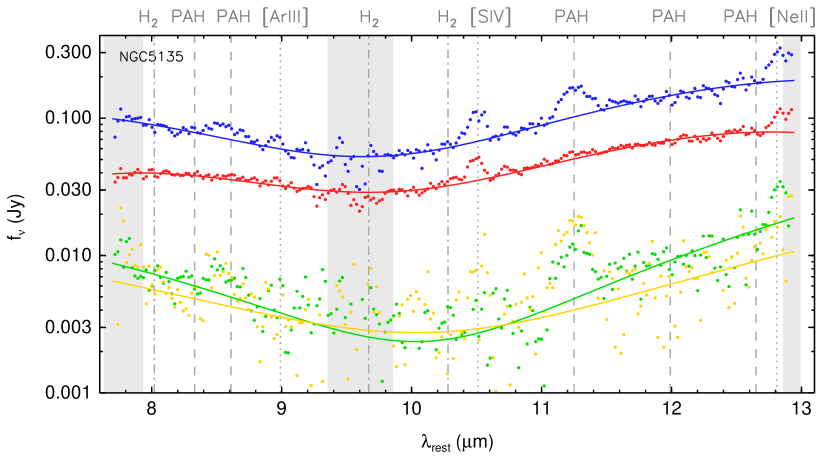
The T-ReCS data are stored automatically in savesets, which contain information on the on-source (object + sky) and off-source (sky) frames for each chop/nod position. The savesets can be accessed directly to discard images affected by any type of instrumental noise pattern. A given number of savesets forms a dataset. Once the bad savesets of a dataset are discarded, the sky-subtracted images were stacked to obtain a single image of the 2D-spectrum of the target. Because some of the datasets were obtained in different nights and under different atmospheric conditions (see above), the following procedures were applied to each galaxy-standard pair of datasets individually as they contained the full information to perform their own calibration. Figure 2 shows the 2D-spectrum of each LIRG (the different savesets were averaged for obtaining high S/N images but these were not used for scientific purposes). Note that even in these partially reduced T-ReCS spectra (not corrected from the shape of the atmospheric transmission; see below) we can detect the 8.6 and 11.3 µm PAHs and the [S iv]10.51 µm, and [Ne ii]12.81 µm emission lines, together with the 9.7 silicate absorption feature (see Figure 2).
.
After applying a flat-field to the datasets we made use of Gemini-based iraf111iraf is written and supported by the iraf programming group at the National Optical Astronomy Observatories (NOAO), which are operated by the Association of Universities for Research in Astronomy, Inc., under cooperative agreement with the National Science Foundation. http://iraf.noao.edu tasks (nswavelength and nstransform) to calibrate in wavelength the 2D-spectra. We used the sky emission features in the reference (sky) stacked spectra to calibrate in wavelength both the the galaxy and standard star 2D-spectra. For the next final steps of the data reduction, we used our own in-house developed idl routines.
In order to subtract the residual background from the 2D-spectrum image, it was fitted to a 2D plane with a fitting algorithm that iteratively rejects outliers 2.25 above/below this plane to ensure that only “sky” pixels are used for the fit.
2.2.2 Extraction and Calibration of the 1-D Spectra
Once the 2D-spectrum images of the galaxy and the standard star were wavelength-calibrated and background-subtracted, we used the high S/N ratio of the spectrum of the standard star to trace the apertures of the 1-D spectra.
We extracted the nuclear spectrum of each LIRG as well as 1-D spectra at regular positions (1 pixel 0.09″ step) along the slit in the spatial direction using a fixed aperture of 4 pixels in length. We then used this grid of spectra to construct spatial profiles of the features detected in the spectra of each LIRG (see Appendix). All the regions (nuclei and star-forming regions) were assumed to be extended. We also extracted the integrated spectra of the galaxies with a fixed aperture of 40 pixel (3.6″), as well as the spectra of the regions of interest.
After the spectrum of a given position was extracted from every dataset, all the spectra were interpolated to a common wavelength array, with a spacing approximately similar to that provided by the wavelength-calibration function (pixel-1). This step was needed since the observations of some galaxies were carried out on different nights.
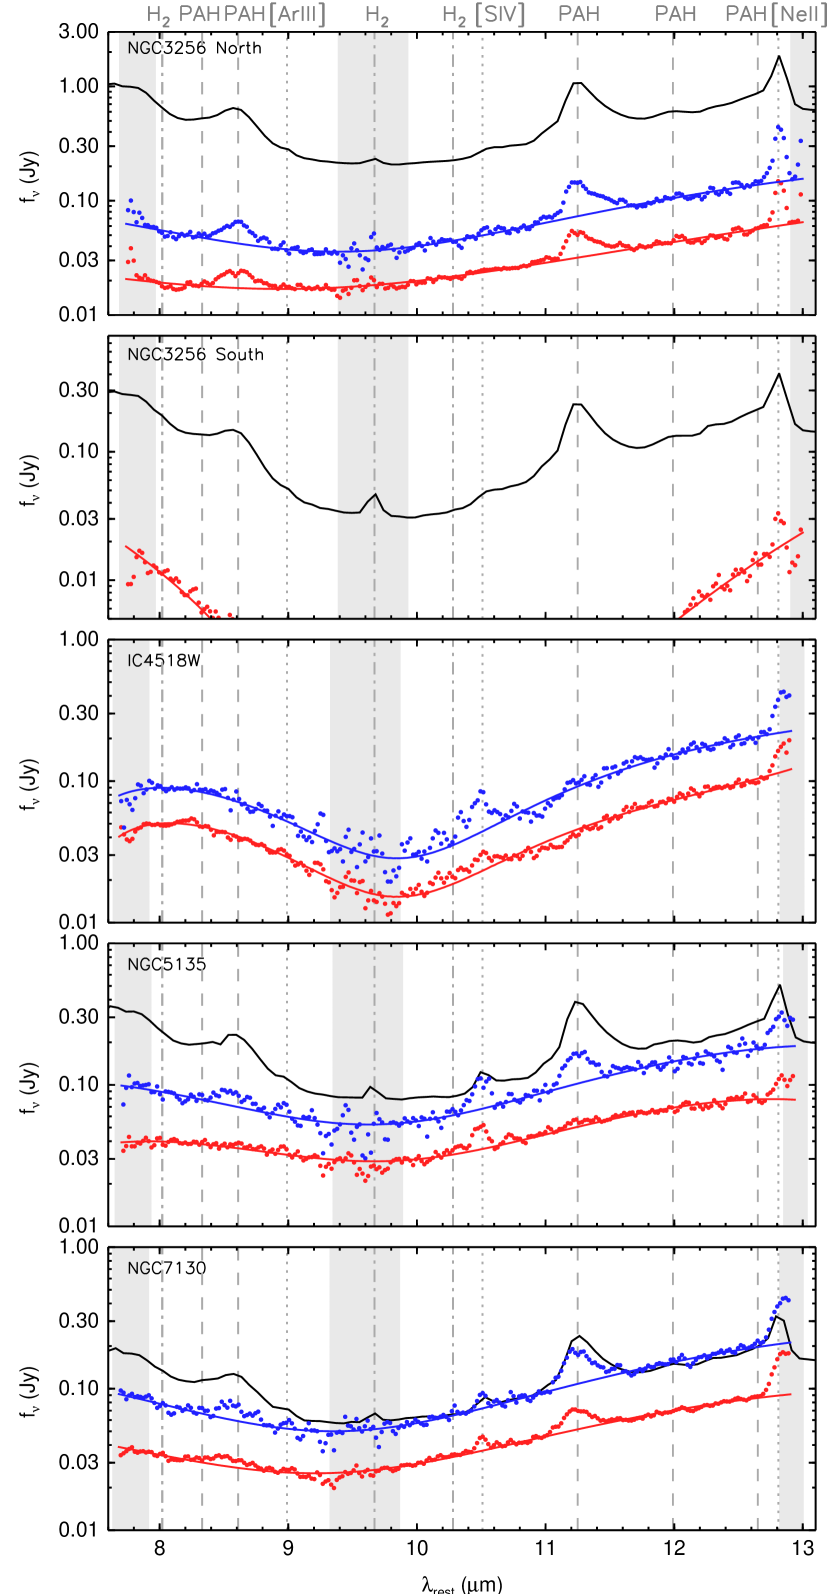
Each interpolated spectrum was then flux-calibrated using its associated Cohen standard star while taking into account the slit losses in each dataset. By comparing the flux-calibration of the different datasets we determined that this is accurate to within uncertainty. Finally, the spectrum of each dataset was weighted by the number of savesets used for constructing the dataset (i.e., by the exposure time) and then averaged. The uncertainties of the background emission were obtained by calculating the standard deviation of the “sky” spectrum of the grid (see above) defined as those spectra having a -band flux density below 3 mJy. The extracted nuclear and integrated spectra of the LIRGs can be seen in Figure 5.
3. Complementary Data
3.1. NIR HST NICMOS Imaging
The 4 galaxies selected for this work are from the HST/NICMOS survey of a volume-limited sample of local LIRGs of Alonso-Herrero et al. (2006b). The observations were taken with the NIC2 camera (pixel size of 0.075″ and FOV of 19.3″19.3″) using two broad-band filters (F110W and F160W) for obtaining NIR continuum imaging, and two narrow-band filters (F190N and F187N) for observing the Pa line emission and its associated continuum. We refer the reader to Alonso-Herrero et al. (2006b) for details on the observations and data reduction. Using the fully-reduced images we constructed continuum-subtracted Pa emission, and color maps of the nuclear regions of the galaxies.
A few extra steps were needed to make a meaningful comparison between the NICMOS and the T-ReCS images. Most importantly, rescaling the pixel size and match the resolution of the images (see Díaz-Santos et al. 2008 for details). In addition, we simulated the positions of the T-ReCS slits (see §2.1) over the HST NICMOS Pa images and extracted the spatial profiles from them. These profiles were then compared with those obtained for the MIR spectral features (see Appendix). The Pa and NIR continuum images where also used to estimate the ages and extinctions for each of the star-forming regions studied in this work. The ages were inferred from their Pa equivalent widths (EWs) using Starburst99 models (Leitherer et al. 1999) and are upper limits to the real ages of the regions. The extinctions were calculated using the NIR colors and are lower limits to the real values. For more details about the approach used, see Díaz-Santos et al. (2008).
3.2. MIR Spitzer IRS Spectroscopy
For NGC 3256, NGC 5135 and NGC 7130, we compare our T-ReCS data to the Spitzer IRS spectra from Pereira-Santaella et al. (2009a). The spectra were obtained with the short-wavelength, low resolution module (SL), which ranges from to and has a spectral resolution of R, similar to that of T-ReCS spectra. The extraction of the Spitzer IRS 1D spectra for each LIRG was made using various fixed apertures, from 22 pixel to 44 pixel. The smaller aperture is approximately the size (FWHM) of a point source at the end of the wavelength range covered by the module, which is about 3.7″3.7″ for the SL module. The flux-calibration was performed assuming the sources were extended. The extracted spectra of the galaxies are shown in Figure 5.
4. Analysis
4.1. Obtaining Sub-arcsecond Spatially Resolved Profiles
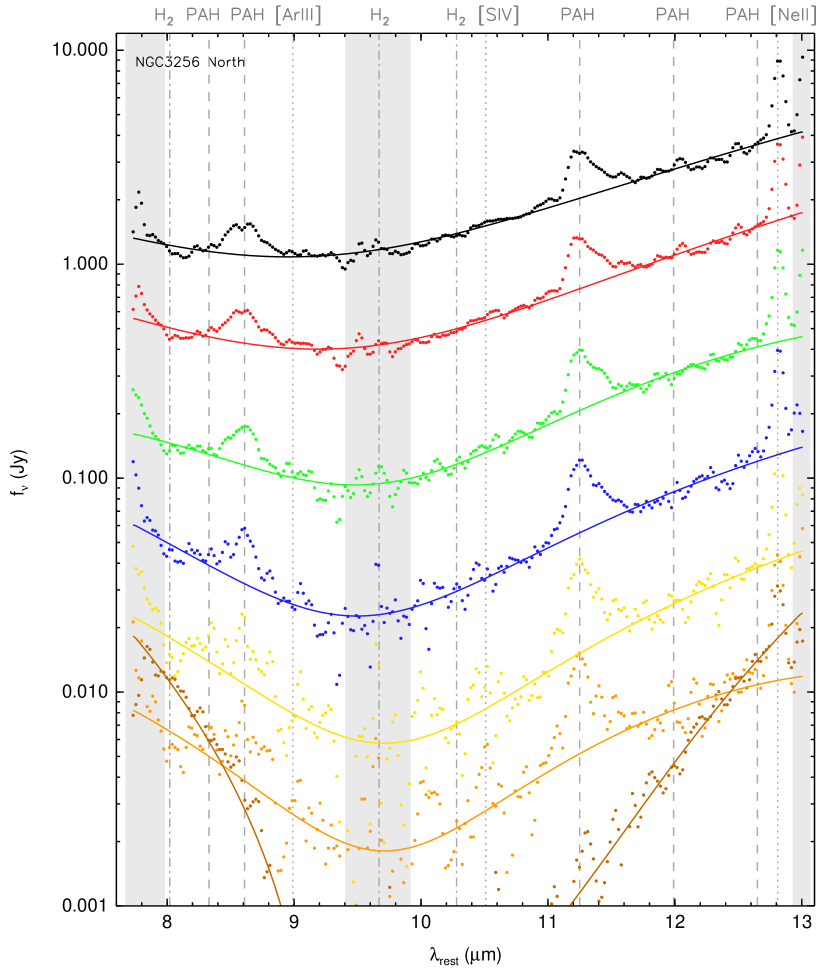
Figure 3 shows an example of some individual spectra of NGC 3256 extracted at different positions along the slit (see §2.2.2). The main emission features seen are the 8.6 and 11.3 µm PAHs, and the [S iv]10.51 µm and [Ne ii]12.81 µm lines.
To measure each feature, we first fitted each 1-D spectrum with a polynomial function using a -minimization method (with a weight 1/, where is the total uncertainty at each wavelength) after masking out the most prominent features in the spectra. A few examples of these fits are shown in Figure 3. Next, we: (1) measured the fluxes of the PAHs and emission lines; (2) calculated their EWs and (3) obtained the continuum flux at two reference wavelengths: 8.2 and 12.2. The fluxes of the features were calculated by fitting them with Gaussian functions with fixed widths and varying intensities and positions. Although a Gaussian profile does not represent perfectly the shape of the PAH bands, it is still a reasonable choice and a good approximation to their enclosed flux. We considered a feature as detected when its peak was 2.25 above the continuum. This threshold was chosen as a good compromise between being able to detect low surface brightness emission in diffuse regions and not including unreliable measurements.
We note that the [Ne ii]12.81 µm line may be contaminated with emission from the 12.7 PAH feature, since the T-ReCS spectral resolution is not sufficient to separate both components. In addition, due to the distance to IC 4518W, NGC 5135 and NGC 7130, the [Ne ii]12.81 µm emission line of these LIRGs is red-shifted almost outside of the T-ReCS -band filter. This causes the red wing of the line to be significantly affected by the filter and atmospheric transmissions; the latter starts decreasing significantly at . We therefore doubled the uncertainties in the fluxes measured of [Ne ii]12.81 µm line for these galaxies because the fits to this line were made using only the half of the line not affected by the filter and atmospheric transmissions. The uncertainties of the ratios and other quantities obtained using this line were calculated accordingly, including this additional uncertainty.
| Nucleus | Feature | ||||
| 8.6 µm PAH | [S iv] | 11.3 µm PAH | [Ne ii] | ||
| (1) | (2) | (3) | (4) | (5) | (6) |
| NGC 3256 (N) | 7.53.5 | 1.0 | 11.91.3 | 12.90.5 | 0.390.10 |
| NGC 3256 (S) | 1.7 | 0.5 | 1.0 | 2.10.2 | |
| IC 4518Wb | 6.4 | 2.80.9 | 3.7 | 6.91.3 | 1.420.19a |
| NGC 5135b | 5.5 | 5.20.9 | 3.2 | 5.11.0 | 0.460.18 |
| NGC 7130 | 5.54.4 | 2.51.8 | 11.41.3 | 10.31.6 | 0.610.08 |
Note.– (1) Name. (2)–(5) Fluxes of the features and 2.25 upper limits (see text) in units of 10-14 erg s-1 cm-2. (6) Silicate strength of the LIRG nuclei (see §4.2 and Equation 1).
a The of IC 4518W was calculated using the alternative method explained in §4.2.
b The nuclei of IC 4518W and NGC 5135 are unresolved. The values given here have not been corrected for aperture effects.
The values correspond to the 1-D spectra extracted with a fixed aperture of 0.36″[0.36″ (NGC 3256), and 0.72″ (IC 4518W, NGC 5135, NGC 7130)] centered at the nuclei of the galaxies.
| Nucleus | Feature | ||||
| 8.6 µm PAH | [S iv] | 11.3 µm PAH | [Ne ii] | ||
| (1) | (2) | (3) | (4) | (5) | (6) |
| NGC 3256 (N) | 23.09.3 | 3.0 | 40.03.9 | 42.82.0 | 0.620.13 |
| NGC 3256 (S) | 5.4 | 1. | 1.0 | 3.21.7 | … |
| IC 4518W | 17.2 | 12.52.5 | 10.1 | 22.94.1 | 1.450.28a |
| NGC 5135 | 19.213.3 | 13.16.3 | 36.77.1 | 19.24.8 | 0.630.23 |
| NGC 7130 | 17.510.9 | 5.25.2 | 45.04.4 | 25.44.2 | 0.750.10 |
Note.– (1) Name. (2)–(5) Fluxes of the features and 2.25 upper limits (see text) in units of 10-14 erg s-1 cm-2. (6) Silicate strength of the LIRG nuclei (see §4.2 and Equation 1).
a The of IC 4518W was calculated using the alternative method explained in §4.2.
The values were calculated for the 1-D spectra as extracted using a fixed aperture of 3.6″[0.36″ (NGC 3256), 0.72″ (IC 4518W, NGC 5135, NGC 7130)] centered at the nuclei of the galaxies.
| Nucleus | Feature | |||
| 8.6 µm PAH | [S iv] | 11.3 µm PAH | [Ne ii] | |
| (1) | (2) | (3) | (4) | (5) |
| NGC 3256 (N) | 0.110.05 | … | 0.160.02 | 0.120.01 |
| NGC 3256 (S) | … | … | … | 0.070.01 |
| IC 4518W | … | 0.050.02 | … | 0.030.01 |
| NGC 5135 | … | 0.050.01 | … | 0.040.01 |
| NGC 7130 | 0.050.04 | 0.030.02 | 0.180.02 | 0.060.01 |
Note.– (1) Name. (2)–(5) EWs of the features in . See also Table 3 for notes about the extraction apertures.
| Nucleus | Feature | |||
| 8.6 µm PAH | [S iv] | 11.3 µm PAH | [Ne ii] | |
| (1) | (2) | (3) | (4) | (5) |
| NGC 3256 (N) | 0.130.05 | … | 0.230.03 | 0.160.01 |
| NGC 3256 (S) | … | … | 0.380.33 | 0.100.01 |
| IC 4518W | … | 0.110.03 | … | 0.060.01 |
| NGC 5135 | 0.060.05 | 0.070.04 | 0.150.03 | 0.060.01 |
| NGC 7130 | 0.070.04 | 0.030.03 | 0.180.02 | 0.070.01 |
Note.– (1) Name. (2)–(5) EWs of the features in . See also Table 4 for notes about the extraction apertures.
.
4.2. Measuring the Strength of the Si Feature
An important quantity related to the Si feature is its depth or strength. This is calculated as:
| (1) |
where is the observed flux density of the feature and is the continuum, both evaluated at wavelength (usually, 9.7). A negative value indicates absorption, while a positive value indicates emission. The can be associated with an optical depth (and therefore with a visual extinction) via an extinction law and a dust obscuration model or geometry. For a dust screen configuration, the relation between the (or equivalently in this case: apparent ) and the apparent is unique and it is given by the shape of the absorption curve of the adopted extinction law.
The limited spectral range afforded by ground-based -band observations in conjunction with the broad silicate feature, and the prominent PAH features in our galaxies make it difficult to measure the MIR continuum. To circumvent this problem, we made use of the SL Spitzer IRS spectra which has a larger spectral range. We stress that the Spitzer spectra are extracted with much larger apertures (see §3.2) than the T-ReCS spectra, and thus the main assumption here is that the shape of the continuum over the Spitzer (kpc) spatial scales is the same as that over the T-ReCS (hundred pc) scales. That is, for a given galaxy, we used the same Spitzer continuum for all the T-ReCS spectra extracted along all spatial steps. This may have some implications in cases were the Spitzer spatial resolution cannot separate AGN and star formation sites.
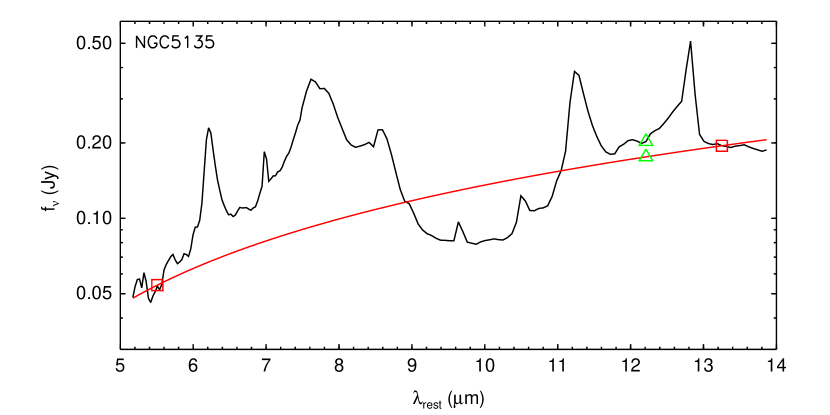
We fitted the IRS spectrum to a simple linear function with anchors at 5.5 and 13.2 (see Figure 4, top). This method yielded similar results to the method of Sirocky et al. (2008), which uses a spline interpolation. We then measured the ratio between the measured flux at 12.2 in the IRS spectrum, and the fitted value at the same wavelength. We used this ratio to scale the fit to the T-ReCS spectra at 12.2. We have to note that because of the wavelength selected to scale the spectra is still inside the absorption feature (though in the more outer part of it), the measured silicate strengths might be slightly underestimated. In any case, relative comparisons are not affected by this.
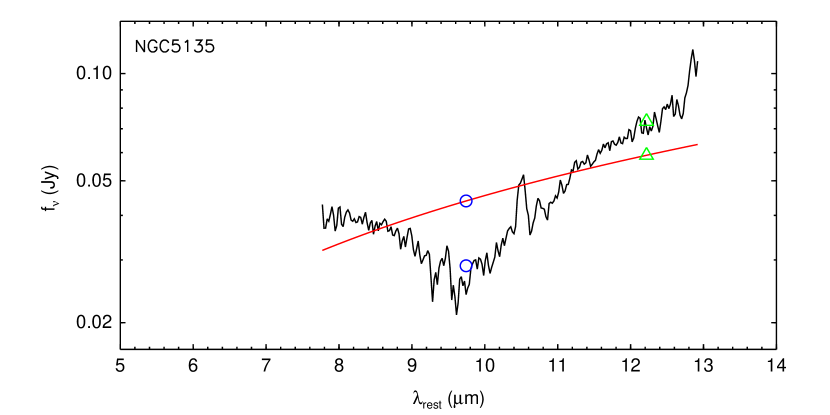
We found that the maximum of the Si absorption feature was not always centered at 9.7 (see Sirocky et al. 2008 and reference therein). It varies between 9.4 and 10 and sometimes is even located at shorter wavelengths down to (see, e.g., the spectra of NGC 3256 in Figure 3). Because of these displacements, we computed the of the T-ReCS spectra using Equation (1) but evaluating it at the maximum of the absorption, rather than exactly at 9.7.
Since no IRS spectrum is available (to the date) for IC 4518W, we used a second approach to measure the . In this case we measured the continuum emission above the Si feature using directly the T-ReCS spectra. Note, however, that the PAHs and in particular the 8.6 feature, in this galaxy are not very strong (see Figure 5). For each step of the spatial profiles we fitted the spectra between 8.2 and 12.2 (at the edges of the silicate feature) with a linear function and interpolated the fitted continuum to the maximum of the absorption. We also applied this alternative method to the other LIRGs to compare these values with those obtained using the IRS spectra. We found that both methods yielded similar results, as can be seen for NGC 3256, NGC 5135 and NGC 7130 in Figure 6.
5. Crucial Differences Between T-ReCS and IRS Spectra
We can compare the nuclear and integrated T-ReCS spectra of NGC 3256, NGC 5135 and NGC 7130 with the Spitzer IRS spectra (there is no Spitzer spectrum for IC 4518W) to highlight the different physical regions and processes probed by the two instruments. While the Spitzer IRS spectra are representative of the emission over scales of 1 kpc, our ground-based observations improve this resolution by almost one order of magnitude. Thus with the T-ReCS data we can disentangle the emission arising from the nuclear regions of the galaxies on scales of 100 pc.
5.1. NGC 3256
NGC 3256 has two nuclei separated by 5″ (1 kpc) along the north-south direction. The northern nucleus (see Figure 1, orange cross) has been clearly classified as a star-forming region (Lípari et al. 2000; Lira et al. 2002) and is resolved in the T-ReCS MIR image (FWHM of 0.50″ 100 pc; Díaz-Santos et al. 2008). The southern nucleus is heavily obscured (mag; Kotilainen et al. 1996; Lira et al. 2002; Alonso-Herrero et al. 2006a; Díaz-Santos et al. 2008), and it is classified as H ii-like. The T-ReCS (nuclear and integrated) and IRS spectra of the northern nucleus of NGC 3256 are all very similar (see Figure 5). All of them show prominent 8.6 and 11.3 µm PAH features together with a conspicuous [Ne ii]12.81 µm emission line. Therefore, despite the nucleus is resolved, the nuclear spectrum is representative of the whole region, even at kpc scales (see IRS spectrum).
The IRS spectrum of the southern H ii-like nucleus of NGC 3256 shows a larger absorption ( ) than that of the northern nucleus ( ; Alonso-Herrero et al. 2009b; Pereira-Santaella et al. 2009a). However, our T-ReCS spectrum of the southern nucleus shows that the IRS spectrum underestimates the true depth of the silicate feature. In fact, the T-ReCS spectrum is so absorbed that even the intense 8.6 and 11.3 µm PAHs (clearly seen also in the spectrum of Martín-Hernández et al. 2006) cannot be measured because they are totally extinguished. The [Ne ii]12.81 µm emission line is also likely to be somewhat affected by the absorption. All these features are however clearly detected in the IRS spectrum. Thus, the T-ReCS spectrum effectively separates the emission arising from the heavily absorbed southern nucleus of NGC 3256 from that of the surrounding regions. In turn, the IRS spectrum is a combination of both.
5.2. NGC 5135
The central region of this galaxy is known to host a Compton-thick Seyfert 2 nucleus as well as a number of bright H ii regions (Levenson et al. 2004; González Delgado et al. 2001; Bedregal et al. 2009). Our MIR imaging data showed that the AGN is only contributing about 25% of the MIR emission in this region (Alonso-Herrero et al. 2006a). The IRS spectrum (Figure 5) shows intense 8.6 and 11.3 µm PAH features, indicating the presence of star formation, as well as [S iv]10.51 µm and [Ne ii]12.81 µm line emission, and a hint of the [Ar iii]8.99 µm emission line. Outside the ground-based -band spectral range the IRS spectra display evidence for the presence of the AGN in the form of high-excitation emission lines and a strong dust continuum at (see Alonso-Herrero et al. 2009b; Pereira-Santaella et al. 2009a). From the IRS spectrum alone it is not clear whether the spectral features are being emitted by the same source (see Figure 1). The T-ReCS nuclear spectrum is almost featureless, except for the [S iv]10.51 µm and the [Ne ii]12.81 µm emission lines. The comparison between the line fluxes from the IRS and the T-ReCS spectra shows that the AGN of NGC 5135 is responsible for a large fraction, at least 50% (this is a lower limit, since we are not correcting for aperture), of the [S iv]10.51 µm line emission measured from the IRS spectrum (see Table 7). The [Ne ii]12.81 µm emission on the other hand is coming mostly from extra-nuclear regions. It is also worth noting that the T-ReCS nuclear spectrum does not display PAH emission (although the 11.3 µm PAH may be marginally present) or [Ar iii]8.99 µm line emission. We can conclude from the T-ReCS spectroscopy that the star formation in this galaxy is mostly circumnuclear (150 pc) rather than nuclear.
In contrast, both the integrated T-ReCS spectrum of NGC 5135 and the kpc-scale IRS spectrum show the same features, including the PAHs. The similarity between both spectra seems to indicate that the PAH emission does not vary strongly from region to region within the central kpc of NGC 5135. The T-ReCS nuclear spectrum of NGC 5135 has a shallower Si feature than that of the integrated spectrum (see below).
| Nucleus | 8.6 µm PAH | [S iv] | 11.3 µm PAH | [Ne ii] | ||||
|---|---|---|---|---|---|---|---|---|
| (1) | (2) | (3) | (4) | (5) | (6) | (7) | (8) | (9) |
| NGC 3256 (N) | 342 | 2% | … | … | 458 | 3% | 267 | 5% |
| NGC 3256 (S) | 53 | … | … | … | 103 | … | 60 | 4% |
| NGC 5135 | 66 | … | 11 | 47% | 172 | … | 67 | 8% |
| NGC 7130 | 37 | 15% | 5.7 | 44% | 87 | 13% | 41 | 25% |
Note.– (1) Name. (2), (4), (6), and (8) Fluxes of the features in units of 10-14 erg s-1 cm-2. (3), (5), (7) and (9) Percentage of flux contained in the nuclear T-ReCS spectra. Note that the T-ReCS spectra have not been corrected for aperture, so these fractions are lower limits.
The values were measured from IRS spectra (SL module) and extracted with CUBISM from mapping-mode data and using an extraction aperture of 6.8″6.8″ centered at the nuclei of the galaxies, except for the southern nucleus of NGC 3256 that was extracted with an aperture of 4.5″4.5″ to avoid overlapping with the northern nucleus.
5.3. NGC 7130
NGC 7130 also hosts a Compton-thick Seyfert 2 nucleus, as well as star formation within the central 150 pc (Levenson et al. 2005; González Delgado et al. 1998). The IRS spectrum shows both AGN and star formation features (Pereira-Santaella et al. 2009a). However, unlike NGC 5135, our T-ReCS imaging data of NGC 7130 show a resolved nucleus (FWHM 0.45″) suggesting that in this region the star formation and the AGN emissions are still mixed (Alonso-Herrero et al. 2006a). Indeed, Figure 5 shows that the T-ReCS nuclear spectrum of NGC 7130 displays the [S iv]10.51 µm and [Ne ii]12.81 µm emission lines as well as the 8.6 and 11.3 µm PAH features. The presence of PAH features in the nuclear spectrum clearly indicates that there is star formation in the very nuclear region (100 pc) of NGC 7130, as well as in regions surrounding it (at distances of several hundreds of pc). Nevertheless, at least half of the [S iv]10.51 µm emission measured in the Spitzer spectrum is contained within the inner 0.36″0.72″ probed by the T-ReCS nuclear spectroscopy (see Table 7). In contrast, most of the [Ne ii]12.81 µm emission is steming from regions outside the central 0.36″0.72″ region of this galaxy.
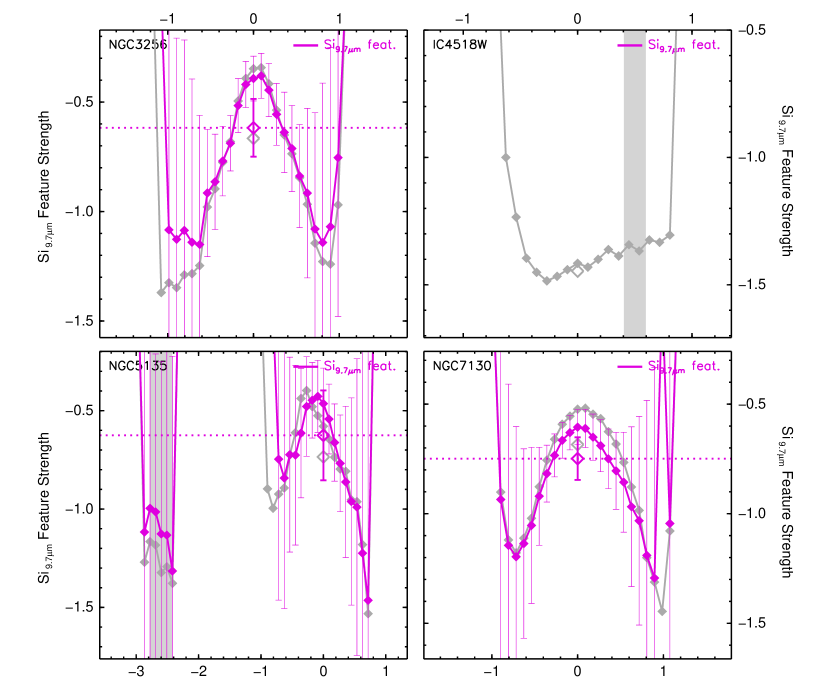
6. The Strength of the 9.7 Silicate Feature in Star-Forming Regions and AGNs
The spatially-resolved information afforded by the T-ReCS spectroscopy allows us to study in detail the behavior of the silicate feature in the nuclear and circumnuclear regions of our LIRGs. The most intriguing result here is that the , in general, is shallower towards the nuclei of the LIRGs than in the surrounding regions (see Figure 6). We measure Si strength values for the innermost regions of the LIRG nuclei in the range of 0.5 (NGC 3256) to 0.7 (NGC 7130), while the extra-nuclear regions show values ranging from 1 to up to 1.5. The H ii region in NGC 5135 also shows a mean value of . The only galaxy that presents a different behavior is IC 4518W, which shows an almost constant value of the . This is not surprising however, as the AGN totally dominates the MIR nuclear emission of this LIRG and there is no hint for star formation in the innermost regions of the galaxy. Interestingly, the Si strength in the high-excitation line region of IC 4518W (see Appendix B) is slightly lower than but comparable to that of the nucleus.
.
One may think that intense PAH emission could be “artificially” increasing the continuum emission at the wings of the Si feature222Note that the 7.6 and 8.6 PAH features are on the blue side of the T-ReCS spectrum, and the 11.3 and 12.7 PAH complexes on the red side.. We used, however, the Spitzer IRS spectrum of the galaxies for estimating the real continuum at two wavelengths where the PAHs do not dominate the emission. In addition, the two methods used to calculate the (see §4.2 and Figure 6) yielded similar values, indicating that the tendencies seen in the spatial profiles of the Si strength in our LIRGs are real.
The nuclei of all these galaxies heat the nearby dust effectively. Because the same dust produces both the observed continuum and the silicate feature, radiative transfer effects determine the resulting feature strength. If AGNs are indeed located within clumpy environments, they can produce only shallow silicate absorptions (Nenkova et al. 2008b). A clumpy geometry allows direct views of some hot, directly-illuminated cloud surfaces whose emission fills in the absorption created by cold clouds. That is, even when the clumpy dust distribution is extended, the temperature gradient along a clumpy torus is never high due to the probability of viewing hot, directly-illuminated clouds at all distances (Nenkova et al. 2008a). Therefore, the silicate feature remains always weak (; Nenkova et al. 2008b). A deeper absorption feature requires a steeper temperature gradient, as radiative transfer computations demonstrate (Levenson et al. 2007). An optically and geometrically thick smooth dusty medium can provide this temperature gradient.
In the case of NGC 3256, where the nuclear starburst is compact, the immediate dusty surroundings remain hot. Without a strong temperature gradient, the nuclear silicate absorption is weak. The dust farther (pc) from the nucleus is somewhat cooler, without producing such a hot continuum. More importantly, the dust distribution in the off-nuclear extended star-forming regions of NGC 3256, NGC 5135, and NGC 7130 can be optically and geometrically thick, therefore showing deeper absorptions (Levenson et al. 2007). Thus, we interpret these cases as the transition from either the clumpy or compact environment of an AGN or a nuclear starburst to the more smooth, extended dust distributions typical of circumnuclear star formation. The AGN in NGC 5506 offers another similar example, with a weaker silicate absorption in the nucleus than in the surrounding extended regions (Roche et al. 2007).
On the other hand, the silicate strength remains roughly constant and large across the central region of IC 4518W. This is not characteristic of a clumpy environment but instead suggests foreground extinction by cool dust, possibly by a dust lane in this highly inclined galaxy.
In general however, using a simple foreground dust screen geometry to estimate the optical depth across the nuclei of these LIRGs is not correct because of the existence of multiple dust components at different temperatures (as explained above). In fact and due to this, it is because if we used a simple foreground dust screen model for calculating the extinction (i.e., the apparent , see §4.2) we would obtain lower extinctions for the LIRG nuclei than for the surrounding regions (except in IC4518W, where the is nearly constant). That is, we now know that the apparent () values found for the nuclei are only lower limits to the real ones because of the re-emission of the hot dust emission component (associated either to a clumpy geometry or a compact environment) near 10 that is not accounted for by the screen model.
The measured over the integrated spectra of galaxies (Figure 6, open diamonds) indicate that the absorption is never very deep. Moreover, all LIRGs show almost the same strength (from to , except for IC 4518W which presents a deeper of 1.45), closer to those values found in their nuclei rather than to those measured in the surrounding regions. Indeed, this is an expected result if we realize that these values are “luminosity-weighted” and that the flux included within our slits arising from these surrounding regions represents a low fraction of the MIR luminosity when compared with which is arising from the nucleus itself. The strengths measured in the T-ReCS integrated spectra are in agreement with those obtained from the IRS spectroscopy.
7. The [NeII] emission
The [Ne ii]12.81 µm emission line luminosity scales with SFR in galaxies (Roche et al. 1991; Ho & Keto 2007). Ho & Keto (2007) found a good empirical correlation between the sum of the [Ne ii]12.81 µm and the [Ne iii]15.55 µm emission lines and the Br emission line for H ii regions in the Galaxy, the Small and Large Magellanic Clouds, and M33. They also calibrated theoretically the SFR in terms of the [Ne ii]+[Ne iii] luminosity and found a good agreement between observations and theory.
We support these conclusions showing here that [Ne ii]12.81 µm scales with Pa, a direct tracer of the youngest (ionizing) stellar populations, on the physical scales probed by our data (100 pc)333We excluded the regions of IC 4518W from this section, since we do not find any clear evidence for star formation, as well as the Seyfert nuclei of NGC 5135 and NGC 7130.. Here and in the next section, we chose to use units of luminosity surface density (LSDs) to represent the luminosities of the regions because our galaxies are at different distances and were observed with different slit widths.
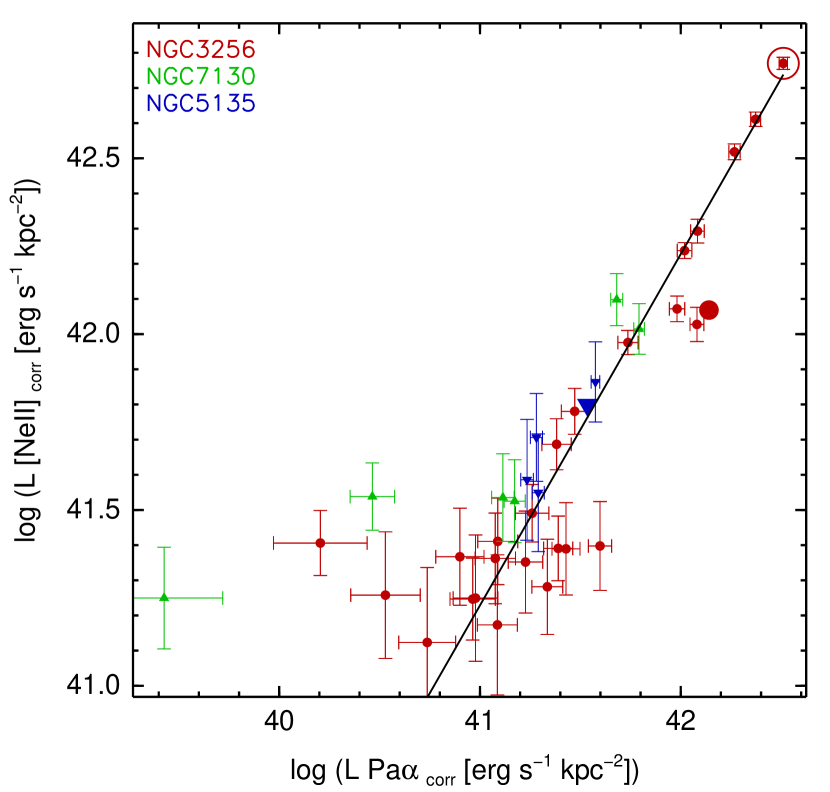
Figure 7 compares the [Ne ii]12.81 µm and Pa LSDs for the star-forming regions in our sample of LIRGs. Each point in these figures represents a spatial position along the slit in 0.36″ bins. We estimated the extinction to each star-forming regions as explained by Díaz-Santos et al. (2008) and corrected the [Ne ii]12.81 µm and Pa LSDs for it using the Calzetti et al. (2000) extinction law (see §3.1). There is a tight correlation between the [Ne ii]12.81 µm and Pa LSDs (Figure 7). Furthermore, this correlation is common to the regions of all LIRGs and spans about 2 orders of magnitude. We fitted the datapoints above log(L Pa [erg skpc-2]) = 40.5. The 3 outliers with log(L Pa [erg skpc-2]) below 40.5 are from regions just above the detection limit of the [Ne ii]12.81 µm line and therefore the measurements are very uncertain. We found:
| (2) |
where the [Ne ii]12.81 µm and Pa lines are in LSD units (erg skpc-2). The scatter around the trend is dex. The slope of the fit is 1.000.02 and therefore the correlation is linear, suggesting that the [Ne ii]12.81 µm emission is effectively tracing the youngest ionizing stellar populations in LIRGs.
This correlation is similar to that found by Ho & Keto (2007) but without including the [Ne iii]15.55 µm line contribution. The fact that the [Ne ii]12.81 µm luminosity is directly proportional to the Pa luminosity with a unity slope is in agreement with the relatively low [Ne iii]15.55 µm/[Ne ii]12.81 µm nuclear and integrated ratios observed in most of our LIRGs from our kpc-scale Spitzer IRS observations (Alonso-Herrero et al. 2009b; Pereira-Santaella et al. 2009a). This may be explained in terms of the ages probed by our regions: Myr. Indeed, photo-ionization models predict for starbursts up to 6 Myr that: (a) the neon atoms are no longer double ionized (Ne ++); and (b) the [Ne ii]12.81 µm/Pa ratio does not vary significantly (Dopita et al. 2006; Groves et al. 2008; Thornley et al. 2000; Martín-Hernández et al. 2005; Rigby & Rieke 2004; Snijders et al. 2007). This is in agreement with our star-forming regions, which present a rather constant [Ne ii]12.81 µm/Pa ratio as a function of their age (log([Ne ii]12.81 µm/Pa)).
Therefore, the [Ne ii]12.81 µm emission line alone can be used as a good tracer of the SFR, provided that the regions are not dominated by extremely young stellar populations (Myr) and/or have low metallicity, which is in agreement with previous results (Roche et al. 1991; Ho & Keto 2007). For example, this is the case for the observations obtained with Spitzer of local LIRGs, whose integrated properties are very similar to the physical conditions in which the [Ne ii]12.81 µm emission line can be used as a SFR indicator (Pereira-Santaella et al. 2009a). Moreover, if the population of LIRGs found by Spitzer at cosmological distances (Le Floc’h et al. 2005; Pérez-González et al. 2005) turn out to be the high-redshift counterparts of those detected in the local Universe (not only in luminosity but also in their physical properties), this relation could be also applied to them, allowing to calculate the SFR of this important population of LIRGs in a simple manner.
8. The PAH emission
The good correlation between the integrated PAH emission and the IR luminosity of high metallicity starbursts and ULIRGs seems to indicate that the PAH emission is tracing the star formation processes at least on large scales (Brandl et al. 2006; Farrah et al. 2007; Smith et al. 2007; Weedman & Houck 2008). Indeed, Farrah et al. (2007) derived from integrated MIR spectra of ULIRGs a SFR calibration based on the luminosity of the 6.2 plus the 11.3 µm PAH features through the correlation of these with the luminosity of the [Ne ii]12.81 µm and the [Ne iii]15.55 µm emission lines.
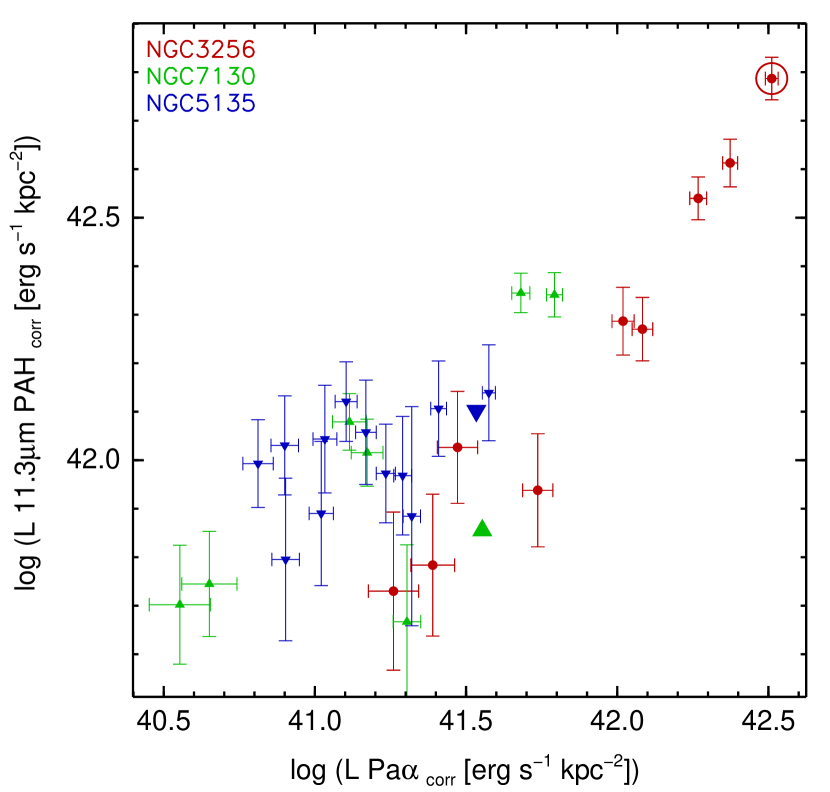
As can be seen in Figure 8, the 11.3 µm PAH and Pa LSDs seem to be broadly correlated on the scales of a few hundred parsecs probed for our LIRG star-forming regions. However, this trend is not as tight as the [Ne ii]12.81 µm vs. Pa relation and the slope is considerably lower (0.480.03). Similarly, Peeters et al. (2004) found that Galactic H ii regions do not show a very tight correlation between their PAH luminosities and their number of ionizing photons. Moreover, Figure 8 shows that, individually, the star-forming regions of each LIRG appear to show their own trend. For example, the star-forming regions of NGC 3256 show quite low 11.3 µm PAH LSDs for a given Pa LSD when compared with those of NGC 5135. In addition, the regions of NGC 5135, unlike those of NGC 3256 and NGC 7130, show a very weak dependence of the 11.3 µm PAH on the Pa LSD. Therefore Figure 8 suggests that the PAH emission in the star-forming regions of LIRGs differs from galaxy to galaxy not only in its total luminosity (see also Smith et al. 2007) but also in relation with the ionizing stellar populations.
The metallicity of the star-forming regions, and in particular low-metallicity environments, is known to have a strong impact on the observed PAH emission (e.g., Madden et al. 2006; Engelbracht et al. 2006; Wu et al. 2006; Calzetti et al. 2007). Metallicity is not likely to have a strong effect on the observed PAH properties of the LIRG star-forming regions since all the galaxies have similar oxygen abundances (see Table 1). For a fixed metallicity, the hardness and the intensity of the radiation field are also believed to play an important role in the PAH energetics (Wu et al. 2006; Gordon et al. 2008). In the next sections we investigate the effects of both on the observed PAH emission of star-forming regions in LIRGs.
8.1. The Age of the Ionizing Stellar Populations
At a given metallicity, the hardness of the radiation field is a strong function of the age of the ionizing populations. The radiation field decreases with age as stars evolve off the main sequence, but it also shows a temporary increase when the most massive stars enter the Wolf-Rayet phase (see e.g., Snijders et al. 2007). In this section we use the age of the ionizing stellar populations, as probed by the Pa EW, as an approximate proxy for the hardness of the radiation field.
Despite the relatively narrow range of ages (Myr) of our star-forming regions, Figure 9 clearly shows that the 11.3 µm PAH/Pa ratio depends on the age of the ionizing stellar populations in the sense that more evolved regions show higher 11.3 µm PAH/Pa ratios. This tendency is mainly (but not only) caused by the decreasing of the Pa emission during this period (as seen in Díaz-Santos et al. 2008). In addition we can also see that the trend is common to all star-forming regions in our sample of LIRGs. This is in agreement with our results in Díaz-Santos et al. (2008) that showed that the 8 luminosity (8.6 µm PAH + continuum emission) of LIRG H ii regions is correlated with their age. This may suggest that: PAHs may trace B stars (i.e., recent) rather than O stars (i.e., current star formation; see e.g., Peeters et al. 2004), and/or that at the earliest stages of the star formation, PAHs may be destroyed by the hard radiation fields of the youngest massive stars. However, the later explanation is unlikely since in our sample of LIRGs we do not see evidence for radiation fields hard enough (Pereira-Santaella et al. 2009a) to explain the low 11.3 µm PAH/Pa ratios observed in the youngest regions in terms of the destruction of the PAH carriers (at least at the spatial scales probed in this study).
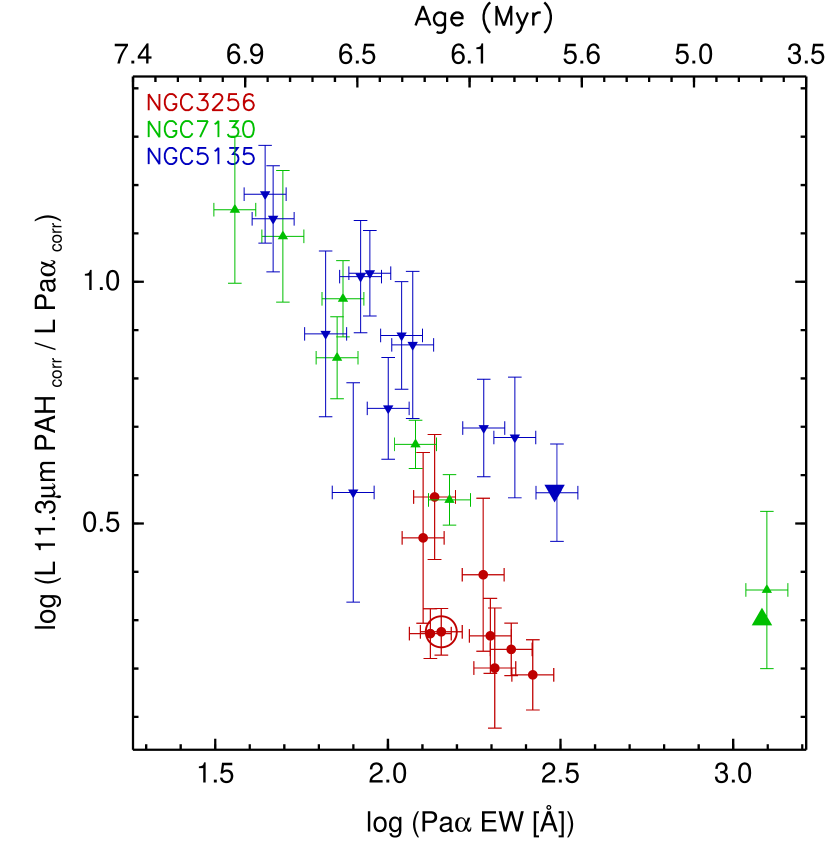
We conclude then, as we did for the 8 monochromatic (PAH + continuum) luminosity (Díaz-Santos et al. 2008), that the 11.3 µm PAH luminosity, unlike the [Ne ii]12.81 µm emission line, is not a good tracer of the current star formation when measured on scales of a few hundreds of pc. Thus, in order to use the PAH emission as a measure of the global SFR in LIRGs (or in galaxies in general), the calibration must be done using integrated emission of galaxies, where all these local physical properties are averaged out (see also Wu et al. 2005; Alonso-Herrero et al. 2006b; Brandl et al. 2006).
8.2. The Density of the Radiation Field
In Figure 9 we showed the evolution of the 11.3 µm PAH/Pa ratio as a function of the hardness (age) of the starburst only. In this section we study the variation of the 11.3 µm PAH/[Ne ii]12.81 µm ratio (equivalent to the 11.3 µm PAH/Pa ratio) as a function of the [Ne ii]12.81 µm LSD, i.e., as a function of the density of the radiation field, which takes into account not only the hardness (age) but also the intensity (mass density) of the starburst. Figure 10 shows that star-forming regions in LIRGs with high values of the [Ne ii]12.81 µm LSD tend to display lower 11.3 µm PAH/[Ne ii]12.81 µm ratios. This tendency is further supported by the observations of the H ii-like nuclei in the sample of Roche et al. (1991)444The data of Roche et al. (1991) are not corrected for extinction.. In fact, the trend seen in Figure 10 is connected to the age effect we discussed in §8.1 since, as it is said above, the density of the radiation field depends on the hardness (age) of the starburst.
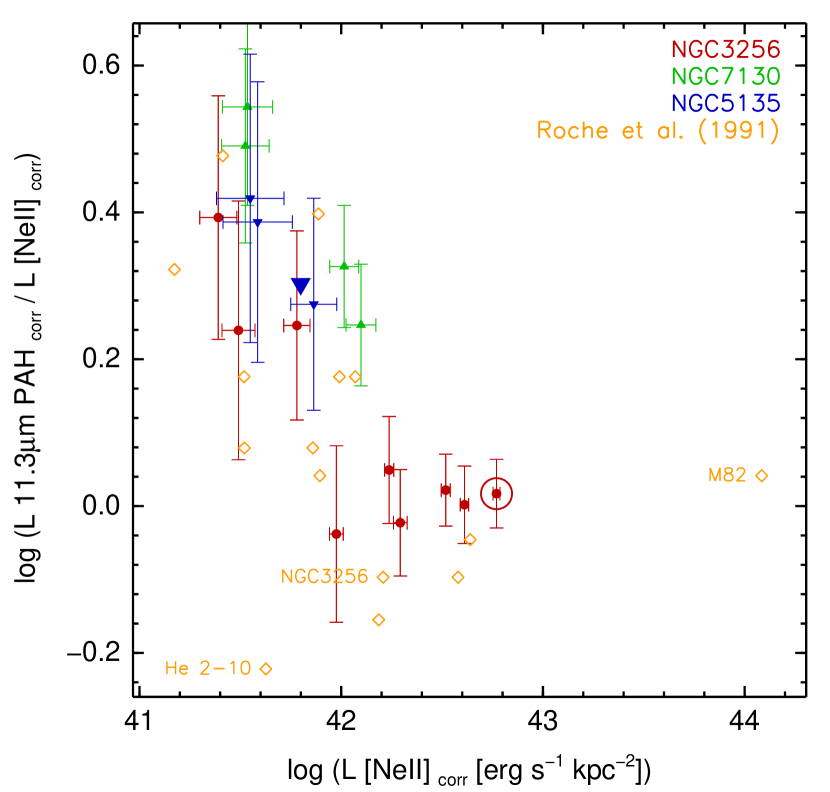
On the other hand, despite the star-forming regions in the inner 1″ 200 pc of NGC 3256 have larger [Ne ii]12.81 µm LSDs than those in NGC 5135 and NGC 7130 (see Figure 10), they do not show significantly lower 11.3 µm PAH/[Ne ii]12.81 µm ratios but instead rather constant values. Given that the age range of these regions of NGC 3256 is quite narrow (see Figure 9), we can attribute the enhancement of the [Ne ii]12.81 µm LSD and the constantness of the 11.3 µm PAH/[Ne ii]12.81 µm ratio to a mass escalation of the starburst with the [Ne ii]12.81 µm LSD (through its dependecy on the mass density), which increases as we move towards the nucleus. Therefore, for the case of these regions, we interpret LSD units as a measure of the intensity (not hardness) of the radiation field in the sense of luminosity (or, equivalently, number of ionizing photons) per unit of physical area, that is, as a measure of the mass density of the starburst. In fact, there exist a correlation between the [Ne ii]12.81 µm LSD and the Pa EW for the star-forming regions in our LIRGs that holds except for the nuclear regions of NGC 3256. In turn these present an enhanced [Ne ii]12.81 µm LSD without increasing their Pa EW. This is in agreement with our interpretation and supports the idea of that it is the mass density of the starburst which is larger towards the nuclei of NGC 3256, and that the age does not play any role in this case. This behavior is not unexpected since a more massive (denser) starburst will have a higher [Ne ii]12.81 µm LSD but the same 11.3 µm PAH/[Ne ii]12.81 µm ratio than a less massive one because the hardness of the radiation field is not modified (only its intensity). Moreover, in general, the scatter of the data in the horizontal direction in Figure 10 could be explained as an effect of the mass density of the starburst (even for those regions that presents a dependence of the 11.3 µm PAH/[Ne ii]12.81 µm ratio with the age). Unfortunately the nuclear regions of both NGC 5135 and NGC 7130 host an AGN, and thus cannot be used to explore the effects of higher density radiation fields in star-forming regions in LIRGs. In any case, our data suggest that it is only the age (hardness), but not the mass (intensity) of the starburst that modifies the 11.3 µm PAH/[Ne ii]12.81 µm ratio as a function of the [Ne ii]12.81 µm LSD (or equivalently Pa LSD; see Figure 10).
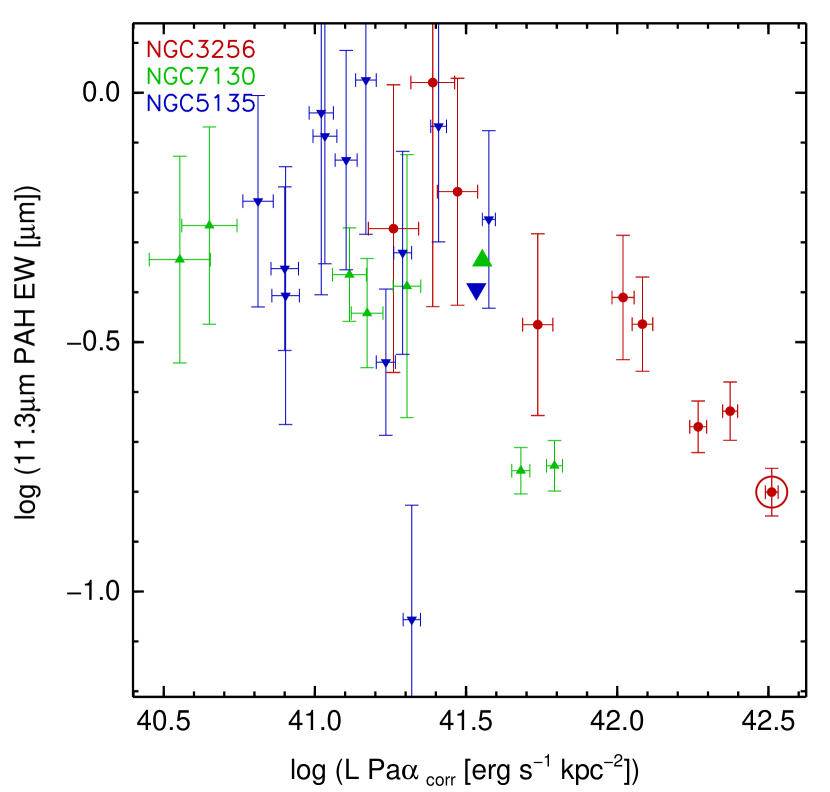
The intensity of the radiation field, however, does have an effect on the EW of the 11.3 µm PAH feature. Figure 11 shows that there is a trend of the 11.3 µm PAH EW to have lower values for increasing Pa LSD (equivalent to [Ne ii]12.81 µm LSD). This tendency is mostly driven by the star-forming regions of NGC 3256 (and the two H ii regions of NGC 7130) and therefore is related to the mass of the starburst, not the age (see above). Hence, given that the 11.3 µm PAH/[Ne ii]12.81 µm ratio of these regions is not varying with the [Ne ii]12.81 µm LSD we could argue that, for a given age, the more massive (denser) is a star-forming region, the stronger is the continuum at 11.3 with respect to its 11.3 µm PAH emission (i.e., the lower is the 11.3 µm PAH EW). Therefore our data suggest that the PAHs (at least in these regions and at the spatial scales probed here) are not destroyed by the fact of being exposed to more massive starbursts but instead they are being diluted by the enhanced continuum emission. This dilution could be due to smaller surfaces of the PDRs (from where the PAH emission arises) when compared to the volumes of the continuum emitting dust for more massive starbursts.
Wu et al. (2006) also established that the density (hardness and intensity) of the radiation field has an impact on the PAH emission of low-metallicity blue compact dwarf galaxies, and now our study reveals that this effect is also present in the relatively high metallicity star-forming regions of LIRGs. However, our work also suggest that, at least for the age and metallicity ranges of our star-forming regions, a higher radiation field intensity (in the form of a more massive starburst) causes the dilution of the PAHs (i.e., a decreasing of the 11.3 µm PAH EW, in this case) but not their destruction (since the 11.3 µm PAH/[Ne ii]12.81 µm ratio is not modified). Therefore our data support the PAH dilution scenario also claimed by other studies of low-redshift ULIRGs (Desai et al. 2007) and high-redshift SMGs (Menéndez-Delmestre et al. 2009). The destruction of the PAHs (if it would be taking place) would be related to the age of the star-forming regions (hardness of the radiation field).
Moreover, the diffuse regions located in between the H ii, Pa-emitting regions of our LIRGs show 11.3 µm PAH EWs larger (approximately twice) and 11.3 µm PAH/[Ne ii]12.81 µm ratios higher than those measured in the H ii regions (see, e.g., Figure 17). This is in agreement with the idea of these diffuse regions being less massive (have lower intensities, implying higher 11.3 µm PAH EWs, see above) and older (have milder radiation fields, implying higher 11.3 µm PAH/[Ne ii]12.81 µm ratios) than the H ii regions, as it was suggested in §8.1. This also reinforces the idea of the PAH dilution scenario in which the H ii regions would be diluted by the enhanced dust continuum emission that is not otherwise seen in the diffuse regions.
Sumarizing, we have shown that the PAH and MIR continuum emitting regions are not always spatially overlapped and display different properties. For example, the MIR dust continuum is mainly associated with massive, young, Pa-emitting H ii regions, i.e., with current star formation. The PAH emission on the other hand is also characteristic of more diffuse (less massive) and evolved stellar populations, i.e., of recent star formation, that show large 11.3 µm PAH EWs and high 11.3 µm PAH/[Ne ii]12.81 µm ratios. This is very important from the point of view of knowing how recent and where is located the star formation in LIRGs (either Myr or tens of Myr). Depending on the measurement used (MIR dust continuum or PAH emission), different stages in the process of star formation and different locations in galaxies will be probed. Therefore, high spatial resolution observations of local and also high-redshift LIRGs are essential to determine: (1) how recent and (2) where is located the star formation in these galaxies (compact H ii regions and/or diffuse emission?) in a statistical way. This is also ultimately important in order to know whether local and high- LIRGs, ULIRGs and SMGs share the same physical properties and belong to the same galaxy population.
9. Summary
The high spatial resolution afforded by Gemini T-ReCS has allowed us to resolve the nuclei and star-forming regions in our sample of LIRGs on hundred pc scales. In addition, we have been able to separate the AGN contribution (if any) from that of the star formation.
By comparing the nuclear and integrated T-ReCS spectra with those obtained with Spitzer IRS we find that, for LIRGs containing an AGN, at least half of the [S iv]10.51 µm emission arises from the central 150 pc. We have shown that the T-ReCS spectrum of the Southern nucleus of NGC 3256 is very obscured and is totally absorbed between 9 and 11, in contrast to the conclusion reached from the IRS spectrum since it is contaminated by emission from the diffuse medium that surrounds it. Therefore, only with the combination of the exceptional sensitivity of Spitzer and the high spatial resolution of T-ReCS, we can gain a clearer and less confused picture of the central regions of the LIRGs.
-
•
Regarding the individual study of the LIRGs (in the Appendix):
For NGC 3256 we have shown that the integrated spectrum of the northern nucleus is very similar to that of the very nuclear region (0.36″0.36″), with prominent 8.6 and 11.3 µm PAH features and an intense [Ne ii]12.81 µm emission line. On the other hand, the spectrum of the southern nucleus is extremely absorbed and no emission is detected between . IC 4518W shows extended [S iv]10.51 µm line emission out to 0.8″ (265 pc) to the north of the nucleus. We have interpreted this high excitation region as a signature of the presence of a narrow line region. For NGC 5135 we have separated the unresolved AGN component from that of the surrounding H ii and diffuse regions. The Sy2 nucleus of NGC 5135 accounts for at least 50% of the [S iv]10.51 µm emission of the LIRG. The H ii region and the diffuse medium display intense 11.3 µm PAH emission with the latter showing a greater EW. We have resolved the nucleus of NGC 7130. However, the emission from the Sy nucleus and that of the surrounding star-forming regions are still mixed on scales of 100 pc. Both, the very nuclear (0.72″0.36″) and the integrated (0.72″3.6″) spectra show the same features: faint [S iv]10.51 µm emission and intense 11.3 µm PAH and [Ne ii]12.81 µm emission. In all LIRGs we find that the PAH emission is always more extended than the Pa or [Ne ii]12.81 µm emission suggesting that PAHs are not only associated with the youngest ionizing stellar populations but also to a more diffuse medium.
-
•
Regarding the general conclusions:
For NGC 3256, NGC 5135 and NGC 7130, the strength of the silicate feature is lower in the nucleus than in the surrounding regions. While we find a for the Sy2 nuclei of NGC 5135 and NGC 7130, and also for H ii-like nucleus of NGC 3256, the extra-nuclear regions show values up to . The nucleus of IC 4518W shows a deeper absorption, with . Such variations in the depth of the silicate feature have been also observed in some nearby Sy galaxies. We attribute the fact of observing lower values of the in the nucleus than in the surrounding regions to the transition from either the clumpy or compact environment of an AGN or young, nuclear starburst to the more smooth, extended distributions of extra-nuclear star-forming regions.
Both the [Ne ii]12.81 µm line and the 11.3 µm PAH emission are related to the number of ionizing photons as measured from the Pa emission line. However, while we find that the [Ne ii]12.81 µm and Pa LSDs are directly proportional for all the star-forming regions in our LIRGs (slope of 1.000.02), the trend seen between the 11.3 µm PAH and Pa LSDs, although clear, is different for the regions of each LIRG.
The [Ne ii]12.81 µm/Pa ratio does not depend on the Pa EW, that is, on the age of the ionizing stellar populations, suggesting that the [Ne ii]12.81 µm line can be used as a good tracer of the SFR in star-forming regions in LIRGs. On the other hand, the 11.3 µm PAH/Pa ratio is strongly dependent on the Pa EW, and increases as the star-forming regions age, in agreement with the findings obtained by Díaz-Santos et al. (2008). This adds support to the scenario in which PAHs are better tracers of recent (tens of Myr) rather than of current (Myr), massive star formation.
The 11.3 µm PAH/[Ne ii]12.81 µm ratio (equivalent to the 11.3 µm PAH/Pa ratio) also varies with the [Ne ii]12.81 µm LSD, which depends not only on the hardness of the radiation field (age) but also on the intensity (mass density) of the starburst. However, the decreasing of the 11.3 µm PAH/[Ne ii]12.81 µm ratio with increasing [Ne ii]12.81 µm LSD is only related to an age effect, in agreement with the findings above. The intensity of the starburst (in the sense of its mass density) does not seem to modify the 11.3 µm PAH/[Ne ii]12.81 µm ratio. On the other hand, the 11.3 µm PAH EW does not present a clear dependence with the age of the stellar population but it does (mainly for the nuclear regions of NGC 3256) with the intensity of the radiation field. We suggest that an increasing of the starburst mass density causes the PAH to be diluted (through the increasing of the MIR continuum) but not to be destroyed. The MIR dust continuum is mainly associated with massive, young, compact H ii regions, i.e., with current star formation (Myr). The 11.3 µm PAH emission is rather more (but not only) characteristic of more diffuse (less massive) and evolved (tens of Myr) stellar populations, i.e., of recent star formation, showing large 11.3 µm PAH EWs and high 11.3 µm PAH/[Ne ii]12.81 µm ratios.
Disentangling the different effects on the energetics of the PAH features in star-forming regions is not straightforward and more observations are needed to draw statistically significant conclusions. Therefore we want to stress that high spatial resolution observations of local and high- (U)LIRGs are essential to determine: (1) how recent and (2) where is located the star formation in these galaxies (compact H ii regions and/or diffuse emission?). This will allow us to investigate whether they share the same physical properties and therefore belong to the same galaxy population, providing ultimately the missed link between the local and high-redshift Universe when LIRGs dominated the SFR.
Acknowledgments
We thank the referee, Konrad Tristram, for his very useful comments
and suggestions which significantly improved the paper.
This work is based on observations obtained with T-ReCS instrument at the
Gemini South Observatory, which is operated by AURA, Inc., under a
cooperative agreement with the NSF on behalf of the Gemini
partnership: NSF (United States), PPARC (UK), NRC (Canada), CONICYT
(Chile) ARC (Australia), CNPq (Brazil) and CONICET (Argentina).
This work has been supported by the Plan Nacional del Espacio under
grant ESP2005-01480 and ESP20076-65475-C02-01.
TD-S acknowledges support from the Consejo
Superior de Investigaciones Científicas under grant I3P-BPD-2004.
NAL acknowledges work supported by the NSF under Grant No. 0237291.
AA-H also acknowledges support from the Spanish Ministry of Science and
Innovation through grant Proyecto Intramural Especial 200850I003.
TD-S wants to thank Brent Groves for providing
us with the photo-ionization models and for interesting discussions.
This research has made use of the NASA/IPAC Extragalactic Database
(NED), which is operated by the Jet Propulsion Laboratory, California
Institute of Technology, under contract with the National Aeronautics
and Space Administration, and of NASA’s Astrophysics Data System (ADS)
abstract service.
Appendix A -A- NGC 3256: Isolated, Spatially-Resolved Star Formation
A.1. Emission from Star-Forming Regions
The northern nuclear spectrum of NGC 3256 (see Figure 12; if no specification is given, we will refer to the northern nucleus as the main nucleus of this LIRG) shows prominent PAH features (the 8.6 µm PAH feature and the 11.3 µm PAH complex) which are indicative of intense star formation. This is corroborated by the presence of conspicuous [Ne ii]12.81 µm line emission. Furthermore, there is no hint for other lines such as [S iv]10.51 µm that could suggest the existence of an AGN (and/or very young star formation). The northern nucleus of NGC 3256 was previously observed by Martín-Hernández et al. (2006) and Lira et al. (2008). Both works also detected intense PAH features and the [Ne ii]12.81 µm emission line. In an aperture of 1.2″3″, Martín-Hernández et al. (2006) measured a flux of the [Ne ii]12.81 µm emission line in the northern nucleus of NGC 3256 of 2.1erg s-1 cm-2, which means that only 6% of this flux is contained within our T-ReCS nuclear aperture (about 30 times smaller than theirs). In addition, Martín-Hernández et al. (2006) also measured a 11.3 µm PAH flux from the northern nucleus of 2.5erg s-1 cm-2; the T-ReCS nuclear flux accounts for 5% of their measurement. The T-ReCS integrated spectrum (not including the southern nucleus) displays the same features as its nucleus, but with both the 8.6 and 11.3 µm PAHs and the [Ne ii]12.81 µm emission line showing larger EWs (see Figure 12 and Tables 5 and 6).
The southern nucleus of NGC 3256 (the region of interest of this galaxy) is located 5″ to the south of the northern nucleus. It is behind large amounts of dust even making the MIR wavelengths to be very affected by a high extinction (mag; Kotilainen et al. 1996; Lira et al. 2002; Alonso-Herrero et al. 2006a; Díaz-Santos et al. 2008). This is reflected in the -band T-ReCS spectrum as a deep absorption of the Si feature. Figure 12 shows an extremely absorbed continuum whose emission is totally suppressed between 9 and 11. The H ii classification of this nucleus would imply the detection of prominent 8.6 and 11.3 µm PAHs as in the northern one. In fact, Martín-Hernández et al. (2006) and Lira et al. (2008) find both features in their spectrum of the southern nucleus. We do not. The lack of PAH emission in the T-ReCS spectrum is probably due to that our aperture is much smaller than theirs implying that either there is not PAH emission in the very nuclear region or the extinction is that high (mag, with , Rieke & Lebofsky 1985) that prevents us from detecting the PAHs. In fact, their spatial resolutions and, most important, the size of their extraction apertures (22″ 390390 pc) are 5 times larger than ours (0.36″0.36″ 7070 pc). Therefore, their spectrum contains not only the emission from the nucleus but also from the surrounding regions, which includes diffuse continuum and PAH emission. Regarding the [Ne ii]12.81 µm emission line, the flux of the southern nucleus contained in our aperture is only 10% that of Martin-Hernandez et al.’s, suggesting that probably much of the [Ne ii]12.81 µm emission they measure is mostly off-nuclear.
A.2. Spatial Profiles: Differences Between Nuclear and Extra-Nuclear Star-Forming Regions
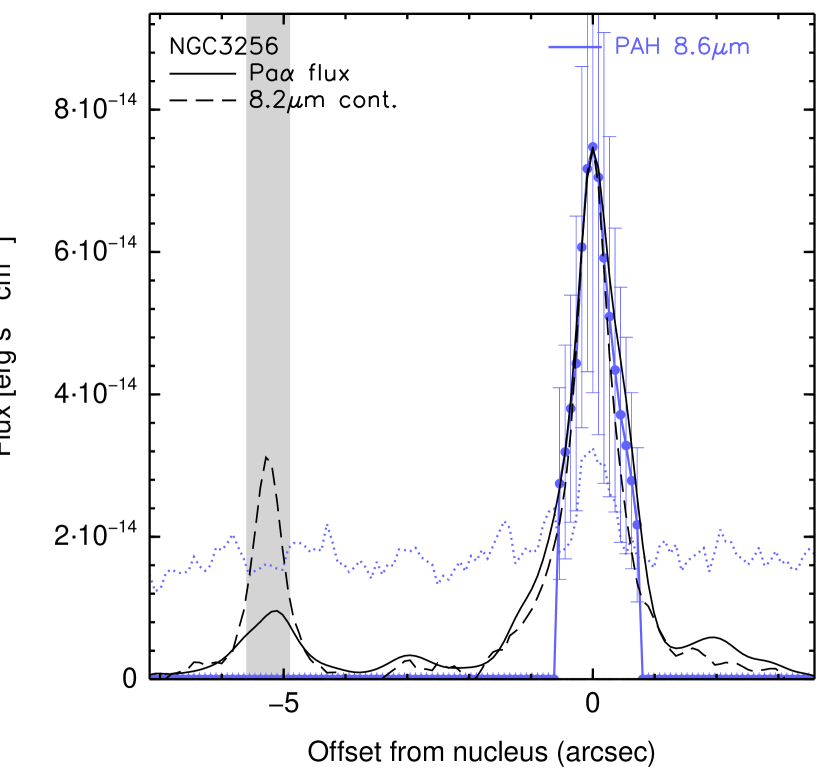
We detect 8.6 µm PAH emission at distances of about 1″ (196 pc) north and south from the northern nucleus (see Figure 13). The 11.3 µm PAH emission is even more extended, out to 2″ to the north. Because the 8.6 µm PAH detection threshold is higher than that of the 11.3 µm PAH we can only measure it in the central regions. There is no PAH emission in the southern nucleus. The [Ne ii]12.81 µm emission line is detected at almost all positions along the slit and, as with the PAH features, its nuclear emission is more extended than the continuum emission.
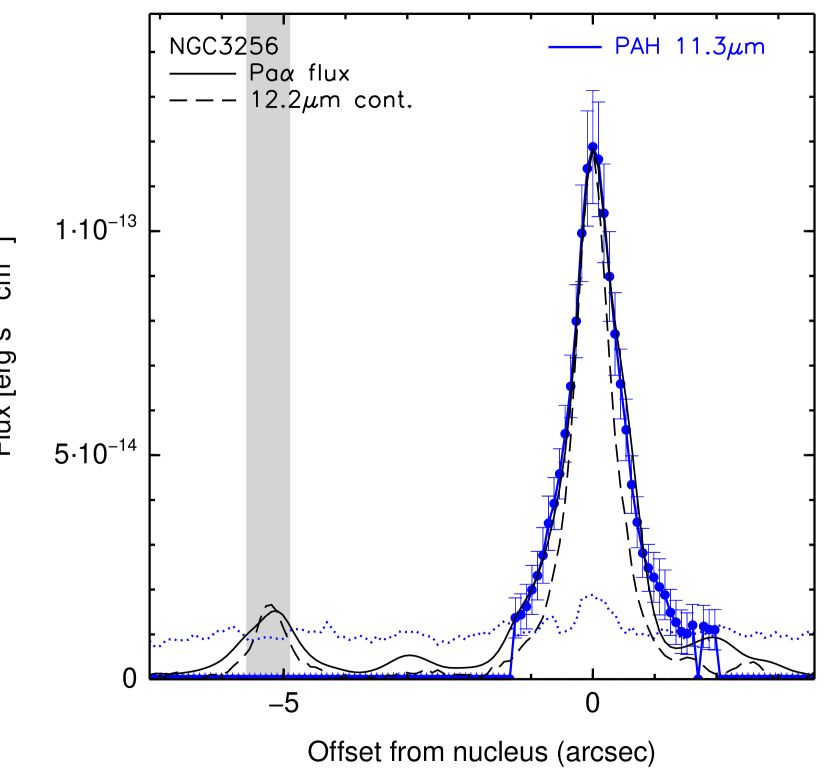
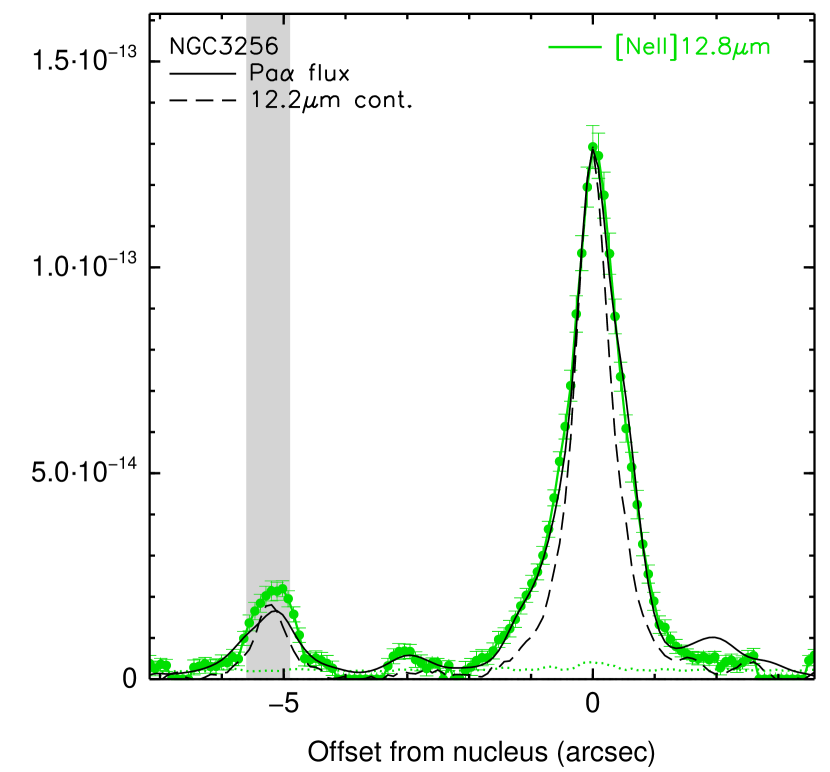
Moreover, the spatial profile of the [Ne ii]12.81 µm emission is remarkably similar to that of Pa. In particular, the [Ne ii]12.81 µm emission is also detected in the southern nucleus. This agreement is not only qualitative but also quantitative as their ratio is almost constant along the slit. This finding is in agreement with previous results that suggest that the [Ne ii]12.81 µm emission line is directly linked to the total number of ionizing photons of a region, that is, to its star-formation rate (see §7, and also Roche et al. 1991; Ho & Keto 2007) as traced by, e.g., the Pa line. The [Ne ii]12.81 µm/Pa ratio is broadly constant (it ranges between , not corrected for extinction). However, small-scale variations (less than an arcsecond, i.e., few hundreds of pc) can be found. Variations in the fraction of Ne + ions, which in turn depends on the age of the ionizing stellar populations (Martín-Hernández et al. 2005), could be responsible for the [Ne ii]12.81 µm vs. Pa differences.
The 11.3/8.6 µm PAH ratio is constant along the slit indicating that the ionization conditions (that are suggested to be traced by the amount of neutral to ionized PAHs; Galliano et al. 2008) do not vary significantly throughout the nuclear region of the LIRG on the physical scales probed here (100 pc). The 11.3 µm PAH/[Ne ii]12.81 µm ratio (not corrected for extinction) is also almost constant () within 1″ from the nucleus (see also Figure 10). However, the ratio starts to increase towards the north (positive offset; between ). A very young population where all the Neon were in the Ne ++ state would show a high 11.3 µm PAH/[Ne ii]12.81 µm ratio and would explain this behavior. However, the Pa EW map of the galaxy (see Díaz-Santos et al. 2008) does not display any enhancement of the Pa EW in this area. In addition, we see a very good correlation (slope of 1.000.02, see §7) between the [Ne ii]12.81 µm and the Pa lines, indicating that all the star formation is accounted by the [Ne ii]12.81 µm emission. We refer the reader to §8.2 with regards to the discussion on the 11.3 µm PAH/[Ne ii]12.81 µm ratio.
The northern nucleus of the galaxy shows lower EWs of the [Ne ii]12.81 µm emission line and 8.6 and 11.3 µm PAHs than its surrounding regions. This is probably because the features are diluted by the more compact continuum emitted by the hot dust that is concentrated towards the nucleus (see also §6 and §8.2).
Appendix B -B- IC 4518W: Isolated AGN Activity
B.1. Signatures of the Sy2 Nucleus and a High-Excitation Region
Unlike NGC 3256, the nuclear spectrum of IC 4518W displays a rather featureless continuum with the exception of the barely detected [S iv]10.51 µm emission line and the [Ne ii]12.81 µm emission line (see Figure 14). It is not clear whether the lack of PAH emission at both 8.6 and 11.3 can be interpreted in terms of absence of star formation, since the PAH molecules could have been destroyed by the Sy2 nucleus of the LIRG. As for NGC 3256, the nuclear and integrated spectra of IC 4518W are very similar. The integrated spectrum of the galaxy (see Figure 14) also shows an almost featureless continuum as the nuclear one, as well as the presence of the [S iv]10.51 µm and the [Ne ii]12.81 µm emission lines. An important remark here is that the flux of the [S iv]10.51 µm line is larger for the integrated emission of the galaxy when it is subtracted from that of the nucleus, than for the nucleus itself. That is, for the rest of the LIRGs in which the [S iv]10.51 µm line is detected, the nuclear emission accounts for at least or around half of the flux seen in their integrated spectra (compare Tables 3 and 4; see also Appendix C and D; the nuclear fluxes of IC 4518W and NGC 5135 have not been corrected for aperture effects). In other words, the [S iv]10.51 µm emission line usually stems from the very nuclear region (pc) of the galaxies except for IC 4518W (see below).
The region of interest of IC 4518W is a region located 0.5″ (165 pc) to the north of the galaxy. Its spectrum is very similar to that of the nucleus, not only in the shape of the continuum but also in its spectral features (see Figure 14). In fact, the [S iv]10.51 µm emission line is as intense as in the nucleus. This is interesting because the nucleus of IC 4518W is unresolved (FWHM ; see Table 2) in continuum emission whereas the [S iv]10.51 µm emission is clearly detected out to 0.8″ (265 pc) north from the nucleus. Indeed, this extended [S iv]10.51 µm emission can explain the difference seen above between the nuclear and integrated spectrum of the galaxy.
B.2. Spatial Profiles: Line Emission in Hard Radiation Fields
Fig 15 shows quantitatively that the [S iv]10.51 µm line emission of the region located to the north of the nucleus (positive offset) is comparable to that of the nucleus. Although the [S iv]10.51 µm line can be produced in very young star-forming regions, we do not detect significant Pa nor [Ne ii]12.81 µm emissions spatially coincident with the [S iv]10.51 µm extended emission. Moreover, we do not detect any of the two dominant 8.6 and 11.3 µm PAHs in the spectrum of the Sy2 nucleus of this LIRG. Thus we conclude that the extended [S iv]10.51 µm emission is most likely associated to the central AGN and produced in an extended narrow line region (NLR) excited by the Seyfert nucleus. Because of the intermediate ionization potential of the [S iv]10.51 µm line, it can be ionized by the AGN emission far away from the nucleus. This has already been found in other Sy2 galaxies, such as Circinus (Roche et al. 2006) or NGC 5506 (Roche et al. 2007), where the [S iv]10.51 µm line is more extended than the dust continuum emission and has been associated to high-excitation (coronal or narrow line) regions.
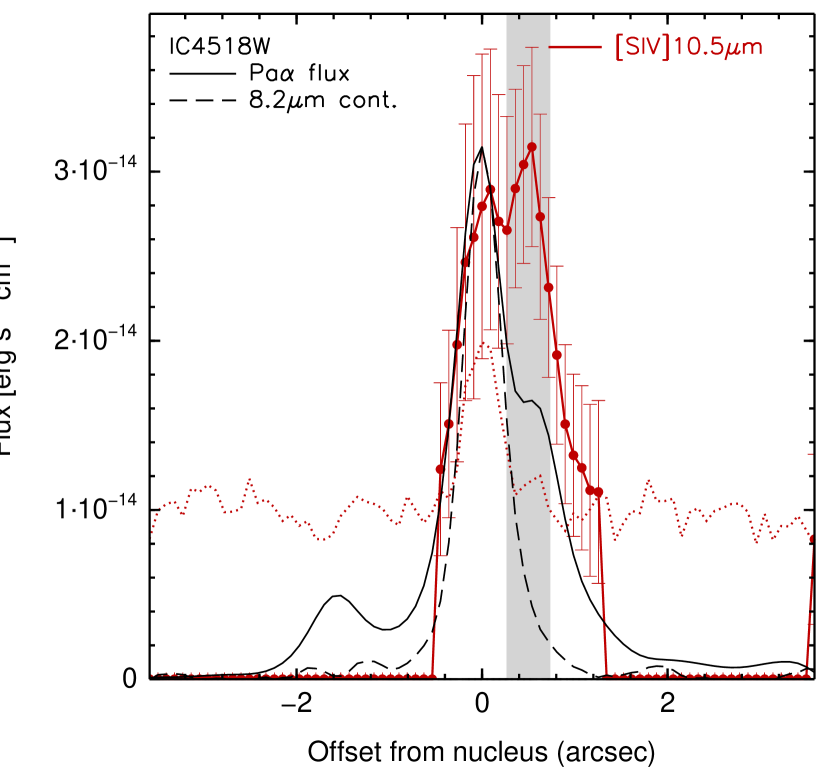
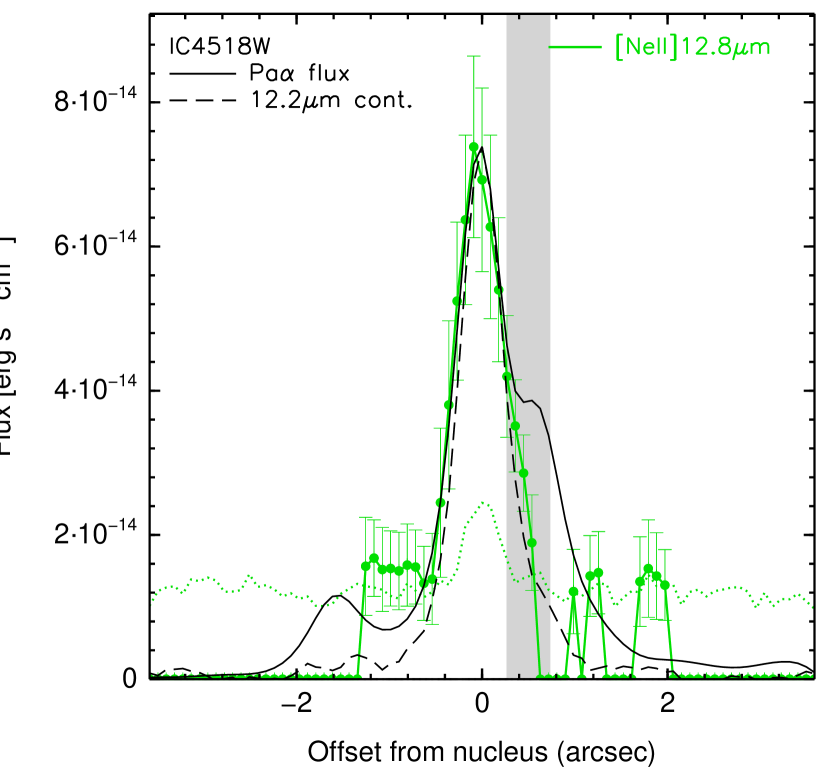
The change on the physical conditions between the nucleus and the location identified as the extended narrow line region is also shown by the [Ne ii]12.81 µm/[S iv]10.51 µm ratio. While it is approximately constant in the nucleus (almost ), the ratio steeply diminishes towards the [S iv]10.51 µm extended emission region. The value measured in the nucleus is in agreement with the limit given by Martín-Hernández et al. (2006), [Ne ii]12.81 µm/[S iv]10.51 µm3, for sources with no PAH detection. They use the [Ne ii]12.81 µm/[S iv]10.51 µm ratio as a measure of the hardness of the radiation field. A higher [Ne ii]12.81 µm/[S iv]10.51 µm ratio implies a softer medium, where PAH emission would be detected. Our values are always below this limit along the slit, in agreement with the lack of PAH emission in this galaxy. The EWs of the [S iv]10.51 µm and the [Ne ii]12.81 µm lines show their lowest values in the nucleus, increasing slowly outwards. This is again an effect of the continuum emission being more spatially compact than the line emission.
Appendix C -C- NGC 5135: Separated, Spatially Resolved SF and AGN Activity
C.1. From an Isolated Sy2 Nucleus to a Circumnuclear H ii Region
The Seyfert 2 nuclear spectrum of NGC 5135 shows intense [S iv]10.51 µm line emission (see Figure 16), suggesting a relatively high ionized medium in agreement with its classification as Seyfert. There is also faint [Ne ii]12.81 µm line emission probably associated with the central AGN as well. Although quantitatively speaking there is no PAH emission, there seems to be a little bump and a peak on the spectra at the positions where the 11.3 µm PAH should be. Following the evidence above, the PAHs are supposed to be depleted in the vicinity of an AGN but in some cases, the molecules can survive to the radiation field if they are shielded, for example, by the star formation itself (Voit 1992; Mason et al. 2007). If this was the case, we could not definitively affirm that there is no star formation in the nuclear region (central pc) of NGC 5135. In any case, the AGN effectively dominates the MIR luminosity of the nucleus and the star formation would account for a very small fraction of it, and if there is any, it must be at a very low level compared with that taking place in the circumnuclear region (see below). Contrarily to NGC 3256 and IC 4518W, the integrated spectrum of NGC 5135 shows significant differences when compared to its nuclear spectrum. In this LIRG the MIR AGN emission is clearly separated from that of the star formation (see Díaz-Santos et al. 2008). The integrated spectrum includes not only the emission from the nucleus but also the emission arising from an H ii region located at about south-west, and from the diffuse region between both (see Figure 1).
Both the H ii and the diffuse emission region of NGC 5135 (the two regions of interest of this galaxy; see Figure 1 and Figure 16) exhibit strong 11.3 µm PAH emission. The MIR continuum near the edges of the spectrum is however significantly brighter in the H ii region. Thus, the diffuse ISM of NGC 5135 is characterized by intense PAH emission but by a fainter continuum emission from hot dust when compared with that of the H ii region. The 11.3 µm PAH EW at the diffuse region is 2 times higher (1) than that measured at H ii region (0.5). This is expected if the typical stellar populations in the region of diffuse emission are not extremely young (10 Myr) neither very massive, which is in agreement with the presence of weak Pa emission. Therefore, the lack of a hot dust continuum (associated with the Pa emission) in the diffuse region would make its 11.3 µm PAH EW larger than in the H ii region, supporting the PAH dilution scenario in star-forming regions (see discussion in §8.2).
On the other hand, the extinction could play a role in this situation. If the PAH and continuum emissions are decoupled, that is, arise from different regions, they can be obscured by different amounts of cold dust, thus leading to different extinctions. There is a correlation between the Pa LSD of star-forming regions and their obscuration (brighter regions are affected by higher extinctions; Calzetti et al. 2007; and Díaz-Santos et al. 2008, their figure 9). Therefore, if the H ii region (that shows bright Pa emission) is more absorbed than the diffuse medium, the strength and shape of the Si absorption feature would make the continuum of the H ii spectrum to be deeper at when compared to the emission at 8 or 13. This is in agreement with what we see in Figure 16 where the diffuse region shows a shallower spectrum. However, this is difficult to test since our data do not enable us to probe the geometry of the regions in detail or how the dust is distributed.
C.2. Spatial Profiles: Tracers of AGN and Star Formation Activity
NGC 5135 is a clear example where star formation and AGN activity are well separated (see Figure 1) with our T-ReCS spatially resolved spectroscopy. While we find 11.3 µm PAH emission outside () the nucleus but not within it, the [S iv]10.51 µm emission line is only detected in the central region (), with little overlap between both features (see Figure 17).
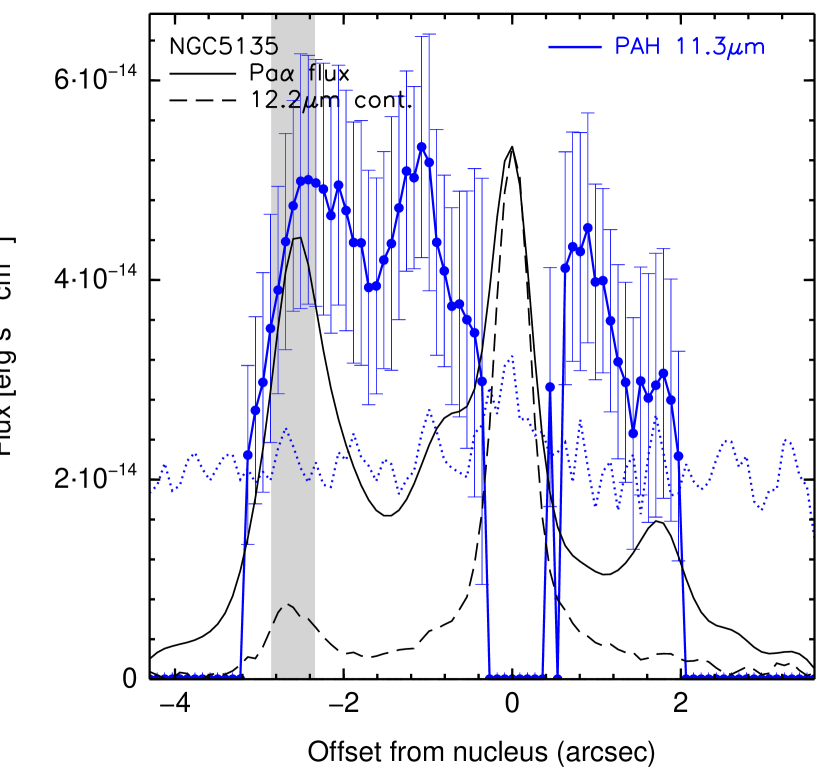
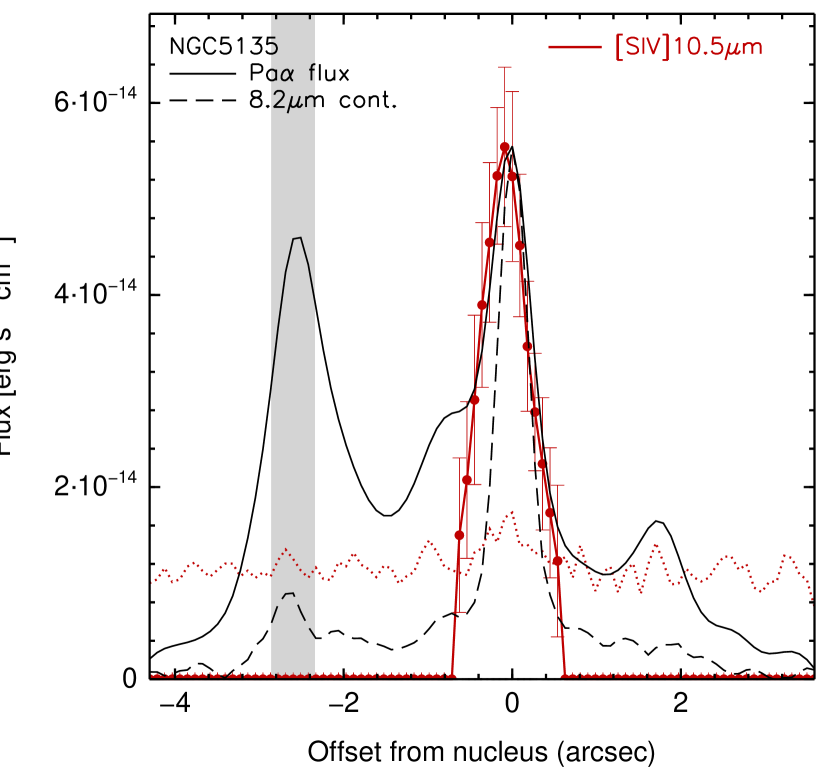
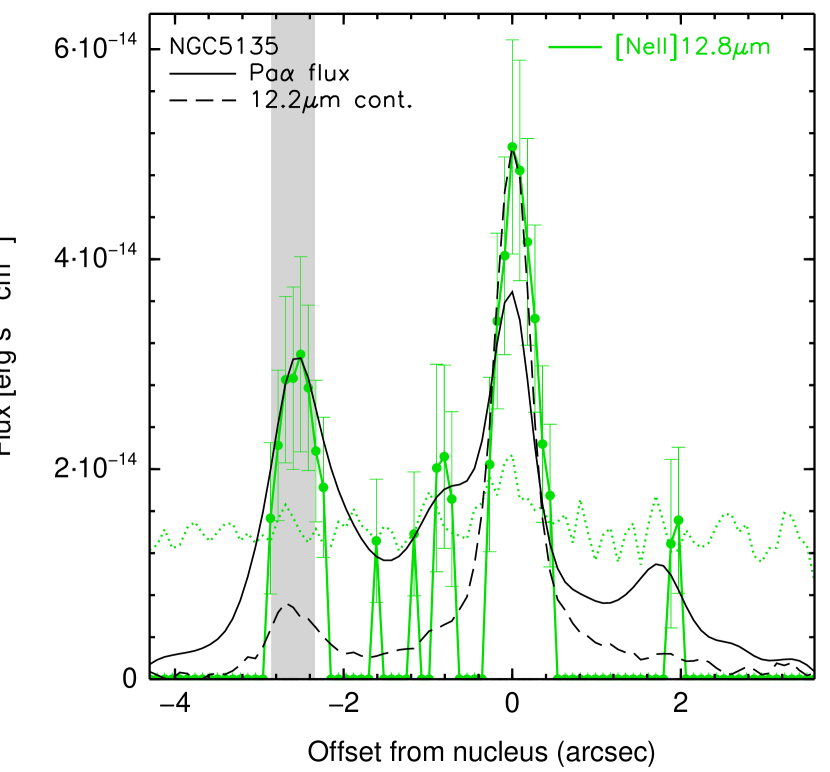
As for NGC 3256, the spatial profile of the [Ne ii]12.81 µm emission line follows well that of the Pa line. There is [Ne ii]12.81 µm emission not only in the nucleus and in the H ii region located at 2.6″ south-west (negative offset), but it is also detected in the Pa bump at 0.8″. However, unlike NGC 3256, which is classified as H ii, the nuclear [Ne ii]12.81 µm emission of NGC 5135 should be mainly associated to the AGN. Therefore we have scaled the Pa profile to the [Ne ii]12.81 µm emission at the location of the H ii region as we found that, for star-forming dominated regions (as in NGC 3256), both emission lines correlate quite well (see §7). Taking this into account, we can see that the nucleus shows a slightly higher [Ne ii]12.81 µm/Pa ratio than the H ii region. This excess might be attributed to the extinction as the [Ne ii]12.81 µm line is less affected by obscuration than Pa.
Fig 17 shows that the 11.3 µm PAH emission is not only produced by the youngest stellar populations as traced by the Pa line emission, but it is also detected in the diffuse ISM. This confirms that the PAH emission is associated not only to the ionizing stars but also to the more evolved stellar populations and their UV flux (see also, e.g., Peeters et al. 2004; Tacconi-Garman et al. 2005). I.e., the spatial profile of the PAH emission profile does not resemble that of the Pa line (see also §8), and the diffuse region shows a 11.3 µm PAH intensity similar to that of the H ii region. On the other hand, the [Ne ii]12.81 µm emission is fainter in the diffuse region and bright where there is an enhancement of the Pa line.
Appendix D -D- NGC 7130: Mixed Star Formation and AGN Activity
D.1. AGN and Star Formation Emissions Together within 100 pc
The MIR emission of the nucleus of NGC 7130 is resolved (Díaz-Santos et al. 2008) and shows signatures of both star formation and AGN activity. Its optical classification as LINER/Sy is in agreement with the detection of the [Ne v]14.32 µm emission line in the Spitzer IRS spectrum of the galaxy (Alonso-Herrero et al. 2009b; Pereira-Santaella et al. 2009b), supporting the existence of an AGN. The T-ReCS nuclear spectrum reveals clear 8.6 and 11.3 µm PAH emission together with the [S iv]10.51 µm emission line (see Figure 18). This is a clear example of the coexistence of PAH emission and an AGN within less than 100 pc. There are two explanations for this: (a) the PAH molecules are far away enough from the AGN so that they cannot be destroyed by its radiation field; (b) the PAH molecules are being shielded in some manner. The integrated T-ReCS spectrum shows the same features as the nuclear spectrum since the nucleus of NGC 7130 is quite compact and outside pc there is no emission (neither continuum nor feature emission).
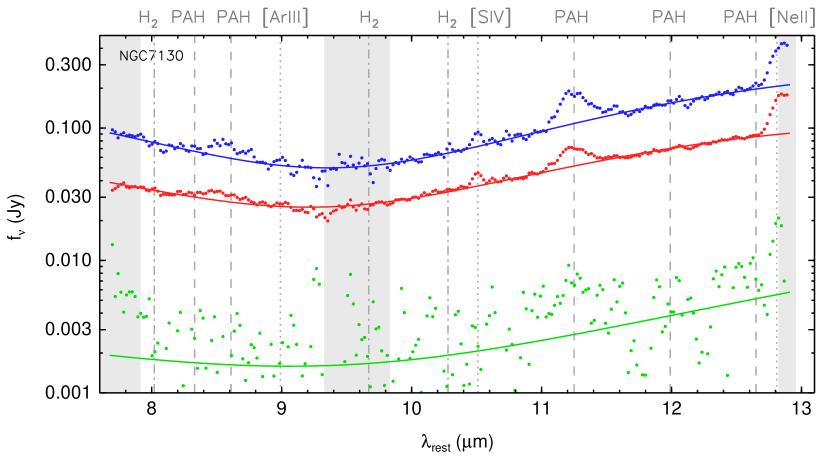
D.2. Spatial Profiles: Star-Formation Surrounding a Sy2 Nucleus
The nucleus of NGC 7130 is a clear example where star formation and AGN activity manifest their characteristic spectral features within the same region (see Figure 19). We find that the [Ne ii]12.81 µm and Pa profiles are as compact as the (resolved) continuum emission. We also detect 8.6 and 11.3 µm PAH emission, but extended within the central 1.5″ of the galaxy. Both, the PAH features, and the [Ne ii]12.81 µm and Pa emission lines clearly indicate that there is star formation within the nuclear region. Moreover, Fig 19 shows that in NGC 7130 the PAH molecules can survive within a distance of less than 100 pc from the AGN without being destroyed. The intrinsic hard (keV) X-ray luminosities () of the AGNs of NGC 7130 and NGC 5135 are very similar (11043 erg s-1; Levenson et al. 2005, and Levenson et al. 2004, respectively). Therefore, the existence of PAH emission in the nucleus of NGC 7130 but not in the nucleus of NGC 5135 suggests that the PAH carriers are not being destroyed in the latter but the absence of PAHs is due to the fact that there is no nuclear star formation (or at least it is very weak). The [S iv]10.51 µm line is also detected (although with a high uncertainty) as in the nucleus of IC 4518W and NGC 5135, and is as compact as the continuum emission.
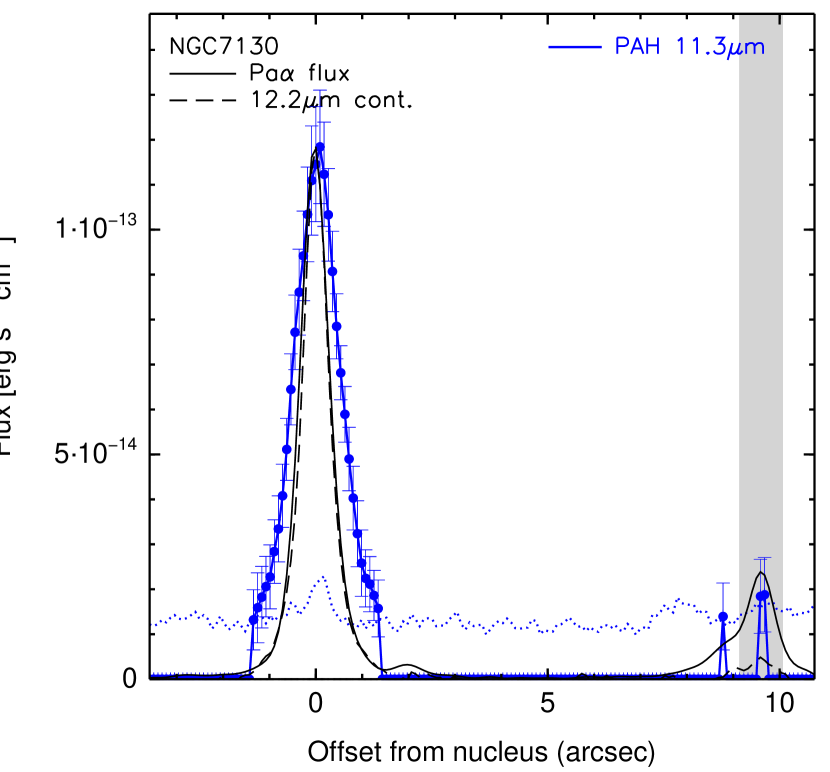
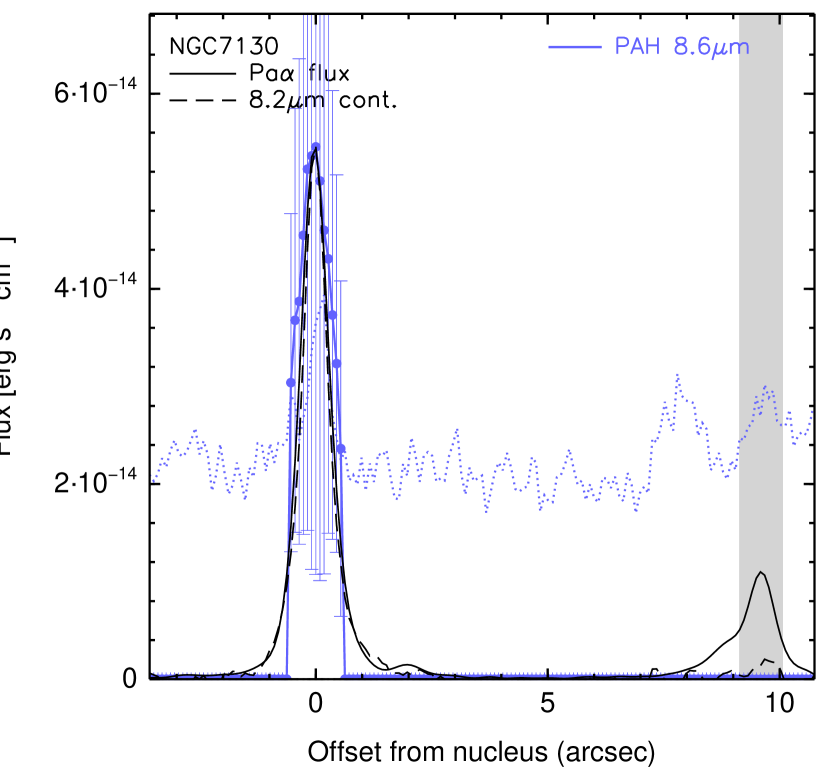
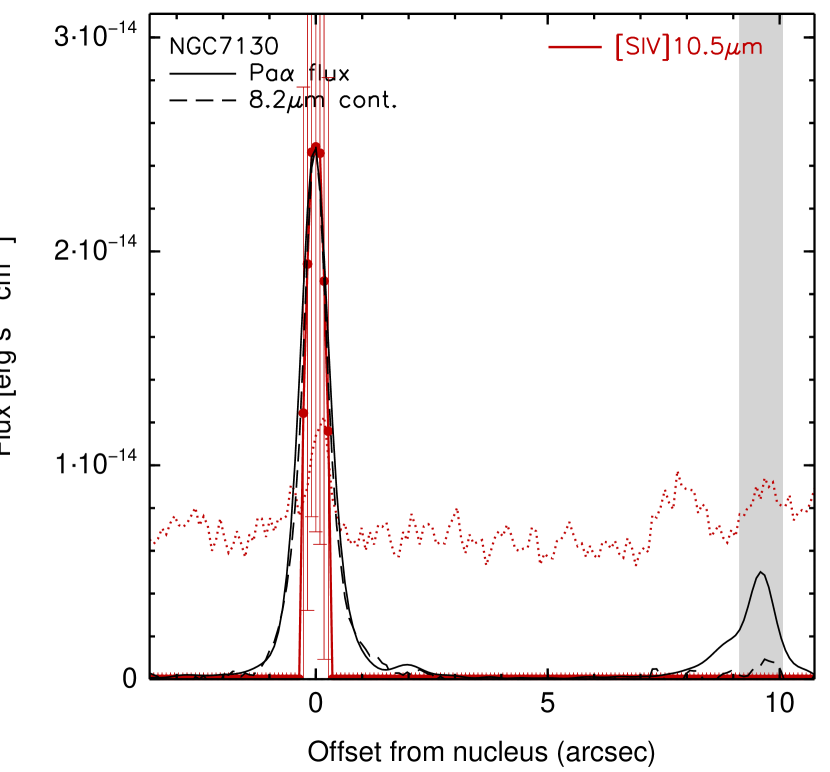
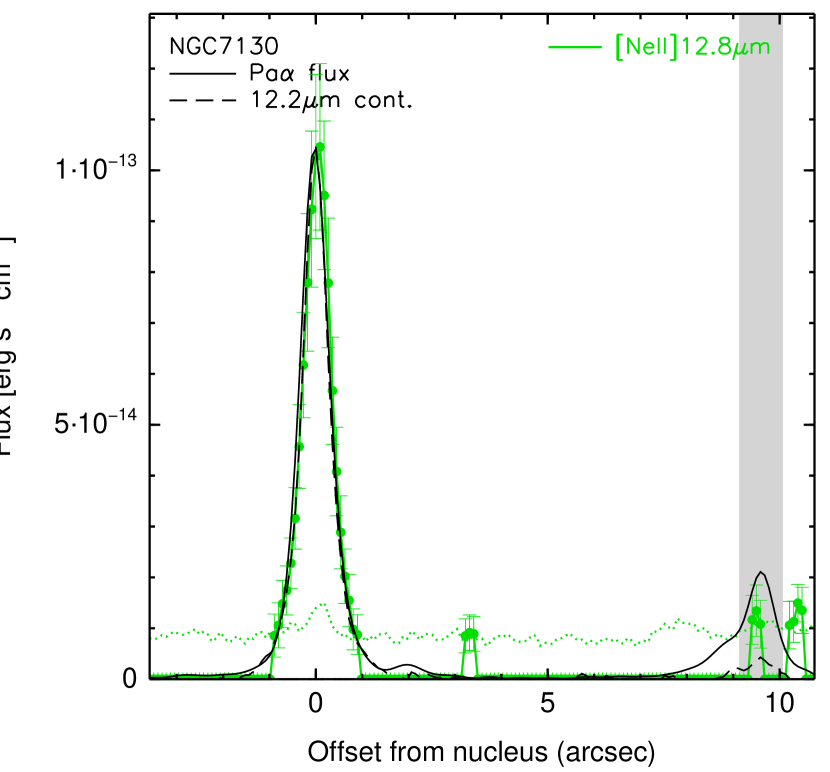
The [Ne ii]12.81 µm/Pa ratio is almost constant in the nuclear region of the galaxy (between within the inner 1″340 pc). The 11.3/8.6 µm PAH ratio is also almost constant along the central 200 pc with a mean value of . This value is slightly higher than that seen in NGC 3256 (), but both are in agreement with the median ratio found by Smith et al. (2007) for the SINGS galaxy sample (1.5). The spatial profile of the 11.3 µm PAH/[Ne ii]12.81 µm ratio has his minimum at the nucleus of the galaxy with a value of 1.1 (similar to that of the nucleus of NGC 3256) and increases outwards from the central region.
The [S iv]10.51 µm/11.3 µm PAH ratio peaks at the nucleus, while the [Ne ii]12.81 µm/[S iv]10.51 µm ratio has the minimum there. The former is due to the fact that the 11.3 µm PAH emission is more extended than the [S iv]10.51 µm line emission. In the same manner, the [S iv]10.51 µm emission seems to be more concentrated than the [Ne ii]12.81 µm emission as the [Ne ii]12.81 µm/[S iv]10.51 µm ratio increases outwards from the nucleus. The nucleus of NGC 7130 is resolved in continuum emission so these variations are indeed real. In fact, this would be in agreement with the [S iv]10.51 µm line emission being the signature of the unresolved AGN emission, and the [Ne ii]12.81 µm line emission being mostly associated to the surrounding star-forming ring seen in the UV (González Delgado et al. 2001; also detected in PAH emission). Because the 8.6 and 11.3 µm PAH emissions are more extended than the continuum and line emissions, the spatial profiles of their EWs show again their minima in the nucleus, increasing outwards. In contrast, the [S iv]10.51 µm EW is approximately constant (within the large uncertainties) confirming that the region from where the [S iv]10.51 µm line emission arises is very compact (at least as compact as the continuum).
References
- Alonso-Herrero et al. (2006a) Alonso-Herrero, A., Colina, L., Packham, C., Díaz-Santos, T., Rieke, G. H., Radomski, J. T., & Telesco, C. M. 2006a, ApJ, 652, L83
- Alonso-Herrero et al. (2009b) Alonso-Herrero, A., Pereira-Santaella, M., Rieke, G. H., Colina, L., Engelbracht, C. W., Perez-Gonzalez, P., Diaz-Santos, T., & Smith, J. D. T. 2009b, astro-ph:0909.0658
- Alonso-Herrero et al. (2006b) Alonso-Herrero, A., Rieke, G. H., Rieke, M. J., Colina, L., Pérez-González, P. G., & Ryder, S. D. 2006b, ApJ, 650, 835
- Alonso-Herrero et al. (2009a) Alonso-Herrero, A., et al. 2009a, ApJ, 697, 660
- Bedregal et al. (2009) Bedregal, A. G., Colina, L., Alonso-Herrero, A., & Arribas, S. 2009, ApJ, 698, 1852
- Beirão et al. (2006) Beirão, P., Brandl, B. R., Devost, D., Smith, J. D., Hao, L., & Houck, J. R. 2006, ApJ, 643, L1
- Brandl et al. (2006) Brandl, B. R., et al. 2006, ApJ, 653, 1129
- Calzetti et al. (2000) Calzetti, D., Armus, L., Bohlin, R. C., Kinney, A. L., Koornneef, J., & Storchi-Bergmann, T. 2000, ApJ, 533, 682
- Calzetti et al. (2007) Calzetti, D., et al. 2007, ApJ, 666, 870
- Cohen et al. (1999) Cohen, M., Walker, R. G., Carter, B., Hammersley, P., Kidger, M., & Noguchi, K. 1999, AJ, 117, 1864
- Desai et al. (2007) Desai, V., et al. 2007, ApJ, 669, 810
- Díaz-Santos et al. (2008) Díaz-Santos, T., Alonso-Herrero, A., Colina, L., Packham, C., Radomski, J. T., & Telesco, C. M. 2008, ApJ, 685, 211
- Díaz-Santos et al. (2007) Díaz-Santos, T., Alonso-Herrero, A., Colina, L., Ryder, S. D., & Knapen, J. H. 2007, ApJ, 661, 149
- Dopita et al. (2006) Dopita, M. A., et al. 2006, ApJS, 167, 177
- Egami et al. (2006) Egami, E., Neugebauer, G., Soifer, B. T., Matthews, K., Becklin, E. E., & Ressler, M. E. 2006, AJ, 131, 1253
- Engelbracht et al. (2008) Engelbracht, C. W., Rieke, G. H., Gordon, K. D., Smith, J.-D. T., Werner, M. W., Moustakas, J., Willmer, C. N. A., & Vanzi, L. 2008, ApJ, 678, 804
- Engelbracht et al. (2006) Engelbracht, C. W., et al. 2006, ApJ, 642, L127
- Farrah et al. (2007) Farrah, D., et al. 2007, ApJ, 667, 149
- Farrah et al. (2008) —. 2008, ApJ, 677, 957
- Gallais et al. (2004) Gallais, P., Charmandaris, V., Le Floc’h, E., Mirabel, I. F., Sauvage, M., Vigroux, L., & Laurent, O. 2004, A&A, 414, 845
- Galliano et al. (2008) Galliano, F., Madden, S. C., Tielens, A. G. G. M., Peeters, E., & Jones, A. P. 2008, ApJ, 679, 310
- García-Marín et al. (2006) García-Marín, M., Colina, L., Arribas, S., Alonso-Herrero, A., & Mediavilla, E. 2006, ApJ, 650, 850
- Genzel et al. (1998) Genzel, R., et al. 1998, ApJ, 498, 579
- González Delgado et al. (2001) González Delgado, R. M., Heckman, T., & Leitherer, C. 2001, ApJ, 546, 845
- González Delgado et al. (1998) González Delgado, R. M., Heckman, T., Leitherer, C., Meurer, G., Krolik, J., Wilson, A. S., Kinney, A., & Koratkar, A. 1998, ApJ, 505, 174
- Gordon et al. (2008) Gordon, K. D., Engelbracht, C. W., Rieke, G. H., Misselt, K. A., Smith, J.-D. T., & Kennicutt, Jr., R. C. 2008, ApJ, 682, 336
- Groves et al. (2008) Groves, B., Dopita, M. A., Sutherland, R. S., Kewley, L. J., Fischera, J., Leitherer, C., Brandl, B., & van Breugel, W. 2008, ApJS, 176, 438
- Ho & Keto (2007) Ho, L. C., & Keto, E. 2007, ApJ, 658, 314
- Houck et al. (2007) Houck, J. R., Weedman, D. W., Le Floc’h, E., & Hao, L. 2007, ApJ, 671, 323
- Kaneda et al. (2008) Kaneda, H., Onaka, T., Sakon, I., Kitayama, T., Okada, Y., & Suzuki, T. 2008, ApJ, 684, 270
- Kotilainen et al. (1996) Kotilainen, J. K., Moorwood, A. F. M., Ward, M. J., & Forbes, D. A. 1996, A&A, 305, 107
- Le Floc’h et al. (2005) Le Floc’h, E., et al. 2005, ApJ, 632, 169
- Leitherer et al. (1999) Leitherer, C., et al. 1999, ApJS, 123, 3
- Levenson et al. (2007) Levenson, N. A., Sirocky, M. M., Hao, L., Spoon, H. W. W., Marshall, J. A., Elitzur, M., & Houck, J. R. 2007, ApJ, 654, L45
- Levenson et al. (2004) Levenson, N. A., Weaver, K. A., Heckman, T. M., Awaki, H., & Terashima, Y. 2004, ApJ, 602, 135
- Levenson et al. (2005) —. 2005, ApJ, 618, 167
- Lípari et al. (2000) Lípari, S., Díaz, R., Taniguchi, Y., Terlevich, R., Dottori, H., & Carranza, G. 2000, AJ, 120, 645
- Lira et al. (2008) Lira, P., Gonzalez-Corvalan, V., Ward, M., & Hoyer, S. 2008, MNRAS, 384, 316
- Lira et al. (2002) Lira, P., Ward, M., Zezas, A., Alonso-Herrero, A., & Ueno, S. 2002, MNRAS, 330, 259
- Lutz et al. (1998b) Lutz, D., Spoon, H. W. W., Rigopoulou, D., Moorwood, A. F. M., & Genzel, R. 1998b, ApJ, 505, L103
- Madden et al. (2006) Madden, S. C., Galliano, F., Jones, A. P., & Sauvage, M. 2006, A&A, 446, 877
- Martín-Hernández et al. (2006) Martín-Hernández, N. L., Schaerer, D., Peeters, E., Tielens, A. G. G. M., & Sauvage, M. 2006, A&A, 455, 853
- Martín-Hernández et al. (2005) Martín-Hernández, N. L., Schaerer, D., & Sauvage, M. 2005, A&A, 429, 449
- Mason et al. (2006) Mason, R. E., Geballe, T. R., Packham, C., Levenson, N. A., Elitzur, M., Fisher, R. S., & Perlman, E. 2006, ApJ, 640, 612
- Mason et al. (2007) Mason, R. E., Levenson, N. A., Packham, C., Elitzur, M., Radomski, J., Petric, A. O., & Wright, G. S. 2007, ApJ, 659, 241
- Menéndez-Delmestre et al. (2009) Menéndez-Delmestre, K., et al. 2009, ApJ, 699, 667
- Nenkova et al. (2008a) Nenkova, M., Sirocky, M. M., Ivezić, Ž., & Elitzur, M. 2008a, ApJ, 685, 147
- Nenkova et al. (2008b) Nenkova, M., Sirocky, M. M., Nikutta, R., Ivezić, Ž., & Elitzur, M. 2008b, ApJ, 685, 160
- Packham et al. (2005) Packham, C., Radomski, J. T., Roche, P. F., Aitken, D. K., Perlman, E., Alonso-Herrero, A., Colina, L., & Telesco, C. M. 2005, ApJ, 618, L17
- Peeters et al. (2004) Peeters, E., Spoon, H. W. W., & Tielens, A. G. G. M. 2004, ApJ, 613, 986
- Pereira-Santaella et al. (2009a) Pereira-Santaella, M., Alonso-Herrero, A., Rieke, G. H., & et al. 2009a, ApJ, submitted
- Pereira-Santaella et al. (2009b) —. 2009b, ApJ, in preparation
- Pérez-González et al. (2005) Pérez-González, P. G., et al. 2005, ApJ, 630, 82
- Povich et al. (2007) Povich, M. S., et al. 2007, ApJ, 660, 346
- Rieke & Lebofsky (1985) Rieke, G. H., & Lebofsky, M. J. 1985, ApJ, 288, 618
- Rigby & Rieke (2004) Rigby, J. R., & Rieke, G. H. 2004, ApJ, 606, 237
- Rigopoulou et al. (1999) Rigopoulou, D., Spoon, H. W. W., Genzel, R., Lutz, D., Moorwood, A. F. M., & Tran, Q. D. 1999, AJ, 118, 2625
- Roche et al. (1991) Roche, P. F., Aitken, D. K., Smith, C. H., & Ward, M. J. 1991, MNRAS, 248, 606
- Roche et al. (2007) Roche, P. F., Packham, C., Aitken, D. K., & Mason, R. E. 2007, MNRAS, 375, 99
- Roche et al. (2006) Roche, P. F., Packham, C., Telesco, C. M., Radomski, J. T., Alonso-Herrero, A., Aitken, D. K., Colina, L., & Perlman, E. 2006, MNRAS, 367, 1689
- Sanders et al. (2003) Sanders, D. B., Mazzarella, J. M., Kim, D.-C., Surace, J. A., & Soifer, B. T. 2003, AJ, 126, 1607
- Sanders & Mirabel (1996) Sanders, D. B., & Mirabel, I. F. 1996, ARA&A, 34, 749
- Sirocky et al. (2008) Sirocky, M. M., Levenson, N. A., Elitzur, M., Spoon, H. W. W., & Armus, L. 2008, ApJ, 678, 729
- Smith et al. (2007) Smith, J. D. T., et al. 2007, ApJ, 656, 770
- Snijders et al. (2007) Snijders, L., Kewley, L. J., & van der Werf, P. P. 2007, ApJ, 669, 269
- Tacconi-Garman et al. (2005) Tacconi-Garman, L. E., Sturm, E., Lehnert, M., Lutz, D., Davies, R. I., & Moorwood, A. F. M. 2005, A&A, 432, 91
- Thornley et al. (2000) Thornley, M. D., Schreiber, N. M. F., Lutz, D., Genzel, R., Spoon, H. W. W., Kunze, D., & Sternberg, A. 2000, ApJ, 539, 641
- Voit (1992) Voit, G. M. 1992, MNRAS, 258, 841
- Weedman & Houck (2008) Weedman, D. W., & Houck, J. R. 2008, ApJ, 686, 127
- Wu et al. (2005) Wu, H., Cao, C., Hao, C.-N., Liu, F.-S., Wang, J.-L., Xia, X.-Y., Deng, Z.-G., & Young, C. K.-S. 2005, ApJ, 632, L79
- Wu et al. (2007) Wu, H., Zhu, Y.-N., Cao, C., & Qin, B. 2007, ApJ, 668, 87
- Wu et al. (2006) Wu, Y., Charmandaris, V., Hao, L., Brandl, B. R., Bernard-Salas, J., Spoon, H. W. W., & Houck, J. R. 2006, ApJ, 639, 157