HI and Star Formation Properties of Massive Galaxies: First Results from the GALEX Arecibo SDSS Survey
Abstract
The GALEX Arecibo SDSS Survey (GASS) is an ambitious program designed to investigate the cold gas properties of massive galaxies, a challenging population for Hi studies. Using the Arecibo radio telescope, GASS is gathering high-quality Hi-line spectra for an unbiased sample of 1000 galaxies with stellar masses greater than M⊙ and redshifts , uniformly selected from the SDSS spectroscopic and GALEX imaging surveys. The galaxies are observed until detected or until a low gas mass fraction limit (1.55%) is reached. We present initial results based on the first Data Release, which consists of 20% of the final GASS sample. We use this data set to explore the main scaling relations of Hi gas fraction with galaxy structure and NUV colour, and show our best fit plane describing the relation between gas fraction, stellar mass surface density and NUV colour. Interesting outliers from this plane include gas-rich red sequence galaxies that may be in the process of regrowing their disks, as well as blue, but gas-poor spirals.
Keywords:
Galaxy surveys; Galaxy evolution; HI, optical and UV:
95.80.+p, 95.85.Bh, 95.85.Kr, 95.85.Mt, 98.62.-g, 98.62.Ve1 Introduction
While the distinction between red, old ellipticals and blue, star-forming spirals has been known for a long time, recent work based on the Sloan Digital Sky Survey (SDSS, York et al. (2000)) has shown that galaxies appear to divide into two distinct “families” at a stellar mass 3 M⊙ Strateva et al. (2001); Kauffmann et al. (2003); Baldry et al. (2004). Lower mass galaxies typically have young stellar populations, low surface mass densities and the low concentrations characteristic of disks. On the other hand, galaxies with old stellar populations, high surface mass densities and the high concentrations typical of bulges tend to have higher mass. It is clearly important to understand why there should be a characteristic mass scale where galaxies transition from young to old. And, in order to understand how such transition takes place, it is critical to study the cold Hi gas, which is the source of the material that will eventually form stars. Hi studies of transition objects require large and uniform samples spanning a wide range in gas fraction, stellar mass and other galaxy properties (e.g., structural parameters and star formation). Although blind surveys offer the required uniformity, Hi studies of transition galaxies are currently not possible because the depths reached by existing wide-area blind Hi surveys are very shallow compared to surveys such as the SDSS. The GALEX Arecibo SDSS Survey (GASS) is a new Hi survey specifically designed to obtain Hi measurements of 1000 massive galaxies in the local universe, selected only by redshift and stellar mass. The first Data Release (DR1) and initial results are presented in Catinella et al. (2009). GASS is assembling the first statistically significant sample of massive galaxies with homogeneously measured stellar masses, star formation rates and gas properties. This unique data set will allow us to investigate if and how the cold gas responds to a variety of different physical conditions in the galaxy, thus yielding insights on the physical processes that regulate gas accretion and its conversion into stars in massive systems.
2 Survey Design and Sample Selection
The GASS targets are located within the intersection of the footprints of the SDSS primary spectroscopic survey, the projected GALEX Medium Imaging Survey and the Arecibo Legacy Fast ALFA (ALFALFA, Giovanelli et al. (2005)) Hi survey. Existing ALFALFA coverage increases our survey efficiency by allowing us to remove from the GASS target list any objects already detected by ALFALFA (20% of the GASS sample). As already mentioned, the targets are selected only by redshift () and stellar mass ( M⊙). Our selected stellar mass range straddles the “transition mass” ( M⊙) above which galaxies show a marked decrease in their present to past-averaged star formation rates. The GASS targets are observed until detected or until a low gas mass fraction limit is reached. Practically, we have set a gas mass fraction limit of for galaxies with M⊙, and a constant gas mass limit M⊙ for galaxies with smaller stellar masses. This corresponds to a gas fraction limit for the whole sample. This allows us to detect galaxies with gas fractions significantly below those of the Hi-rich ALFALFA detections at the same redshifts, and find early-type transition galaxies harboring significant reservoirs of gas.
Since the ALFALFA and GALEX surveys are on-going, we have defined a GASS parent sample (12006 galaxies), based on SDSS DR6 and the maximal ALFALFA footprint, from which the targets for Arecibo observations are extracted. The final GASS sample will include 1000 galaxies, chosen by randomly selecting a subset which balances the distribution across stellar mass and which maximizes existing GALEX exposure time.
3 Gas Fraction Scaling Relations
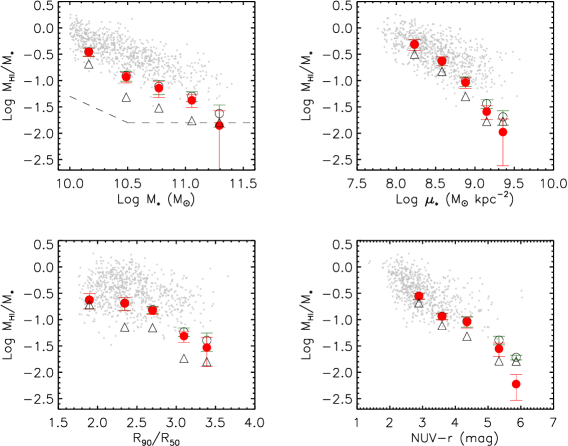
In Figure 1, we show how the average Hi mass fraction of massive
galaxies varies as a function of stellar mass, stellar mass surface
density (defined as , where
is the radius containing 50% of the Petrosian flux in z-band,
in kpc units), concentration index (defined as , where
and are the radii enclosing 90% and 50% of the
r-band Petrosian flux, respectively) and observed NUV colour
(corrected for Galactic extinction only).
Large circles and triangles represent average and median gas fractions
in a given bin (computed after correcting the sample for the fact that
we do not re-observe objects already detected by
ALFALFA; see Catinella et al. (2009) for details). We included the non-detections
with their Hi masses set to either zero (filled circles) or to their
upper limits (empty circles and triangles).
As can be seen, the answer is insensitive to the way we treat
the galaxies without Hi detections, except for the very most massive,
dense and red galaxies. For comparison, we also show galaxies in the
GASS parent sample detected by ALFALFA (dots). It is clear that the
shallower, blind Hi survey is biased to significantly higher gas
fractions compared to our estimates of the global average.
As these plots show, the gas content of massive galaxies decreases
with increasing , , concentration index, and observed NUV colour.
The strongest correlations are with and NUV.
We also notice that the difference between the mean
and median values of / is smallest when it is plotted as a function
of and NUV. This is because these two properties
yield relatively tight correlations without significant tails to low values
of gas mass fraction.
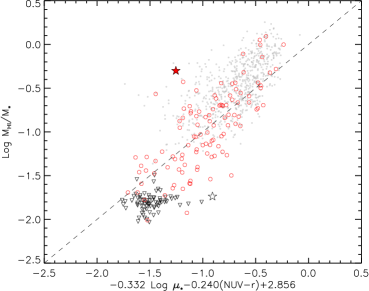
One of the key goals of the GASS survey is to identify and quantify the incidence of transition objects, which might be moving between the blue, star-forming cloud and the red sequence of passively-evolving galaxies. Depending on their path to or from the red sequence, these objects should show signs of recent quenching of star formation or accretion of gas, respectively. In order to establish what is the normal gas content of a galaxy of given mass, structural properties and star formation rate, we have fit a plane to the 2-dimensional relation between Hi mass fraction, stellar surface mass density, and NUV colour. Objects that deviate strongly from the average behavior of the sample are the best candidates for galaxies that might be transitioning between the blue and the red sequences. The gas fractions obtained from our best fit relation are compared with measured ones in Figure 2. ALFALFA galaxies and non-detections were not used in the fit and are shown for comparison only. Galaxies which are anomalously gas-rich given their colours and densities scatter above the mean relation, while those that are gas-poor scatter below. This is clearly demonstrated by the Hi-rich ALFALFA galaxies, which are preferentially found above the line. Marked on the diagram is GASS 3505 (filled star), a galaxy that has optical morphology and colours characteristic of a normal elliptical, but a 50% Hi mass fraction. Also interesting are the galaxies with low Hi mass fractions, but that are still forming stars. These galaxies are found near the bottom the plot, but shifted to the right, as exemplified by GASS 7050 (empty star), a gas-poor disk galaxy that was not detected in Hi. These may be systems where the Hi gas has recently been stripped by tidal interactions or by ram-pressure exerted by intergalactic gas, or where other feedback processes have expelled the gas. In future work, we plan to investigate these different classes of transition galaxy in more detail.
References
- York et al. (2000) D. G. York, J. Adelman, J. E. Anderson, Jr., et al., AJ 120, 1579–1587 (2000).
- Strateva et al. (2001) I. Strateva, Ž. Ivezić, G. R. Knapp, et al., AJ 122, 1861–1874 (2001).
- Kauffmann et al. (2003) G. Kauffmann, T. M. Heckman, C. Tremonti, et al., MNRAS 346, 1055–1077 (2003).
- Baldry et al. (2004) I. K. Baldry, K. Glazebrook, J. Brinkmann, et al., ApJ 600, 681–694 (2004).
- Catinella et al. (2009) B. Catinella, D. Schiminovich, G. Kauffmann et al., MNRAS in press, arXiv:0912.1610 (2009).
- Giovanelli et al. (2005) R. Giovanelli, M. P. Haynes, B. R. Kent, et al., AJ 130, 2598–2612 (2005).