How Is Star Formation Quenched in Massive Galaxies?
Abstract
The bimodality in observed present-day galaxy colours has long been a challenge for hierarchical galaxy formation models, as it requires some physical process to quench (and keep quenched) star formation in massive galaxies. Here we examine phenomenological models of quenching by post-processing the star formation histories of galaxies from cosmological hydrodynamic simulations that reproduce observations of star-forming galaxies reasonably well. We consider recipes for quenching based on major mergers, halo mass thresholds, gas temperature thresholds, and variants thereof. We compare the resulting simulated star formation histories to observed colour-magnitude diagrams and red and blue luminosity functions from SDSS. The merger and halo mass quenching scenarios each yield a distinct red sequence and blue cloud of galaxies that are in broad agreement with data, albeit only under rather extreme assumptions. In detail, however, the simulated red sequence slope and amplitude in both scenarios are somewhat discrepant, perhaps traceable to low metallicities in simulated galaxies. Merger quenching produces more massive blue galaxies, earlier quenching, and more frosting of young stars; comparing to relevant data tends to favor merger over halo mass quenching. Although physically-motivated quenching models can produce a red sequence, interesting generic discrepancies remain that indicate that additional physics is required to reproduce the star formation and enrichment histories of red and dead galaxies.
keywords:
galaxies:evolution – galaxies: luminosity function1 Introduction
Galaxies in the local universe broadly fall into two main categories: blue star-forming disks typically found in lower-density environments, and red and “dead” ellipticals found in galaxy clusters. Some of the earliest extragalactic research revealed the two main morphological categories (e.g. Hubble, 1926), and later work uncovered relationships between morphologies and larger scale environments (Oemler, 1974; Davis & Geller, 1976; Dressler, 1980). More recent work employing data from large surveys has solidified a picture of galaxy bimodality, showing distinct divisions in galaxy colour (Strateva et al., 2001; Baldry et al., 2004; Balogh et al., 2004), which serves as a proxy for star formation rate per unit stellar mass. Surveys such as the Sloan Digital Sky Survey (SDSS) have characterized the statistics of red and blue galaxies to remarkable precision. Red spheroids dominate the massive galaxy population (with stellar masses above ), while less massive galaxies tend to be star-forming disks (Kauffmann et al., 2003c), with luminosity functions showing that the relative fraction of red galaxies grows with luminosity. Surveys pushing to higher redshifts have robustly demonstrated that galaxy bimodality exists out to redshift (Bell et al., 2004b; Weiner et al., 2005; Willmer et al., 2006), and possibly to and beyond (Kriek et al., 2008; Taylor et al., 2009; Brammer et al., 2009). The properties and evolution of massive galaxies is one of the best-studied observational areas of extragalactic astronomy (e.g. Faber et al., 2007).
1.1 Why Is Quenching Needed?
Despite the accumulating wealth of data, the physical origin of the bimodality in galaxy properties remains poorly understood. Red passive galaxies evolve from blue star-forming ones, in the sense that galaxies dominated by old stars today must have built up their stellar mass through star formation at early epochs. Early theories of galaxy formation proposed that primordial clouds of gas collapsed under gravity to form rotating discs that harbor star formation (e.g. Eggen et al., 1962). In hierarchical models, smaller galaxies then merge to build up larger ones (e.g. White & Rees, 1978). Such mergers are thought to be capable of transforming spirals into ellipticals through well-understood dynamical processes (Toomre & Toomre, 1972; Mihos & Hernquist, 1996), but it is less clear why this also results in a colour transformation from blue and star-forming to red and dead. Recent efforts to measure the global mass build-up of the red galaxy population over cosmic time strongly suggest this type of transformation. The total stellar mass in red galaxies has grown by roughly a factor of two since z1, whereas blue galaxies have changed little (Bell et al., 2004b; Faber et al., 2007). Furthermore, evidence suggests the transition from blue to red is rapid, Gyr (Bell et al., 2004b; Blanton, 2006).
These data call for some mechanism(s) that “quench,” or quickly shut off, star formation. Given the correlation between morphology and colour, such mechanisms (or related ones) must also lead to morphological transformation of disk-dominated galaxies into bulge-dominated ones, either through disruption or disk fading and bulge growth. Requiring that the star formation quenching occurs rapidly likely excludes the possibility that galaxies simply consume all of their available fuel supply. Even without the rapid quenching requirement, analytic arguments suggest that the dense central regions of hot halos should cool rapidly onto galaxies in so-called cooling flows, which are not observed. Furthermore, simulations show that (barring new physics) filaments in the intergalactic medium can also continuously feed galaxies with fresh supplies of cold gas (Kereš et al., 2009b; Brooks et al., 2009). This implies that feedback associated with star formation is unlikely to quench galaxies, since red and dead galaxies have no star formation yet must remain quenched over the majority of cosmic time. Hence some additional physical process is required to quench star formation.
1.2 Mechanisms that quench star formation
There have been a number of mechanisms proposed to provide quenching. Each mechanism either heats gas to the point where it cannot collapse to form stars (“preventative” feedback) or expels gas that would otherwise form stars (“ejective” feedback) (Kereš et al., 2009a). In this work, we focus on quenching in massive central galaxies, so we do not address mechanisms that may quench star formation in small satellite galaxies such as ram pressure or tidal stripping and “strangulation” (Gunn & Gott, 1972; Balogh et al., 2000).
One well-studied mechanism is virial shock heating of intergalactic gas falling into a galactic dark matter halo. As gas falls in toward the central galaxy, its gravitational energy converts to heat. In halos with masses above M☉, radiative cooling cannot keep up with gravitational heating, and a halo of hot virialized gas forms near the virial radius (Birnboim & Dekel, 2003; Kereš et al., 2005; Dekel & Birnboim, 2006). This hot halo shocks infalling cold gas immediately to the viral temperature. Although it may succeed for 2 Gyr, virial shock heating alone cannot quench all star formation, since the hot halo gas should cool via radiation and condense to form stars in the centres of massive halos (Birnboim et al., 2007). Additional heating of the hot halo, perhaps by an active galactic nucleus (AGN; e.g. Croton et al., 2006) or gravitational heating due to clumpy accretion (Birnboim et al., 2007; Dekel & Birnboim, 2008; Dekel et al., 2009b) could potentially prevent such cooling. This mechanism provides a physical explanation for the mass-dependence of the galaxy bimodality and the exponential cutoff in luminosity functions (Kauffmann et al., 2003c; Sobral et al., 2010).
As alternatives to virial shock heating, various types of galaxy interactions show promise for transforming galaxies. High-velocity encounters between galaxies may cause minor distortions and disk heating. Major galaxy mergers tend to transform disks to ellipticals (Toomre & Toomre, 1972; Springel et al., 2005a; Cox et al., 2006a), and the resulting shocks and intense star formation winds may expel or heat cold star-forming gas through shocks or feedback from supernovae (e.g. Cox et al., 2006b). Simulations show, however, that processes like supernova feedback are not enough to sufficiently stifle star formation (Springel et al., 2005a). As with virial shock heating, some additional energy input is required.
A popular culprit to supply the necessary energy is the supermassive black hole thought to reside at the centre of most massive galaxies (cf. Kormendy & Richstone, 1995; Richstone et al., 1998). When the black hole accretes material, the resulting AGN injects energy into its surroundings (e.g. McNamara et al., 2006), supplying the necessary heating and/or expulsion of gas. Croton et al. (2006) propose that cooling and accretion of hot halo gas triggers low-luminosity AGN at the centres of massive elliptical galaxies, visible as radio lobes. This so-called “radio mode” feedback adds enough energy to the surrounding hot halo to prevent further cooling and star formation.
In a merger-driven quenching scenario, Di Matteo et al. (2005) and Hopkins et al. (2006), among others, suggest that powerful AGN induced by galaxy mergers dump energy into the remnants of the gaseous galactic disk, effectively superheating and expelling it to prevent further star formation. This “quasar mode” feedback operates only in the aftermath of major mergers of gas-rich galaxies. An additional benefit of this high accretion rate mode, for which the phenomenon was originally investigated, is that it explains the existence of quasars and the relationships between black hole mass and bulge properties.
Observational evidence provides some support for a connection between AGN and galaxy evolution. Correlations between black hole mass and bulge properties like mass and velocity dispersion helped motivate the concept of AGN fueling and self-regulation via feedback (Magorrian et al., 1998; Ferrarese & Merritt, 2000; Gebhardt et al., 2000; Tremaine et al., 2002). Furthermore, in both the local and distant universe, AGN have been associated with a transition in galaxies from blue to red (Sánchez et al., 2004; Silverman et al., 2008; Schawinski et al., 2009) and from disk-dominated to bulge-dominated (Kauffmann et al., 2003a; Grogin et al., 2005; Gabor et al., 2009).
A handful of alternative mechanisms have recently emerged that do not invoke AGN. Dekel et al. (2009b) suggest that smooth cosmic gas accretion provokes instabilities in a galactic disk by building up its mass, whereas clumpy accretion suppresses instabilities via gravitational stirring. Clumps transfer gravitational energy to the disk, effectively heating it and suppressing star formation. Other mechanisms, such as cosmic ray heating (e.g. Mathews, 2009) and self-annhilation of dark matter particles (Totani, 2005), have not enjoyed as ample consideration in the recent literature.
1.3 Hierarchical models of red and dead galaxies
Several of these quenching mechanisms have been incorporated into semi-analytic models (SAMs) of hierarchical galaxy formation. These models start with pure N-body simulations of dark matter, then use the resulting dark matter halo population and merger history to build baryonic galaxies within them using physically-motivated prescriptions. SAMs enable great speed and flexibility to explore parameter space and compare the resulting observables to data, but the large numbers of assumptions and free parameters they employ make interpretation a challenge.
Empirically-constrained SAMs have enjoyed success at reproducing observations of massive galaxies at low redshift. The SAM of Croton et al. (2006) based on the Millenium Simulation (Springel et al., 2005b) established a red sequence through mergers and disk instabilities, but required AGN feedback to prevent additional star-forming gas from cooling onto the most massive galaxies. This model successfully reproduced luminosity functions derived from 2dFGRS (Madgwick et al., 2002). Bower et al. (2006) improved on the “Durham” SAM (Cole et al., 2000; Benson et al., 2002; Baugh et al., 2005), which forms bulges as the result of strong disk instabilities, by incorporating black hole feedback in quasistatically cooling halos. Along with matching low-redshift luminosity functions and colour distributions, the improved Durham model matches observed luminosity functions, mass functions, and the cosmic star formation rate density at redshifts (Pozzetti et al., 2003; Drory et al., 2003). Cattaneo et al. (2006) improved on the GalICS SAM (Hatton et al., 2003) by imposing a critical halo mass above which accretion onto galaxies is shut down, and showed that this shutdown yields better matches to galaxy color distributions and luminosities. Somerville et al. (2008) incorporate a “unified” model of AGN feedback into their SAM, including both a low-accretion “radio mode” and high-accretion “bright mode” following Sijacki et al. (2007). This model matches physical properties of galaxies, such as the stellar mass function, along with black hole correlations with their host bulges. Taking a more analytical approach, Hopkins et al. (2008) adopt dark matter halo mass functions from simulations, populate halos with galaxies using halo occupation distribution models, and estimate merger rates among galaxies. By assuming that major mergers convert star-forming disk galaxies into spheroidal quiescent galaxies, these models are found to match mass functions and the integrated stellar mass density of quenched galaxies.
Overall, the general scenario that has enjoyed the most success is as follows (cf. Hopkins et al., 2008; Kormendy et al., 2009): A major merger causes a transformation from a spiral to bulge-dominated system, while concurrently feeding a central black hole that shines briefly as a quasar and emits a small fraction of its accreted mass-energy back into the galaxy. This causes a rapid truncation of star formation by driving a large fraction of star-forming gas from the galaxy, forming a red and dead elliptical. After the transformation, eventually a cooling flow forms, allowing low angular momentum gas to feed the black hole. This triggers a low-luminosity AGN which deposits energy into the surrounding hot gaseous halo. This shuts off the cooling flow, which in turn shuts off the AGN, and the cycle restarts. SAMs incorporating this scenario can explain observed correlations between galaxy morphology, colour, stellar age, bulge mass, and black hole mass.
Recently, the growth of and feedback from black holes have been incorporated into hydrodynamic cosmological simulations (Sijacki et al., 2007; Di Matteo et al., 2008; Booth & Schaye, 2009). At substantial computational expense, these simulations combine with N-body dynamics the complex three-dimensional dynamics of gas inflow and outflow responsible for establishing galaxy properties. Such simulations employ parameters for subgrid physical processes associated with star formation, galactic winds, and feedback from black holes, but bypass many additional parameters for treating gas dynamics as are required in SAMs.
Simulations incorporating AGN feedback have showed early promise by reproducing properties of the black hole and AGN and galaxy populations (Sijacki et al., 2007; Colberg & Di Matteo, 2008; Croft et al., 2009; DeGraf et al., 2009; Booth & Schaye, 2009), along with the global cosmic star formation history (Schaye et al., 2009). However, the implementation of AGN feedback is quite heuristic, and some assumptions such as spherical input of AGN feedback energy seem dubious at face value. Hence like with SAMs, it is premature to regard these models as fully physical descriptions of black hole and galaxy co-evolution.
In this paper, we take an approach that might be considered as a hybrid between simulations and SAMs. We begin with galaxy star formation histories (SFHs) taken from cosmological hydrodynamic simulations, and then apply quenching recipes by post-processing the SFHs to see which recipe(s) best match observations of massive galaxies. This retains the rapid computational flexibility of SAMs by allowing us to explore parameter space without re-running expensive simulations, while still employing star formation histories of galaxies that are described by fully hydrodynamic simulations up until quenching. We compare our simulated quenched galaxies to observed colour-magnitude diagrams and luminosity functions in the local universe, focusing on the massive (and bright) galaxy population since these are well-observed, since the largest discrepancies in existing models are found there, and since it is where the bimodality is most pronounced. This approach avoids any explicit reference to the physical mechanisms of quenching, e.g. it does not explicitly account for growth and feedback from black holes, and instead focuses on asking the question: Which aspects of galaxy and halo evolution govern quenching in massive galaxies?
Our paper is organized as follows. §2 describes our base cosmological hydrodynamic simulation employed in this work. §3 details how we post-process the SFHs under various proposed quenching mechanisms. We then compare the resulting galaxy properties to data as described in §4. Our results, in §5, suggest that several quenching mechanisms can indeed qualitatively reproduce a red sequence, but they all fail to exactly match observations in sometimes subtle ways. We devote much of our discussion in §6.4 to understanding the failures of these models, with an eye toward what new aspects may be required to improve agreement. Finally, we summarize in §7.
2 Simulations
2.1 Input physics
We run simulations using a modified version of the N-body + Smoothed Particle Hydrodynamics (SPH) code GADGET-2 (Springel, 2005) described in Oppenheimer & Davé (2008). In essence, SPH is a Lagrangian implementation of hydrodynamics where particles represent fluid elements, and each particle’s density and temperature are determined by kernel averages over its nearest neighbors. GADGET-2 computes gravitational forces between particles using a tree-particle-mesh algorithm, and employs an entropy-conserving SPH formulation to compute pressures and densities of the gas. The code tracks three distinct types of particle — dark matter, gas (or SPH), and star — including positions, velocities, and masses, as well as temperatures, densities, and metallicities as appropriate.
GADGET-2 incorporates a mechanism for gas particles to spawn star particles stochastically. This mechanism, based on an analytic two-phase model of the interstellar medium with cold dense clouds embedded in a diffuse ionized gas (Springel & Hernquist, 2003), operates on scales not resolved by the simulations. The model assumes that each gas particle that is sufficiently dense to be Jeans unstable contains a hot ambient medium, cold clouds, and stars which form within the cold clouds, and the phases exchange mass, energy, and metals via condensation and supernovae energy input (McKee & Ostriker, 1977). The resulting star formation rate (SFR) in the cold clouds is calculated assuming a Schmidt (1959) law. A gas particle with a positive SFR will spawn a star particle with a mass, , with some probability determined by the SFR. Any newly spawned star particle inherits the position, velocity, and metallicity of its parent gas particle, whose mass is reduced by . We use , the initial mass of a gas particle. On average, a gas particle can spawn up to two star particles, but this varies because gas particles can acquire additional gas mass from nearby stellar evolution (see below). Springel & Hernquist (2003) have reduced this model to a single free parameter: the characteristic time-scale over which cold clouds convert into stars at the threshold density, which is set to 2.1 Gyrs in order to match the observed Kennicutt relation (Kennicutt, 1998).
Galactic outflows driven by star formation are implemented in a similarly stochastic fashion. Our model, first introduced by Springel & Hernquist (2003), ejects star-forming particles from galaxies by kicking them with a velocity . The probability for ejection is set by the mass loading factor (i.e. the mass loss rate relative to the star formation rate) times the star formation probability for that particle. The simulation used here employs our favored momentum-driven wind scalings (Murray et al., 2005) as described in Oppenheimer & Davé (2006) and Oppenheimer & Davé (2008), and motivated by observations of local winds by Martin (2005) and Rupke et al. (2005). In these scalings, is proportional, and is inversely proportional, to the galaxy circular velocity. We also decouple the winds hydrodynamically until they reach a density 0.1 times the critical density for star formation (up to a maximum duration of 20 kpc/) in order to mock up chimneys through which outflowing gas can escape but that are poorly treated by the spherically-averaging SPH algorithm. Both outflows and star formation are to be regarded as Monte Carlo prescriptions, in which individual events are not by themselves meaningful; resolution convergence tests (e.g. Finlator et al., 2006) have shown that once 64 star particles are formed within a galaxy, then its star formation history is fairly stable and well-resolved. We use this as our galaxy (stellar) mass resolution limit.
More recent improvements in Oppenheimer & Davé (2008) include a sophisticated chemical enrichment model, Type Ia supernovae, and stellar mass loss. We track carbon, oxygen, silicon, and iron individually, with yields taken from various works. Type Ia SNe rates are taken from Scannapieco & Bildsten (2005), with a prompt and delayed compenent, and these inject energy and metals (predominantly iron) into surrounding gas. We also track mass loss from AGB stars (using models of Bruzual & Charlot, 2003, ; BC03), injecting metal-enriched mass (but no energy) to the nearest three gas particles. Generally, these “delayed feedback” mechanisms become more important at later epochs, which will be less of a concern for us in this work since the quenching of star formation in massive galaxies typically occurs relatively early on.
The momentum-driven outflow scalings, together with hydrodynamic decoupling, have resulted in our simulations broadly matching a wide range of galaxy and intergalactic medium properties. These include the chemical enrichment of the IGM (Oppenheimer & Davé, 2006, 2008), the galaxy mass-metallicity relation (Davé et al., 2007; Finlator & Davé, 2008), and high- galaxy luminosity functions (Davé et al., 2006; Finlator et al., 2007). As such, while our model is not an ab initio description of galactic outflows, it appears to modulate the SFHs of star-forming galaxies in broad accord with observations. Hence our simulations provides a plausible starting point for studying the quenching of star formation across cosmic time.
2.2 Simulation parameters
The simulation we employ here begins at redshift with 5123 dark matter particles and 5123 gas particles in a cube of comoving side length Mpc with periodic boundary conditions, and is evolved to . The volume of this simulation allows us to sample large galaxies in high-density environments (with halo mass up to ), while also providing the dynamic range to resolve galaxies well fainter than the knee of the luminosity function. With a mass resolution of 1.2 per gas particle, we can resolve galaxies with stellar masses . We employ a WMAP-5 concordance cosmology (Komatsu et al., 2009) with km s-1 Mpc-1, matter density , baryon density , a cosmological constant with , root mean square mass fluctuation at separations of 8 Mpc , and a spectral index of .
2.3 Simulation outputs and analysis tools
We configure GADGET-2 to output simulation “snapshots” at 108 redshifts, starting at and ending at . The proper time between snapshots ranges from Myr at to Myr at . The snapshots contain information for each dark matter, gas, and star particle in the simulation, including position, velocity, mass, metallicity (for gas and star particles), density and temperature (for gas particles), and time of formation (for star particles). We also store auxiliary information such as star formation rates and carbon, oxygen, silicon, and iron abundances.
From this basic information we identify and extract properties of dark matter halos and galaxies. We use SKID (Spline Kernel Interpolative DENMAX; http://www-hpcc.astro.washington.edu/tools/skid.html) to identify gravitationally-bound groups of star-forming gas and star particles that comprise a galaxy. Halos are identified using a spherical overdensity (SO) algorithm. Beginning at the most bound particles within SKID-identified galaxies, halos are expanded radially until they reach the virial overdensity threshold. Smaller halos whose centres lie within the virial radius of larger ones are subsumed, while halos whose virial regions overlap but whose centres lie outside each others’ virial regions divvy up the particles according which centre is closer as scaled by their virial radii. In the end, each halo has at least one galaxy by construction, and each particle belongs to not more than one halo. From these identified galaxies and halos, we calculate quantities such as masses, star formation rates, and metallicities by summing over all member particles.
The star particles within a SKID galaxy are tagged with formation time and metallicity, and hence provide a series of single stellar populations (SSPs) from which one can construct the star formation and chemical enrichment history of each galaxy. This allows us to calculate galaxy spectra using the high-resolution grid in the stellar population synthesis models of Bruzual & Charlot (2003). We then measure photometric magnitudes by convolving the galaxy spectra with broad-band filter curves. The code optionally computes extinction due to dust in the galaxy; we explore the effects of different dust models in §5.5. Since we mainly focus on red sequence galaxies where dust extinction is negligible (e.g. Lauer et al., 2005), our dust prescription does not strongly impact our results.
3 Post-processed quenching
For each simulated galaxy we compile a star formation history to . Hence we can test models for quenching by modifying that SFH in post-processing, based on some set of prescribed rules. This approach allows us to assess to first order the feasibility of a wide range of quenching mechanisms in a short amount of time, without the additional computational costs associated with building those mechanisms directly into the simulations. To describe our quenching models in detail, we first present a general explanation of the quenching process, and then give examples of the implementation for each quenching mechanism.
Since we determine properties like galaxy stellar masses and broad-band luminosities from groups of simulated star particles, we can mimic the effects of quenching simply by removing star particles from consideration when extracting these bulk properties. Thus, at each snapshot, we examine the conditions under which each new star particle formed. If these conditions match the quenching condition, then we flag that star particle to indicate that it never should have formed. With this flag, we track the quenched star particle through all subsequent time steps. Finally, when we extract a galaxy’s stellar mass and luminosity (at any particular output time step), we ignore any star particles which have been flagged as quenched.
This method has the obvious disadvantage that any gas which forms into a quenched star particle will be locked up in that phantom star particle (i.e. a star particle that never should have formed), rather than remaining in its gaseous state to be tracked dynamically by the simulation. Furthermore, the additional feedback energy associated with quenching could have an impact on the surrounding gas that subsequently forms stars, which our post-processing technique cannot account for. Physically, one can view this material as having been heated or expelled in such a way so that it is unable to return to a cool star-forming state within a Hubble time, and also does not interact significantly with other infalling gas or galaxies. Clearly this cannot be true in detail, but this approach can still give useful first-order insights. Hence while this method has the advantage of computational flexibility and speed, a fully self-consistent quenching mechanism must be incorporated into the simulations dynamically in order to properly assess all effects; this is under development.
We study quenching mechanisms that have been recently considered in the literature. Namely, we specify conditions under which star formation should be quenched using three different models: (i) quenching induced by galaxy mergers, (ii) quenching by virial shock heating in massive dark matter halos, and (iii) quenching due to the inability of gas shocked above a critical temperature and/or expelled in a wind to cool. For each of these mechanisms, we define a quenching condition based on an event or property that we can extract from the simulations. Then we ignore star particles whose formation satisfies the quenching condition, as described above. We refer to this as quenching the star particle.
3.1 Quenching via galaxy mergers
As mentioned above, various works have suggested that feedback from intense star formation and AGN activity induced by galaxy mergers can heat and expel the cold gas from merger remnants, rapidly halting star formation. We apply this hypothesis to the simulations by quenching star formation in galaxy merger remnants. To do this, we first identify remnants of major mergers by tracing growth in galaxy stellar mass. For each galaxy in a given output time step , we identify its most massive progenitor galaxy in the most recent time step (, and these times represent the age of the universe at the corresponding time step). If the galaxy and its progenitor have stellar masses and , respectively, then a major merger occurred in the last timestep if , where is the critical mass ratio that separates major and minor mergers. We use the typical value (Dasyra et al., 2006; Woods et al., 2006; Hopkins et al., 2008) and a more extreme , and also require that the remnant be well-resolved in our simulation, with . Note that since galaxies also grow by star formation, this merging criterion can be considered conservative in the sense that the actual merger ratio is probably higher (i.e. is larger) than the assumed value.
Motivated by recent work suggesting that remnants of galaxy mergers may re-form into star-forming disks (Springel & Hernquist, 2005; Robertson et al., 2006; Governato et al., 2007, 2009; Hopkins et al., 2009), we incorporate an additional parameter, . We assume that any merger remnant with a gas fraction re-forms into a disk galaxy, and therefore is not quenched. If a galaxy meets the quenching conditions, then we set its most recent merger time, . We track for all galaxies through the evolution of the simulation. At any given time step, galaxies inherit from their most massive progenitors of the previous time step. Note that in some cases, merger remnants that are absorbed by larger galaxies can effectively lose their remnant status; this is fairly rare except at the earliest epochs.
After identifying merger remnant galaxies, we quench any star particle that forms in such a galaxy at a time Since the simulations track the time of formation for each star particle and our tools match star particles to galaxies, we can easily identify those star particles to be quenched. Our model assumes that, barring a subsequent merger with a larger galaxy, a merger remnant will never recover from whatever quenching process occurs. That is, we maximally halt all future star formation, ignoring the possibility that cold gas later accretes onto the remnant to rejuvenate star formation. A more physically accurate model might account for the initial heating of gas in the galaxy during the merger, then permit cooling as part of the subsequent evolution. Some authors (e.g. Croton et al., 2006) have proposed that heating due to an intermittent AGN prevents later cooling and star formation; we implicitly assume that such a process operates to keeps merger remnants quenched.
3.2 Halo Mass Quenching
Some authors (Birnboim et al., 2007; Dekel & Birnboim, 2008; Dekel et al., 2009b) have proposed that hot gas in massive dark matter halos can halt the accretion of gas onto galaxies, cutting off the fuel for star formation. As gas falls toward the centre of the dark matter potential well, gravitational energy converts to thermal energy, heating the gas to temperatures near the virial temperature. In halos with masses , rapid cooling prevent the virial shock from being supported, but in halos above that mass a stable hot gas envelope can form (Birnboim & Dekel, 2003; Kereš et al., 2005, 2009b). The virial shock rapidly heats any further infalling gas, stifling accretion of cold gas onto galaxies and thus quenching star formation. This mechanism effectively quenches star formation in dark matter halos with , where .
The X-ray emission from intracluster gas around massive galaxies indicate that the gas is cooling at rates of tens or hundreds of per year. However, young stars and reservoirs of cool gas where the cooling flow might be deposited have not been observed (the cooling flow problem; see Peterson & Fabian, 2006, for review), suggesting that an additional long-term heating mechanism acts near the halo centre. Low-luminosity AGN could in principle provide this heating (Croton et al., 2006), but the details of the heating process are poorly understood. Some works suggest that AGN jets generate pressure waves or magnetic fields within intracluster gas to isotropize energy input (e.g. Ruszkowski et al., 2004a, b; Brüggen et al., 2005), though it is not clear that such processes can operate in more typical-sized halos.
Birnboim et al. (2007) suggest a scenario in which dark matter halos that reach abruptly form a rapidly expanding shock, heating the supply of infalling gas and quenching star formation for Gyrs. Eventually the shock slows, the halo stabilizes, and of gas quickly cools and initiates a starburst, followed by a long-term quiescence. This can quench star formation in galaxies residing in groups, but galaxies in massive clusters require additional heating from AGN or clumpy accretion to prevent recurrent star formation.
In this paper, we explicitly avoid reference to any particular physics of halo quenching, but are rather interested in generally testing whether quenching based on some halo mass threshold can match observations of passive galaxies. We therefore adopt a simple approach in which no stars can form in halos above . To model this process in the simulations, we first identify all dark matter halos with in a given output time step. Then we quench any star particle which formed in one of those halos within the most recent time step. Again, since the simulations and analysis tools track the time of formation and corresponding dark matter halo of each star particle, we can straightforwardly identify star particles to be quenched. We treat as a free parameter when comparing with observations, testing plausible values in the range .
This procedure implicitly quenches star formation in all galaxies in the dark matter halo, including both dominant (or central) and satellite galaxies. Therefore, when a small galaxy falls into a massive halo, we immediately truncate its star formation rather than allowing a slow decline like that expected for “strangulation” (e.g. Simha et al., 2009). Although the abruptness of this truncation does not reflect realistic galaxy infall to clusters (Balogh et al., 2000), we are primarily interested in the population of massive central galaxies that dominate the bright end of the red sequence today. We discuss variants of this mechanism, including quenching only central galaxies, in §5.4.
3.3 Quenching of hot mode and wind mode

Galaxies in simulations show two main paths in density-temperature space for acquiring gas to fuel star formation (Binney, 1977; Birnboim & Dekel, 2003; Kereš et al., 2005): Hot mode, in which gas heats to near the virial temperature of the halo before cooling to form stars; and cold mode, in which gas never gets significantly above K and radiates most of its gravitational potential energy in Lyman alpha emission (Fardal et al., 2001; Yang et al., 2006). Recently, Oppenheimer et al. (2009b) introduced recycled wind accretion, or “wind mode”, as a third accretion path. Wind mode constitutes gas that was previously ejected from a galaxy, and has been re-accreted to form stars, and in our simulations with plausible outflows models it dominates the cosmic accretion budget, particularly in massive galaxies, at .
In either the hot mode or wind mode cases, it is conceivable that the gas should never re-accrete. This could be owing to some heat source that keeps hot halos energized, as hypothesized in Kereš et al. (2005) and Dekel & Birnboim (2006), or else it could be because there are numerical difficulties in handling two-phase media and cold clumps in SPH (Agertz et al., 2007) by which accretion is over-estimated. Indeed, Kereš et al. (2009b) found that the amount of hot mode accretion in entropy-conserving SPH is far less than in previous version of SPH, highlighting the numerical uncertainties involved. Oppenheimer et al. (2009b) also speculates that wind mode should never re-accrete, again owing to numerical issues of cold clumps moving through hot halo gas. It is conceivable that, since hot mode and wind mode are preferentially more important in larger systems, that simply removing such accretion modes could yield a bimodality with a clear red sequence.
Our simulations track a parameter corresponding to the highest temperature achieved by that particle in its history before entering a galaxy. The simulations stop updating for gas particles ejected from galaxies via winds, even if they are heated above the previous maximum value. When a gas particle stochastically spawns a star particle, the star particle inherits its parent’s at the time of spawning, retaining it for the remainder of the simulation. We thus track the maximum temperature achieved by the gas which formed any given star particle. To quench hot mode, we simply assume that any gas particle heated above some critical temperature, , can never cool to form stars. For this mechanism, we simply identify and quench any star particles with .
Figure 1 shows the distribution of for all star particles in galaxies in three different stellar mass bins: . Each distribution shows two distinct peaks (at 4.4 and 4.9) and a tail to higher temperatures. The low-temperature peak is from gas that has never been substantially heated, and the high-temperature peak comes from warmer gas that then cools to form stars. The peaks are associated with hydrogen cooling and helium cooling, respectively (cf. Sutherland & Dopita, 1993). Mild shocks during accretion likely heat the warm component, while the colder component somehow avoids such shocks. Somewhat counter-intuitively, Kereš et al. (2009b) found that both low and high mass galaxies form predominantly through cold mode, and that intermediate mass systems () have the highest hot mode fraction. In the high mass case, it is because large galaxies assemble from lower-mass galaxies that formed early on mainly via cold mode accretion. Based on this plot, we explore critical values of (shown as vertical dashed lines), though it turns out that the results are not very sensitive to this choice.
Since most of the high-temperature gas is heated via virial shocks, one might expect these results to mimic those of the virial shock heating prescription in §3.2. In many halos, however, cold flows of gas from the IGM (particularly at early epochs) can penetrate the hot envelope to feed the central galaxy directly, so the quenching is not complete (Kereš et al., 2005, 2009b). Our results in §5.3 indeed suggest that cold flows are a significant factor in ongoing star formation in massive galaxies.
Quenching wind mode is also straightforward, since we track which gas particles have been ejected in a wind, and this information is passed on to spawned star particles (see Oppenheimer et al., 2009b, for implementation details). Certainly, it is the case that at least some material that participated in an outflow (particularly at early epochs when outflows were most prominent) is likely to have fallen back into a galaxy at late times. Here, we make the most extreme assumption that none of it ever falls back.
4 Observational Constraints
The ultimate goal of this study (and others like it) is to build a model for galaxy evolution that matches observed global distributions of galaxy properties. Accordingly, we compare the results of our simulations to well-studied quantities of the low-redshift () galaxy population, primarily based on measured luminosities. We focus on colour-magnitude diagrams (CMDs) and luminosity functions (LFs). Of course, a litany of other observations could provide additional detailed constraints, such as luminosity- and colour-dependent correlation functions (Zehavi et al., 2005; Weinmann et al., 2006; Cooper et al., 2006; Phleps et al., 2006; Cooper et al., 2007; Coil et al., 2008; Brown et al., 2008; Williams et al., 2009; Cooper et al., 2009), properties of post-starburst galaxies (Zabludoff et al., 1996; Quintero et al., 2004; Blake et al., 2004; Balogh et al., 2005; Yang et al., 2008; Wild et al., 2009), the total star formation history of the universe (e.g. Hopkins & Beacom, 2006; Thompson et al., 2001, 2006), the star formation intensity distribution of galaxies (Thompson, 2002), and other observations of galaxy properties at higher redshifts. Given the challenges that even low-redshift CMDs and LFs present to our models, we defer more detailed comparisons to future work.
We use the Value-Added Galaxy Catalog (VAGC; Blanton et al., 2005b) of the Sloan Digital Sky Survey (Adelman-McCarthy et al., 2008; Padmanabhan et al., 2008) for comparison to our simulations. The DR6 version of the VAGC includes k-corrected absolute magnitudes in the SDSS ugriz + JHK bands for more than 2.6 million galaxies, including a special low-redshift sample of 170,000 galaxies with distances of 10 Mpc to 150 Mpc (redshifts roughly 0.003 to 0.05). Because the low-redshift sample’s volume is roughly comparable to (though larger than) the volume of our simulations, we use it (rather than the full VAGC) to provide observational constraints on our models. We convert the reported absolute magnitudes (which use ) to our preferred cosmology (with ) with . Colours are then straightforward, and we compute luminosity functions using the method (Schmidt, 1968) and the values presented in the VAGC.
Because it effectively traces stellar mass, we plot -band absolute magnitudes in most of our plots, and we use colours for CMDs. We compare observations with results from our simulation snapshots at , chosen to fall in the middle of the observed low-redshift VAGC range, though the simulation results are insignificantly different at . We refer to redshift 0.025 as , or “low-redshift,” throughout the remainder of the paper.
Stellar masses for galaxies in SDSS (including those in VAGC) were determined by Kauffmann et al. (2003b), using template fits to spectra including the effects of dust extinction. We cross-correlate these publicly available data with the VAGC catalog to obtain stellar masses for our comparison galaxy sample.
5 Results

To begin, we illustrate the current state of galaxy formation in cosmological hydrodynamics simulations without quenching in Figure 2. This shows CMDs (top) and LFs (bottom) for our simulations compared with observations from SDSS. We separate blue galaxies from red using a solid line drawn in the CMD, and we show a best-fit to the SDSS red sequence as a dot-dashed line (see below). Our mass resolution produces a diagonal envelope in the bottom right of the CMD panel, corresponding roughly to . This cutoff affects the blue galaxy LF fainter than , although the red galaxy LF is not impacted within our plotting range, brighter than . We follow Finlator et al. (2006) to estimate LF uncertainties for our simulation using the jackknife method (Lupton, 1993; Zehavi et al., 2002; Weinberg et al., 2004). We sample the volume of our simulation eight times, each time excluding one octant of the simulation and calculating the LF for the remaining of the total volume. The variance in the LF of the eight sub-samples provides an estimate of the uncertainties due to poisson noise and cosmic variance. Luminosity functions of the SDSS galaxies have typical uncertainties at the 0.1 dex level (Blanton et al., 2005a), smaller than the symbols we use in the plot.
This simulation fails to produce massive red and dead galaxies as observed. Almost all galaxies occupying the red sequence regime are low-mass satellites that have been quenched primarily via strangulation (see e.g. Simha et al., 2009), with just a few massive systems that are a red extension of the blue cloud, without evidence for a distinct bimodality.
We reiterate that this simulation includes strong galactic outflows from star-forming galaxies. Clearly, even such fairly energetic feedback is insufficient to quench star formation in massive galaxies. Galaxies almost always have supplies of gas to fuel new star formation, Galaxies accrete cold gas from the IGM through filaments of the cosmic web (cf. Kereš et al., 2009b), and hot gas in galactic halos may cool onto the central galaxies. In our simulations, much of the accreting gas today is recycled from earlier galactic winds expelled from the galaxy (Oppenheimer et al., 2009b). This illustrates that some other physical process must quench star formation in massive galaxies.
When calculating galaxy magnitudes, we neglect the effects of dust to highlight the intrinsic red sequence, i.e. the red sequence made up solely of galaxies with old stellar populations. Red galaxies without ongoing star formation contain little enough dust that we can neglect dust effects on colours for the intrinsic red sequence. Although dust tends to redden star-forming galaxies from the blue cloud, observations suggest only –20% of the red sequence comes from such galaxies (Bell et al., 2004a; Brammer et al., 2009). In §5.5 we will explore dust effects on the population of star-forming blue cloud galaxies.
In the following three sections, we present CMDs and LFs for merger-based quenching, halo mass quenching based on a critical halo mass, and accretion mode quenching. We focus on the intrinsic red sequence successfully generated in the first two models, exploring some properties of the red galaxy populations formed. Because of its sensitivity to dust, we defer discussion of the blue cloud to §5.5.
5.1 Merger quenching


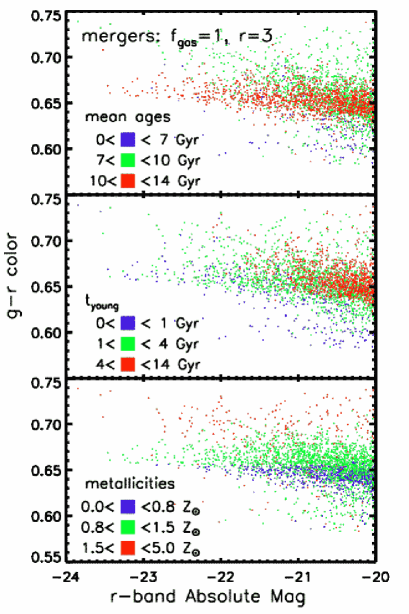
Figure 3 shows the results of our merger quenching prescription with a mass ratio of 3:1 () with (top two panels) and with (third panel). CMDs in all cases exhibit a distinct red sequence with a shallow but nonzero slope, and a tail of bright red galaxies, qualitatively in agreement with observations. However, the LF for the case shows a significant excess of very bright red galaxies, which is only partly mitigated in the case. Note that these are quite high gas fractions: Disk galaxies like the Milky Way today have gas fractions well below 0.6, and even at high- one has to go to to get typical gas fractions as high as 50% (Erb et al., 2006). Our results prefer never re-forming a star-forming disk once a major merger happens. Since hydrodynamic simulations without AGN clearly show that a disk re-forms even with more modest gas fractions (e.g. Robertson et al., 2006; Governato et al., 2009), this implies that for this quenching mechanism to work, something must heat or eject all the gas such that it not only stops forming stars at that time, but prevents the re-formation of a gaseous disk.
In the third panel we make the model even more extreme by quenching star formation after all 1:4 mergers, regardless of gas content. This has only a minor impact on the resulting CMD (relative the 1:3 case). It decreases the number of very bright galaxies, which mitigates the discrepancy there, at the expense of worsening the agreement for moderately bright galaxies.
The LF shows a related problem that all merger models fail to produce a sufficiently sharp knee at a characteristic magnitude as seen in the data. The model can reasonably match the number of galaxies at the low-luminosity end, but it over-produces bright galaxies and underproduces galaxies at . This is a fairly generic problem in this scenario, present even in our most extreme case, arising because mergers occur at a wide range of masses and only weakly pick out a characteristic scale around .
Merger quenching (along with all our quenching models) exhibits what we call the “blueness problem”: the red sequence is too blue by 0.1 magnitudes in colour. This corresponds to error in the flux ratio between the two bands. We explore several possible explanations for this problem in §6.2, which likely has an origin in the overall calibration of galaxy metallicities. Since it occurs in all quenching models, we cannot use this blueness problem to constrain quenching mechanisms.
To more quantitatively compare the slope, scatter, and average colour, we perform linear fits to the simulated and real red sequences. We first separate the red sequence from the blue cloud using a constant colour, 0.65 for real galaxies and 0.55 for simulated ones. Various reasonable choices of this separator, including those with nonzero slope chosen simply by eye, yield similar results. After dividing the absolute magnitudes into bins of width 0.5, we calculate the mean, median, and standard deviation of colour within each bin for galaxies above our separator. We fit the median points to a straight line, as shown in the top panel of Figure 4 for SDSS galaxies and our 3:1, merger model. Along with highlighting the blueness problem, the figure shows that the simulated red sequence slope is somewhat too shallow, at least in this quenching model. Note (in Figure 3) that the model with lower produces a steeper slope, and a smaller blueness problem, albeit failing more spectacularly in the LF comparison.
In the lower panel of Figure 4, we plot the scatter as a function of absolute magnitude. The observed scatter is magnitudes, but part of that is observational uncertainties. Cool et al. (2006) estimated that the intrinsic scatter in is 0.035 mag, at least for the most luminous () galaxies. This is still larger than the scatter in our simulations, which is good because our quenching prescription makes the maximal assumption of zero star formation since the time of quenching. Early-type galaxies today do appear to have a small “frosting” of star formation (Trager et al., 2000; Yi et al., 2005), which would tend to increase the scatter. However, the simulated scatter is not significantly smaller than observed, so there is scant little room for additional scatter from frosting.
Figure 5 explores the red sequence produced in the 3:1, merger quenching model in greater detail. We select this as our preferred merger quenching model since it yields the least deviations from the observed red galaxy LF. The top panel shows the -band luminosity-weighted mean stellar age; the middle panel shows the simulated galaxies in colour-coded bins of , the age of the youngest star particle in the galaxy; and the bottom panel shows the -band luminosity-weighted mean stellar metallicity. The metallicities shown are absolute mass fractions of elements heavier than helium, where solar metallicity is 0.012 (Asplund et al., 2005).
At the brightest end, the galaxies have old stellar populations on average. Less massive galaxies show a wider spread in age, and perhaps counter-intuitively, the intermediate-age galaxies are redder than the oldest galaxies. There are some small (i.e. ) galaxies that are fairly young, having just been quenched onto the red sequence. The middle panel shows that even the brightest galaxies generally have some quite young stars ( Gyr old). This is because they live in the largest halos that are still assembling at the present day, and hence they recently subsumed galaxies that were recently forming stars (i.e. unquenched galaxies); we discuss this further in §6. In metallicity, the red sequence shows a gradient where the reddest galaxies are the most metal rich, and this occurs at all luminosities. This reflects the well-known fact from population synthesis models that metallicity is the primary determinant of colour in old stellar populations. Here we can see why intermediate age systems are redder than the oldest systems: They generally have higher metallicities, having formed stars up until a later cosmic epoch.
5.2 Halo mass quenching


Figure 6 shows CMDs and LFs for halo mass quenching, analagous to Figure 3 for mergers. We show results for three values of the critical cutoff mass, = and . As with mergers we obtain a distinct red sequence in qualitative agreement with data. The slope is slightly shallower than in the merger case, essentially zero, as shown in Figure 4, and the scatter around the red sequence drops to nearly zero for the brightest galaxies, in contrast to merger quenching where the scatter is independent of luminosity. The blueness problem is present at roughly the same level as in merger quenching.
In halo mass quenching, most red galaxies tend to clump in a relatively small range of absolute magnitude. For =12.5 this clumping occurs around (and stellar mass 10), and scales with halo mass for the other cases. Variations in star formation and merging histories smear out this clumping somewhat, but this general feature remains; no such feature is seen in the data. The bright end of the red sequence grows large through dry mergers after the quenching process, and faint galaxies are mostly satellites. The dark matter halos of central galaxies tend to achieve the critical mass when the galaxies have a particular stellar mass, and then move from the blue cloud to the red sequence. Thus, at all epochs, galaxies tend to move onto the red sequence at an effective critical stellar mass or absolute magnitude that corresponds to the critical halo mass. Variations in the time of quenching and metallicities then cause significant vertical scatter in colour for these clump galaxies. At a fixed stellar mass, galaxies early in the universe (high redshift) have lower metallicities than those later on (low redshift) (Erb et al., 2006; Maiolino et al., 2008), so galaxies that move onto the red sequence later have higher metallicities.
The LF is quite sensitive to : fits the luminosity functions best, with the other cases far underpredicting or overpredicting the number of bright galaxies. The CMD clump is evident in the LF as well. Even in the generally best-fitting case there is a tail of bright galaxies that leads to an excess in the luminosity function at , just as in merger quenching. Overall, the luminosity function produces a slightly steeper drop-off than the merger quenching models, although a characteristic knee is still less pronounced than in the data.
Figure 7 shows the red sequence in more detail for the best-fitting case, with galaxies colour-coded by mean stellar age, , and mean stellar metallicity (from top to bottom). Like in merger quenching (cf. Figure 5), we find that the most massive galaxies have old stellar populations. Unlike in merger quenching, these old massive galaxies do not contain any young stars. Each of these galaxies, lying at the centre of a cluster, tends to merge only with smaller galaxies that have already been quenched a while ago because they live in the same dark matter halo above the critical halo mass. Thus, when the central galaxies grow through accretion of satellites, they do not obtain any stars younger than 1 Gyr.
The metallicity panel shows that the highest metallicity systems are generally the smallest (and reddest) systems. The large, old systems typically have fairly low metallicities. Qualitatively, this explains why the red sequence slope is basically zero; the age and metallicity gradients cancel each other. The tight correlation between luminosity and metallicity directly translates into a scatter in the red sequence that goes from nearly zero at the brightest end to fairly large at the faint end, as seen in Figure 4.
5.3 Accretion mode quenching

Figure 8 shows results of (i.e. hot mode) and wind mode quenching. The top two panels show CMDs for two different threshold temperatures, K and K. These are chosen as the bimodality separation in in our simulations and the (no wind, no metal cooling) simulations of Kereš et al. (2009b), respectively. The third panel shows the extreme case of quenching both hot mode with a K threshold, and quenching all wind mode as well.
Quenching hot mode alone does not produce a red sequence; it is not bimodal, and the number densities of red galaxies are far too small at all but the largest masses. This is because cold mode, either pristine or in the form of recycled winds, continues to provide significant accretion at late times. Hence the idea that simply keeping gas hot in a hot halo reproduces a red sequence does not appear to be viable, since it takes only a fairly small amount of ongoing star formation to make a galaxy blue.
Quenching both hot and wind mode produces something that looks like a red sequence, with an amplitude, slope, and scatter that is (coincidentally) comparable to the merger quenching case. However, the red galaxy LF continues to have the wrong shape; it is roughly just a constant factor higher than in the hot mode-only quenching case. Oppenheimer et al. (2009b) anticipate this failure of wind-mode quenching, finding that allowing wind mode accretion leads to the best-matching stellar mass functions below the turnover mass . Kereš et al. (2009b) highlighted a numerical problem in GADGET-2 in which cold clumps form owing to thermal instabilities that then rain down ballistically onto the central galaxy; the trouble is that the clumps always occur near the resolution limit, even as the resolution varies substantially. Hence this cold drizzle may be a numerical artifact, although Kereš & Hernquist (2009) used very high-resolution simulations to show that at least some of it is likely to be real.
Accretion mode quenching appears to be the least promising of our various quenching mechanisms, so we do not elaborate on these results any further. In the discussion we examine some implications of its failure (§6.4).
5.4 Variants on quenching models

After considering our basic models with few free parameters, we attempted several variations on our quenching models to try to improve agreement with observations. In the end there were no obvious successes, though the results illustrate some interesting trends.
As discussed above, halo mass quenching leads to characteristic clumping in the red sequence not observed in nature. This clumping arises from the sharp critical dark matter halo mass cutoff. While observational uncertainties could smear out the clumping, we investigate two more physically-motivated reasons why the critical mass cutoff might not be so sharp.
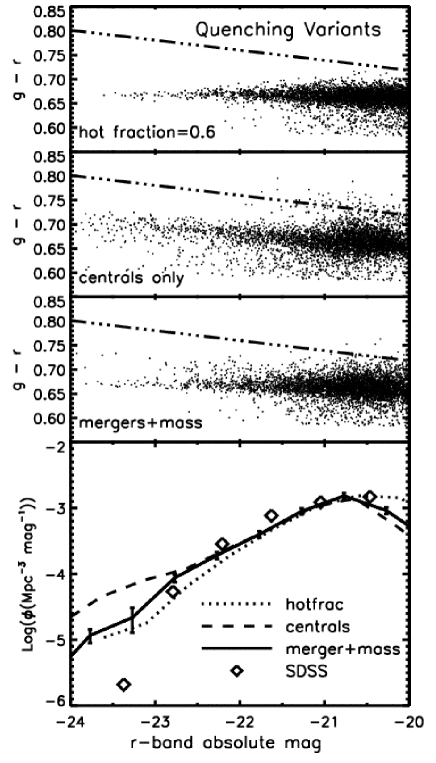
Physically, the halo mass threshold is representative of the mass scale above which a stable hot halo forms. Preventative feedback mechanisms can operate more effectively in the presence of a hot halo (Kereš et al., 2005; Dekel & Birnboim, 2006). However, there is non-trivial scatter between halo mass and hot gas fraction (e.g. see Kereš et al., 2009b). Hence we tried a model variant in which we quench galaxies in halos with a hot gas fraction above a critical fraction. We attempted models with critical fractions 0.2, 0.4, 0.6, and 0.8, which correspond roughly to halo masses – but with a scatter of 0.2–0.3 dex. The results are shown in Figure 9 (with the CMD in the top panel), for a critical hot gas fraction of 0.6. This variant smooths out the characteristic absolute magnitude or stellar mass at which blue galaxies move to the red sequence, yielding a less clumped red sequence. However, the slope and scatter (and trends with luminosity) remain essentially unchanged. Also, the LF still shows the excess of very bright galaxies as noted in the halo mass quenching case. Hence besides the aesthetic appeal of removing the clump in the CMD, it does not fare any better (or worse) than halo mass quenching.
As another variant, we examined a scenario in which we quench only in central galaxies of halos, not satellite galaxies. This is shown in Figure 9 (second panel) for a critical mass of . The CMD in this model shows greater scatter in the red sequence and a much flatter luminosity function slope than our preferred model where satellites are quenched as well. Galaxies are able to build up more mass before ending up on the red sequence, and massive central galaxies end up merging with more massive satellites than in the preferred model. This failure is disappointing, as most scenarios of halo mass quenching only quench the central galaxy, and observations favor a more gradual quenching of satellites (e.g. Weinmann et al., 2009). Indeed, SAMs that quench satellite galaxies in halos have difficulties reproducing the colour distributions of satellites (Weinmann et al., 2006; Baldry et al., 2006), which is a drawback that is shared by our original halo mass quenching scenario. We do note that the red sequence slope seems to be in better agreement with data, as larger galaxies acquire larger (unquenched) satellites that are more metal-rich.
We also investigated a hybrid model that requires both a major merger and a critical halo mass for quenching. That is, we quench only if a major merger occurs inside a halo with mass (here we assume ). Physically, this model mimics the action of a hot halo to prevent post-merger gas accretion from the IGM, perhaps by continued energy injection from an AGN. In our original quenching model, such post-merger accretion is always prevented, but here we only prevent accretion in larger halos that can support a virial shock. This model is perhaps closest to what is envisioned in current ideas for quasar plus radio mode quenching, in which a merger initially transforms the galaxy into an elliptical and quenches star formation, but only when the resulting halo is sufficiently large to form a virial shock does the resulting halo gas stay hot e.g. via low-level AGN activity.
Figure 9, third panel, shows the results of this model. The results are fairly similar to halo mass quenching, showing that it is this aspect that is the limiting factor for quenching; mergers are frequent enough that it does not add a stringent criterion. The red sequence shows slightly more scatter than in halo mass quenching, and there is no evidence for clustering at a particular -band magnitude; the slope is still incorrect, and (as always) the blueness problem persists. The LF is also similar to the halo mass quenching case, with an excess of very bright galaxies and a possible dearth of systems. This model may, in fact, be the best-fitting model as well as the most physically-motivated, but the results are qualitatively very similar to those of our simpler models.
Finally, we consider three variants of halo mass quenching where the critical halo mass varies with redshift. The first is motivated by Dekel & Birnboim (2008), who argue that the critical halo mass for quenching owing to gravitational clump heating varies slightly with redshift due to the evolving cosmic density of gas (see their Figure 3). In this scenario, the quenching mass varies from at to at . For we use the lower value, . Figure 10, top panel, shows the results. The shape of the LF is affected most strongly, as there is now a significant dearth of red galaxies fainter than . The high at late times makes the fainter end of the red sequence similar to the fixed case, i.e., it does not populate the red sequence enough. We do note that it produces a larger red sequence slope that is in better agreement with data, although the scatter is larger. Overall, this model does not fare as well as our favored halo mass quenching model with a constant , although it does illustrate that varying the quenching mass with epoch can produce notable changes in the red sequence (at the aesthetic expense of introducing more parameters).
In another paper, Dekel et al. (2009a) argue that evolves with redshift in the opposite sense, namely that out to , but at higher redshifts it increases rapidly owing to the ability of cold streams to penetrate through hot halos at early epochs (see their Figure 5, and also Dekel & Birnboim 2006). From an eyeball estimate of their conjectured hot halo mass limit in the presence of cold streams, we take for , and for . We also show a variation from Ocvirk et al. (2008) where gas in cosmic filaments in a hydrodynamic simulation is found to have a lower metallicity than Dekel & Birnboim (2006) assume. In this formulation, for , and for . The lower panels of Figure 10 show the results in these cases: A red sequence is produced, but the CMDs have a very small colour scatter, and more dramatically the LFs are power laws! The LFs of the two parametrizations differ primarily in their normalization. These models exacerbate the problem of producing a knee in the LF over constant- models.
None of these quenching model variants stands out as obviously superior to the others. Since the simple models perform as well as the variants, and because they involve simpler prescriptions, we use merger quenching with and and halo mass quenching with as our preferred models. For the remainder of the paper, we focus on these two models.
5.5 The Blue Cloud


So far we have focused on the red sequence. Our merger and halo mass quenching models also produce a star-forming blue cloud of galaxies that is separated from the red sequence, as shown in the left panels of Figures 11 and 12. Here we examine the properties of the blue cloud in these scenarios.
Computing the observed luminosities of blue cloud galaxies is complicated by uncertainties in dust extinction. Our simulation tracks metallicity, which is correlated with dust extinction. There are also empirical correlations between UV or blue-band luminosity and extinction. Since in general the bright blue galaxies are quite metal-rich, the exact form and nature of the assumed extinction makes a significant difference in their resulting brightness and colours. We only apply an extinction correction to blue galaxies, leaving quenched galaxies unaffected. Also, we employ Calzetti et al. (2000) reddening law where the optical depth due to dust varies as wavelength .
We first tried employing a correlation between metallicity and extinction from SDSS, including scatter, as described in Finlator et al. (2006). However, we found that the resulting blue cloud had a very large scatter, and a substantial number of previously blue galaxies ended up redder than the red sequence. It is possible that second parameter correlations exist in metallicity versus extinction that are not accounted for, but we did not explore this further.
Our preferred method, i.e. one that produced a blue cloud similar to observed, uses an empirical correlation between UV luminosity and dust extinction given by Wang & Heckman (1996), also described in Finlator et al. (2006). This prescription moves bright blue galaxies more than dimmer ones, so that the bluest galaxies are not necessarily the brightest ones. The resulting overall shape of the blue sequence matches the observed SDSS blue sequence reasonably well.
Figure 11 compares CMDs and LFs for our merger quenching model with and without dust. Without dust, the brightest blue galaxies in the universe would have -band luminosities brighter than the brightest red galaxies, and they would be magnitudes bluer than the red sequence in . With dust applied, the brightest star-forming galaxies are scattered into the red sequence, making up 6% of red sequence galaxies; this is reasonably consistent with observational estimates (cf. Bell et al., 2004a; Brammer et al., 2009). Furthermore, the dust obscuration ensures that massive blue galaxies are not brighter than the red sequence. The luminosity functions reflect this difference markedly. In the no-dust case, blue galaxies dominate over the bright end of the red sequence, but the presence of dust shifts the bright blue objects to lower luminosities.
Figure 12 compares the dust and no-dust cases for halo mass quenching. Even the no-dust case lacks bright blue galaxies like those seen in the merger model and in observations, and once dust is included the problem becomes significantly more severe. As discussed in §5.2, once galaxies attain a stellar mass corresponding to the critical halo mass, they move out of the blue cloud and onto the red sequence. Application of the dust prescription pushes blue cloud galaxies up and right in the figure, creating a diagonal envelope. Since dust tends to move the brightest galaxies the most, the dearth of blue galaxies intrinsically brighter than leads to fewer intrinsically blue interlopers on the red sequence (%).
As an aside, we note an interesting study by Maller et al. (2009) of galaxy orientation in relation to dust obscuration, and its impact on derived galaxy properties. Notably, they find that structural parameters like axis ratio and Sérsic index significantly impact measured colours and magnitudes, and they find an average of 0.2-0.3 magnitudes of extinction in the SDSS and bands. This study predicts considerably more bright blue galaxies than are generally inferred from studies that do not take into account orientation-dependent effects. We do not account for such effects in our work, as we use a simple dust screen model to account for obscuration.
While such comparisons are illustrative, the sensitivity to the exact extinction prescription used makes robust interpretation of the discrepancies difficult. As an alternative approach, we can perform the comparison versus stellar mass functions rather than luminosity functions. The stellar masses derived by Kauffmann et al. (2003c) implicitly account for dust extinction on a galaxy-by-galaxy basis, albeit with some assumptions about the reddening law. Baldry et al. (2008) show that these masses, determined by comparing star formation history templates based on the BC03 models to absorption features in the galaxy spectra, yield similar mass functions to other mass derivations using photometry, different population synthesis models, or different spectral features.

In Figure 13 we show stellar mass functions (the number of galaxies per Mpc3 per logarithmic stellar mass bin), separated into red and blue galaxies, for merger quenching, halo mass quenching, and SDSS galaxies. When dividing our simulated galaxy sample into red and blue, we do not use our dust prescription, so that Figure 13 shows the mass functions for intrinsically blue and red galaxies. Given the small level of contamination of actively star-forming galaxies on the red sequence, this choice does not significantly impact the results.
In our models, the red galaxy mass functions behave similarly to the luminosity functions, as expected since for these galaxies -band absolute magnitude is a good tracer of stellar mass. The red mass functions do not have a sharp knee, and the slope for halo mass quenching is slightly steeper than that for merger quenching. In fact, above (the characteristic stellar mass in a Schechter function fit, ), the red galaxy mass functions in the two models are remarkably similar.
The blue galaxy mass functions reveal a crucial difference between our halo mass and merger quenching models. Halo mass quenching produces a precipitous drop in the blue mass function above , a critical stellar mass corresponding to the critical halo mass . Mergers, in contrast, yield a blue stellar mass function whose shape traces that of the red stellar mass function (but with slightly lower normalization) for massive galaxies. The merger scenario markedly better reproduces the observed blue galaxy mass function. At there are fewer blue galaxies, but not zero blue galaxies.
The overall conclusion from the stellar mass function comparison is the same as obtained from the luminosity function comparison: the merger quenching model produces red and blue stellar mass functions that broadly agree with data, but the halo mass quenching produces a sharp truncation in the large blue galaxy population that is in disagreement with data. We emphasize that this truncation persists even in our variant quenching models which smear out the clumping associated with a halo mass cutoff (the hot fraction variant). This generic result is difficult to avoid given a relatively tight correlation between halo mass and stellar mass seen in the simulations. Unless this correlation has much greater scatter in nature than in our models, a simple halo mass quenching model will have difficulty matching these data.
Of course, the strict halo mass cutoff we adopt here represents an oversimplification. Even when we tie quenching to the physically more relevant fraction of hot gas, we truncate star formation instantaneously and forever. Real galaxies are unlikely to behave this way. After a stable hot gas halo has formed and quenched the fuel supply, star formation may continue with an existing cold gas reservoir. Furthermore, passive galaxies may undergo mergers with gas-rich satellites, momentarily reinvigorating star formation and adding young, blue stars.
Introducing a gigayear delay for the onset of quenching after a halo reaches the mass threshold, we still find no blue galaxies above (while allowing more red galaxies to grow stellar masses above ). Such a time delay may not be much more realistic than our base model, but simulated galaxies around typically have gas fractions well below 0.5, so that they cannot grow by the required factors using just their existing reservoirs of cold gas. This suggests that the steep cutoff in the blue galaxy mass function is robust. For pure halo mass quenching to be viable, we require a mechanism that chokes off the fuel supply of most of the massive galaxies in hot haloes, but not all. A more detailed treatment of massive, star-forming galaxies awaits fully hydrodynamic simulations that incorporate quenching mechanisms.
6 Discussion
6.1 Origins of the red sequence


Observations now suggest red and dead galaxies have existed since at least (Kriek et al., 2008; Williams et al., 2009; Brammer et al., 2009), and the formation time for their stellar populations is quite old. When does the quenching take place in our models?
Figure 14 shows the lookback time at which initial quenching occurred for each of the quenched galaxies in our two preferred quenching models. For the brightest red galaxies, quenching occurred at 3 in both models. In halo mass quenching, essentially zero galaxies brighter than were quenched after , whereas in merger quenching a small number of bright galaxies came to the red sequence at late times. In halo mass quenching, red galaxies can only achieve the highest masses via mergers after moving to the red sequence because the effective critical stellar mass () is much smaller than the biggest galaxies. In merger quenching, on the other hand, blue galaxies can attain quite high stellar masses and then move onto the red sequence as an already-bright galaxy at late times.
Along the -axis we show vertical histograms in , indicating the quenching rate in terms of the number of newly quenched galaxies as a function of cosmic time. The merger quenching rate peaks at , whereas a halo mass threshold quenches at a roughly constant rate over time. Here we caution that the peak in the merger quenching rate is sensitive to our minimum mass for merger quenching, which is set by the simulation resolution. A higher resolution simulation would likely move the peak to higher redshift, since small galaxies could quench earlier. In any case, the peak will remain as a distinguishing feature between merger and halo mass quenching.
For a deeper physical understanding of our model galaxies, we turn to Figure 15, where we plot -band stellar mass-to-light ratios, (the age of the youngest star particle), mean stellar age, and mean stellar metallicity vs. stellar mass for our galaxies in our two preferred quenching models. We estimate mass-to-light ratios in solar units by dividing stellar mass by , which is given by . Here is the galaxy’s -band absolute magnitude, for AB magnitudes (Oke, 1974), and is the approximate frequency width of the SDSS -band filter. We take and angstroms for the -band. In both quenching models, we find a mass-to-light ratio that increases slowly with stellar mass, and is fairly tight above where most galaxies have been quenched for some time. Halo mass quenching displays a clump of M/L just below the quenching (stellar) mass, since these galaxies have recently undergone quenching.
In the second row, we highlight a distinction in the age of the youngest stars between the merger quenching and halo mass quenching models. Massive galaxies in the halo mass quenching model lack any population of young stars: all the galaxies they accrete have old stellar populations, since even satellites that will be accreted later are quenched in massive halos at an early time. Galaxies quenched via mergers, however, include trace populations of young stars. Even though mergers quenched the star formation in these massive galaxies at , they obtain young stars via accretion of younger satellite galaxies.
In the bottom panels of the figure, we examine ages and metallicities to understand why our models do not match the slope and normalization of the real red sequence. We include tracks showing the mean ages and stellar metallicities vs. stellar mass required to reproduce the observed red sequence. Specifically, on the plot of mean stellar age vs. stellar mass, we assume a uniform metallicity for all red sequence galaxies, and ask: what mean ages would those galaxies need to have to get the correct red sequence colours using the BC03 models? To answer this question, we create a grid of artificial single stellar populations (SSPs) with a variety of masses and randomly chosen metallicites and ages. This grid densely samples the region of the CMD where real red sequence galaxies lie. We then take our fit to the SDSS red sequence from Figure 4, and for each absolute magnitude bin we identify all the artificial SSPs which fall within the scatter of the median in and within 0.003 of the assumed metallicity. We compute the mean stellar mass and mean stellar age of these SSPs, and plot as a connected line in the figure. The plotted values have a scatter of 1 Gyr. We follow an analogous procedure for the tracks in the metallicity vs. stellar mass plots.
These tracks tell us what slope and normalization in age (metallicity) would be required to get the correct red sequence slope, assuming the red sequence has a constant metallicity (age). Of course, in real galaxies both age and metallicity may vary with stellar mass, but this is intended to illustrate the general trends. If age gradients along the red sequence are small, then we require a factor 2 difference in metallicity from the brightest galaxies to those an order of magnitude less massive in order to reproduce the correct slope. If metallicities are roughly constant across the red sequence, then we require variation of 3–4 Gyrs between the bright and faint galaxies for typical galaxy ages. Finally, if a typical age is 10 Gyr, then the simulation metallicities would need to be increased by in order to match the observed red sequence amplitude. We will discuss the implications of these trends in §6.4.
6.2 The blueness problem
In all cases our models yield red sequences too blue by about 0.1 magnitudes in , an error of 10% in the luminosity ratio between those bands. For these galaxies, colours are determined by matching each constituent star particle’s metallicity and age to grids from BC03 stellar population synthesis models. While the discrepancy might originate with uncertainties in the population synthesis models (e.g. Charlot et al., 1996; Conroy et al., 2009), we attempted to mitigate this possibility by using the same models as Blanton et al. (2005b) for the VAGC. We also tried the updated Charlot & Bruzual models (graciously provided to us by S. Charlot) that employ an updated treatement of thermally pulsating (TP) AGB stars, but these showed very minor difference compared to BC03 for our red sequence galaxies since TP-AGB stars do not contribute significantly to the luminosity in SDSS bands. Hence we explored other possible reasons for the blueness problem.
There are two ways to make a galaxy too blue: give it a younger age, or a lower metallicity. Perhaps our simulations simply have distributions of galaxy ages and metallicies that are wrong. As shown in Figure 15, our brightest red galaxies have mean stellar ages 10 Gyrs. This leaves little room to maneuver, as galaxies cannot get much older given the age of the Universe.
The story is different for metallicity. The tracks in Figure 15 suggest that the metallicities of our galaxies are systematically low. Very few galaxies show metallicities above 0.02 (metal mass fraction), but BC03 models require that the most massive galaxies have metallicities significantly above this to explain their red colours. Why might these galaxies be unrealistically metal poor?
As described in Finlator & Davé (2008), metallicities in un-quenched galaxies are determined by an equilibrium between less enriched gas accreted from the IGM and gas enriched by ongoing star formation. Metallicities tend to rise as a galaxy grows in mass, and even at fixed mass galaxies at lower redshift are more metal rich (Davé et al., 2007). Once quenching occurs in our models, the metallicities are frozen into the existing star particles. If our simulations quenched galaxies too early, the galaxies would not have built up their metallicities sufficiently.
Another uncertainty is the adopted supernova metal yields. We use a set of yields from various authors, most notably Chieffi & Limongi (2004) yields for Type II supernovae that dominate the stellar metal budget of these galaxies. The yields are not all that well constrained, and it is possible that they are higher than we have assumed. We note that our simulations assume Asplund et al. (2005) abundances, for which solar metallicity is a metal mass fraction of 0.0126, as opposed to the 0.02 fraction that is assumed for solar metallicity in the BC03 models. We assume that the metallicity scale in the BC03 models represents an absolute scale (S. Charlot & A. Bressan, private communication), so that e.g. a simulated galaxy that has “solar” metallicity of 0.0126 is computed using the BC03 templates.
Our enrichment and galactic wind models further complicate the interpretation of the metal content of simulated stellar populations. In our simulations, star formation induces both metal enrichment and galactic winds. The winds suppress enrichment of subsequently-forming stars by removing metals from the ISM; this process is poorly contrained observationally, and our model could be overly efficient at metal removal. We note, however, that the ejected metals in our outflow model match observations of IGM enrichment (Oppenheimer & Davé, 2008, 2009), so it is not clear that one can lower the ejected metals substantially. Since, however, most metals end up in the IGM particularly at early times (Oppenheimer et al., 2009a), it would not take large changes to the outflow model in order to double the metallicity retained in galaxies.
Our simulations do reproduce the stellar mass–gas phase metallicity relation for galaxies at (Finlator & Davé, 2008), suggesting that metallicities for star-forming galaxies in our simulation are generally correct. However, systematic uncertainties at the 0.2–0.3 dex level could impact the Finlator & Davé (2008) comparison with data from Erb et al. (2006). These uncertainties emerge from the calibration of metallicities derived from observations (cf. Kewley & Ellison, 2008), and because Finlator & Davé (2008) compared all simulated galaxies to UV-selected observations, which may have higher specific star formation rates and lower metallicities (Ellison et al., 2008). Hence there is plausibly room for variations in the metallicities of galaxies.
Finally, the under-enrichment could be related to the star formation history in the simulations. In particular, at least for the merger quenching, one expects that a starburst may be associated with the merger event (e.g. Mihos & Hernquist, 1996). We do not explicitly include such a starburst when we apply our quenching, and it could consume a significant amount of gas to create an enhanced metallicity. However, we note that we only quench galaxies typically well after the merger event, since we quench only at fixed time intervals of the simulation snapshots. While our simulations lack the resolution to track the detailed star formation history during the merger, the integral of the SFH is typically close to what would be obtained at much higher resolution, since it is primarily limited by the overall gas supply. Hence while the resolution limits may modestly impact star-formation histories, it is unlikely that higher resolution can boost the metal production (or stellar production) by a factor of two. Indeed, a simple comparison of our base simulation with another simulation with better mass resolution by a factor shows negligible differences in the mass-metallicity relation for star-forming galaxies at (see also Davé et al., 2007). For resolved galaxies at fixed stellar mass, fractional differences in metal content between the two simulations are no larger than about 5 per cent, considerably smaller than the mean fractional scatter within a single simulation of 13 per cent.
It is possible that there are some effects in the observations that make the observed galaxies too red. Deriving reliable absolute magnitudes from apparent magnitudes requires several steps and important assumptions. One must use some galaxy template to calculate a galaxy’s redshift/distance and k-correction (Hogg et al., 2002; Blanton & Roweis, 2007) from photometric data. In the VAGC, this is done by creating a suite of star formation histories with corresponding spectra from BC03 models, running a principle components analysis with the data to determine which star formation histories are most representative, then fitting each galaxy’s photometric data to the principle components as templates. The complexity of this procedure makes it difficult to independently determine the reliability of the fits or whether the chosen templates are sufficiently representative. Blanton et al. (2005b) do estimate uncertainties in reported absolute magnitudes for each galaxy in the VAGC; for and , these are typically magnitudes. Only systematic uncertainties much larger than these could give rise to the blueness problem, which seem unlikely.
In summary, the blueness problem is likely to reflect some issue with the chemical enrichment level of simulated galaxies. The most obvious explanation is that the yields are somewhat too low, or that our outflow model is too efficient at metal removal. In either case, while the overall metallicities are too low, the relative metallicities are basically correct, which means that predictions for the slope and scatter of the red sequence are robust. However, it cannot be ruled out that this is reflective of a more subtle issue with the star formation or chemical enrichment histories of our simulated galaxies.
6.3 Star formation histories

By shutting off star formation in the largest galaxies, quenching mechanisms strikingly impact global star formation. In our simulations without quenching, the most intense star formation occurs in the most massive galaxies, accounting for significant fractions of the of global star-formation rate density.
We show the effects of merger quenching and halo mass quenching on the star formation histories of galaxies of different masses in Figure 16. We first select galaxies from three stellar mass bins, and , at in the simulation with no quenching model applied. The bins have a width of 0.1 dex in stellar mass. We then find the time each star in these galaxies was formed, translating to star-formation rate (in yr) by averaging over intervals of 100 Myrs. Dividing by the number of galaxies in each mass bin, we get the average SFR per galaxy as a function of cosmic time. This methodology includes in the SFR any star-formation which occurred in small galaxies that later merged to form a massive galaxy that falls within one of our mass bins.
For the quenching models, we track the same galaxies selected above from the no-quenching simulation, but we ignore the contribution of quenched stars particles to the SFR. We thus show the effects of quenching on specific collections of galaxies, rather than galaxies in given mass bins selected for each model (the quenching models do not produce galaxies).
Both merger quenching and halo mass quenching strongly suppress star formation in massive galaxies, while barely changing the average SFR in the lowest mass bin. This effect naturally leads to “downsizing” with cosmic time (Cowie et al., 1996; Heavens et al., 2004; Juneau et al., 2005), where more star formation occurs in lower-mass galaxies at later times. Halo mass quenching suppresses SFRs more efficiently than mergers because it quenches satellite galaxies which later merge with the central galaxy. In contrast, merger quenching allows satellites to form stars until the final merger. Hence in principle, deriving accurate mean star formation histories from stacked galaxy samples in various mass bins can provide strong constraints on quenching mechanisms.
6.4 Successes and failures of quenching models
The most basic result of this paper is that both merger quenching and halo mass quenching successfully recover qualitative aspects of observed local CMDs and LFs. These quenching models greatly improve upon the results of hydrodynamic simulations that do not have any explicit quenching, which grossly overproduce the abundance of massive blue galaxies and fail to produce hardly any massive red galaxies. At absolute magnitudes , luminosity function results from both models using our favored parameters fall within a factor of of observed luminosity functions from SDSS. The quenching models also yields a qualitatively reasonable colour-magnitude diagram when we apply a dust correction for star-forming galaxies. Qualitatively, the red sequence grows as expected from observations, with the most massive present-day galaxies truncating star formation at , and galaxies around continuing to evolve onto the red sequence to . This leads to mean stellar ages of massive red sequence galaxies that are roughly consistent with observations (Graves et al., 2007, 2009). These are notable successes that show that quenching associated with one or both of these mechanisms is on the right track towards understanding the evolution of massive galaxies.
Models based on quenching hot mode accretion fail to produce a red sequence. This is mainly because even massive galaxies obtain a non-trivial amount of gas via cold mode accretion at the present day (Kereš et al., 2009b), which is enough to keep massive galaxies too blue. Hence one must prevent the vast majority of cold gas from entering into massive galaxies, be it pristine of recycled in a wind. Preventing hot and wind mode reaccretion produces a red sequence, but its LF is a power law with no obvious turnover at high masses.
Despite their broad successes, the merger and halo mass quenching model still fail in subtle ways. Investigating these failures critically can help us to identify the underlying physical processes that may be absent from our simulations.
The main failures of the merger quenching model are (a) an excess of very bright red galaxies, (b) a shallow slope in the red sequence color-magnitude relation, and (c) a shallow slope and a less pronounced knee in the luminosity function (as well as the stellar mass function).

The first problem results at least in part from post-quenching mergers. Quenched galaxies at the centres of massive halos build up stellar mass by accreting satellites. We illustrate the importance of this stellar mass accretion in Figure 17, which shows the stellar mass divided by the stellar mass at the time of quenching as a function of -band absolute magnitude. Since we show only quenched galaxies, post-quenching mergers drive all of the mass growth. In both merger quenching and halo mass quenching, the biggest galaxies have grown by factors via mergers since the time they moved onto the red sequence. However, the merger quenching is generally larger at a given luminosity, and extends to factors up to .
Too much mass is gained through this process, leading to excessively bright galaxies: galaxies brighter than () at in our model have grown in mass by a median factor of 3 since . This is inconsistent with observational constraints (Cool et al., 2008). Late-time mergers also explain the presence of young stars. Recent observations suggest no young populations in the brightest red sequence galaxies (Sánchez-Blázquez et al., 2009), although up to % of red sequence galaxies do have –3% of their mass in stars Gyr old (Yi et al., 2005; Schawinski et al., 2007; Kaviraj et al., 2007). It is unclear whether the presence and amount of young stars in our simulated quenched galaxies is inconsistent with these data; we leave a more detailed investigation for the future.
By building up mass with small galaxies, post-quenching mergers may also contribute to the shallow slope of the red sequence colour-magnitude relation produced in the merger model. Stellar metallicities drive the slope of the red sequence, and the mass-metallicity relations (Tremonti et al., 2004; Finlator & Davé, 2008) tell us that massive star-forming galaxies are more metal-rich than their less massive counterparts. If the mass-metallicity effect dominates over the time evolution of metallicity at fixed mass, then a red and dead galaxy built up through accretion of many smaller galaxies will have a lower metallicity than that of a galaxy which grew just as massive through star formation then moved to the red sequence. Any accreted satellites will have a lower metallicity, diluting the total metallicity of the galaxy.
The shape of the luminosity function is more difficult to interpret. Its value in any luminosity bin is determined in a complicated way by the number of galaxies moving to the red sequence from the blue cloud, and the number of galaxies moving along the red sequence. In principle, decreasing the mass accreted through satellites should steepen the red sequence slope, pushing the too-luminous galaxies to fainter magnitudes, as well as keeping their metallicities higher.
How might one lower the amount of satellite accretion? One possibility is that the issue is numerical. Simulations with low resolution tend to overmerge dynamical systems owing to stronger tidal forces on satellites whose spatial extents are artificially enlarged by force softening. Another possibility is that much of the satellite mass is actually going into diffuse halo (or intracluster) stars. Conroy et al. (2007) suggests that even fairly sizeable galaxies must be disrupted upon infall into clusters on a fairly short ( Gyr) timescale. Both trends suggest that our simulations probably overestimate the growth of the central galaxy, at the expense of intermediate-mass galaxies. Unfortunately, running higher resolution hydrodynamic simulations with sufficient volume to study very massive galaxies is not feasible, unless one performs constrained realizations of dense environments (in which case statistical comparisons become more complicated).
Turning to the halo mass quenching scenario, the main failures are a) an excess of very bright red galaxies, b) essentially zero slope in the red sequence, c) no knee in the luminosity function, and d) a steep mass cut-off for blue galaxies. The first three problems are similar to those for merger quenching. Very bright red galaxies build up to an excess mass even though the satellites they accrete have been quenched. The problem is slightly less severe as in the merger quenching case, likely because satellite galaxies halt their star formation earlier. However, this trend also causes the slightly shallower red sequence slope as compared to merger quenching, because the accreted satellites are less enriched. When galaxies first move to the red sequence, their metallicities are governed by the mass-metallicity relation. Since all red sequence galaxies arrive with roughly the same mass, they all start with roughly the same metallicity. Subsequent mergers between pairs of red sequence galaxies will then result in a remnant of the same metallicity. This results in almost no trend with metallicity along the bright red sequence () in this model, as seen in Figure 7, which is inconsistent with the rather pronounced slope in the observed red sequence.
The last problem appears more severe and intrinsic to the halo mass quenching scenario. The local universe clearly contains massive, bright blue galaxies; these are absent under this scenario. The difficulty is that the sharp halo mass cut produces a strong truncation of blue galaxies above a certain stellar mass, corresponding to the typical halo mass of truncation. Some blue galaxies are observed to have stellar masses well in excess of , which under this scenario would have to live in halos of mass . This is a remarkably high efficiency of star formation from the available baryonic reservoir of such halos, well above what is inferred from observations at any halo mass (McGaugh et al., 2009). This difficulty for halo mass-based quenching was also was found in a comparison of SAMs to SDSS data by Kimm et al. (2009).
Overall, merger quenching appears to do a reasonable job of producing a red sequence as observed, and the discrepancies may be traceable to numerical issues. Of course a fully realistic model with quenching implemented dynamically within the simulation may alter the results, but the results here provide useful intuition and a starting point for more sophisticated models.
How do our results compare to other galaxy evolution models? The SAMs of Croton et al. (2006), Bower et al. (2006), and Cattaneo et al. (2006), which use broadly similar quenching prescriptions to those we have adopted, appear better to match the observed color-magnitude relation of red sequence galaxies. These models have more freedom in the overall star formation histories of galaxies prior to quenching, since they contain free parameters to describe the gas dynamics. We also note that these models tend to populate a substantial red sequence without the additional quenchinq owing to hot haloes and/or AGN feedback, while our models do not. A major difference in the gas content of haloes may result from our self-consistent treatment of outflowing gas, which results in substantial re-accretion at late times (Oppenheimer et al., 2009b) as compared to treatments of outflows in these SAMs. De Lucia et al. (2010) point out how senstitive feedback prescriptions are to the gas content within haloes, so this could impact the nature and strength of quenching feedback. We are currently engaged in more detailed comparisons to SAMs, so we defer further discussion to future work.
6.5 Generic problems in massive galaxy evolution
There are several fairly generic difficulties in understanding quenching in the context of the observed galaxy population and its evolution. These are similar among all models of quenching we have examined, and hint at an underlying failure in our understanding or our current modeling techniques.
One issue is that there is an intrinsic tension between producing a strong knee in the luminosity or stellar mass function, and having blue galaxies exist in substantial numbers up to the highest stellar masses. The former would imply a very sharp quenching of star formation at a particular mass (stellar or halo), while the latter implies that quenching is a much more gradual function of mass. It is unclear how one can resolve this tension. Neither of our scenarios are able to do so, with merger quenching yielding large blue galaxies, and halo mass quenching producing a more pronounced truncation of the most massive galaxies.
A second issue is that the most massive galaxies are observed to have grown by a surprisingly small amount over the last Gyr (Cool et al., 2008; Banerji et al., 2009). A consequence of this is that we overpredict the bright end of the luminosity function in both our quenching models; this is even the case when the satellites quench immediately upon entering a quenched halo (in disagreement with data). One way to avoid this would be to have fewer or less massive satellites, or to avoid having them fall into the central galaxy. Perhaps more detailed simulations will reveal that our current results are tainted by numerical issues such as a lack of resolution, but even SAMs have shown similar issues. Understanding the dynamical evolution of a collisionless stellar and dark matter halo seems to be an unresolved problem in the context of massive galaxy evolution since .
A final issue is one of chemical enrichment, which is perhaps more subtle owing to current uncertainties in supernova yields and outflows. Nevertheless, it appears that our current simulations have difficulty enriching massive galaxies to observed levels, and perhaps more significantly, have trouble preferentially enriching massive red galaxies to levels approximately twice that of systems. This has traditionally been a difficulty of hierarchical models that assemble the massive end of the red sequence by dry mergers with lower-mass systems, as this will tend to decrease the average stellar metallicities of the most massive system. Hence either massive galaxies must be preferentially enriched to begin with, which is seemingly contradictory to the ideas that they quench early on when galaxies of a given stellar mass have lower metallicity, or else the satellites they acquire must be quite metal-rich, which causes tension with trying to limit the amount of late-time growth. There is the further problem of understanding why -enhancement grows with galaxy velocity dispersion (Graves et al., 2007), which again seems to place some stringent conditions on massive galaxy evolution (Calura & Menci, 2009; Arrigoni et al., 2010). Our current models do not reproduce this relationship, suggesting broader difficulties with the chemical enrichment histories of galaxies in these models. Given the sensitivity of the exact shape and amplitude of the red sequence to metallicity, it is clear that a full understanding of massive galaxies will require understanding both their star formation and chemical enrichment histories.
7 Summary and Conclusion
By combining cosmological SPH simulations with simple post-processing prescriptions for the quenching of star formation, we test several proposed quenching mechanisms associated with major mergers, halo mass quenching, and quenching of hot and recycled wind accretion modes. We compared the galaxy populations resulting from these scenarios with observations of the universe from SDSS. With reasonable parameter choices, our merger and halo mass quenching models vastly improve upon existing simulations by suppressing the excessive growth of massive blue galaxies and creating a well-defined bimodality in galaxy colors. However, even these models fail to match observations in detail, providing clues towards key issues in the modeling of massive galaxy eveolution.
Our main results are:
-
•
Merger quenching and halo mass quenching successfully produce a red sequence distinct from the blue cloud, with luminosity functions roughly consistent with those observed.
-
•
Quenching of hot mode accretion alone does not produce a viable red sequence, showing that late time accretion continues via cold mode in massive galaxies. Further quenching wind mode accretion produces a red sequence, but a highly discepant luminosity function.
-
•
Our preferred merger quenching model rules out the re-formation of disks after gas rich mergers, because such re-formation leads to the build up of too many massive galaxies.
-
•
The halo mass quenching model is quite sensitive to the threshold halo mass: yields the best match to the red galaxy luminosity function.
-
•
Both of these models yield an excess of bright red galaxies due to mergers after the quenching process, and both yield somewhat too few galaxies around ; these problems are more severe in the merger-based model.
-
•
Both models yield red sequences with too shallow slopes in the colour-magnitude diagram, likely due to near-constant mean stellar metallicity along the red sequence.
-
•
In both models, the red sequence is too blue by magnitudes, likely owing to simulated galaxies being too metal-poor by compared to real galaxies.
-
•
In both models, the brightest red sequence galaxies are quenched at redshifts , in general agreement with observed estimates.
We also identified some features that distinguish the merger quenching model from halo mass quenching:
-
•
Massive galaxies quenched via mergers include trace populations of young stars, whereas halo mass quenched galaxies do not. This is true only if satellites in addition to central galaxies are quenched in the halo mass scenario, but if this is not the case then the massive end of the LF is grossly overpopulated.
-
•
Merger quenching yields a population of very massive blue galaxies, with a mass function shape similar to that of red galaxies. Halo mass quenching creates a cutoff for blue galaxies at a stellar mass associated with the .
-
•
For resolved galaxies (), the rate of galaxies quenched via mergers peaks at , whereas halo mass quenching occurs at an approximately constant rate.
-
•
The luminosity function for red sequence galaxies created via merger quenching has a shallower (bright end) slope than that for halo mass quenching.
Overall, the merger quenching model seems to fare somewhat better than halo mass quenching, particularly in terms of the blue galaxy mass function, though it still has significant discrepancies versus data. The generic failures in both models in terms of the shallow red sequence slope, the lack of a pronounced knee at , and the excess of massive galaxies reflect that there may be generic failures of the manner in which we quench galaxies here. It is possible that some of the issues are numerical, but it could be that the quenching feedback processes actually impact subsequent galaxy evolution in a manner not accounted for by the post-processing technique we employ here.
These results give us general intuition about how the red sequence is formed, as well as highlight the key issues that must be tackled by models. A concerted effort along both observational and theoretical fronts will be required to fully decipher the implications of these various trends. In future work, we plan to implement physical models for quenching within simulations dynamically. By identifying halos and merger events on the fly in our simulations, and quenching as appropriate, we can realistically track the feedback from quenching that influences subsequent star formation in galaxies. Given the evidence of the present study we favor quenching mechanisms involving major mergers, but this is unlikely to be the entire story. This work is but an early step towards understanding the origin and evolution of the fundamental bimodality in today’s galaxy population.
Acknowledgments
We would like to thank Lars Hernquist, Dusan Keres, Neal Katz, Tom Quinn, Rodger Thompson, David Weinberg, and Ann Zabludoff for interesting and useful discussions.
Support for this work was provided by NASA through Hubble Fellowship grant HF-51254.01 awarded by the Space Telescope Science Institute, which is operated by the Association of Universities for Research in Astronomy, Inc., for NASA, under contract NAS5-26555. Funding for the Sloan Digital Sky Survey (SDSS) has been provided by the Alfred P. Sloan Foundation, the Participating Institutions, the National Aeronautics and Space Administration, the National Science Foundation, the U.S. Department of Energy, the Japanese Monbukagakusho, and the Max Planck Society. The SDSS Web site is http://www.sdss.org/. The SDSS is managed by the Astrophysical Research Consortium (ARC) for the Participating Institutions. The Participating Institutions are The University of Chicago, Fermilab, the Institute for Advanced Study, the Japan Participation Group, The Johns Hopkins University, Los Alamos National Laboratory, the Max-Planck-Institute for Astronomy (MPIA), the Max-Planck-Institute for Astrophysics (MPA), New Mexico State University, University of Pittsburgh, Princeton University, the United States Naval Observatory, and the University of Washington.
References
- Adelman-McCarthy et al. (2008) Adelman-McCarthy J. K. et al., 2008, ApJS, 175, 297
- Agertz et al. (2007) Agertz O. et al., 2007, MNRAS, 380, 963
- Arrigoni et al. (2010) Arrigoni M., Trager S. C., Somerville R. S., Gibson B. K., 2010, MNRAS, 402, 173
- Asplund et al. (2005) Asplund M., Grevesse N., Sauval A. J., 2005, in Astronomical Society of the Pacific Conference Series, Vol. 336, Cosmic Abundances as Records of Stellar Evolution and Nucleosynthesis, T. G. Barnes III & F. N. Bash, ed., pp. 25–+
- Baldry et al. (2006) Baldry I. K., Balogh M. L., Bower R. G., Glazebrook K., Nichol R. C., Budavari T., 2006, MNRAS, 373, 469
- Baldry et al. (2004) Baldry I. K., Glazebrook K., Brinkmann J., Ivezić Ž., Lupton R. H., Szalay A. S., 2004, ApJ, 600, 681
- Baldry et al. (2008) Baldry I. K., Glazebrook K., Driver S. P., 2008, MNRAS, 388, 945
- Balogh et al. (2004) Balogh M. L., Baldry I. K., Nichol R., Miller C., Bower R., Glazebrook K., 2004, ApJ, 615, L101
- Balogh et al. (2005) Balogh M. L., Miller C., Nichol R., Zabludoff A., Goto T., 2005, MNRAS, 360, 587
- Balogh et al. (2000) Balogh M. L., Navarro J. F., Morris S. L., 2000, ApJ, 540, 113
- Banerji et al. (2009) Banerji M., Ferreras I., Abdalla F. B., Hewett P., Lahav O., 2009, ArXiv e-prints
- Baugh et al. (2005) Baugh C. M., Lacey C. G., Frenk C. S., Granato G. L., Silva L., Bressan A., Cole S., 2005, MNRAS, 356, 1191
- Bell et al. (2004a) Bell E. F. et al., 2004a, ApJ, 600, L11
- Bell et al. (2004b) Bell E. F. et al., 2004b, ApJ, 608, 752
- Benson et al. (2002) Benson A. J., Lacey C. G., Baugh C. M., Cole S., Frenk C. S., 2002, MNRAS, 333, 156
- Binney (1977) Binney J., 1977, ApJ, 215, 483
- Birnboim & Dekel (2003) Birnboim Y., Dekel A., 2003, MNRAS, 345, 349
- Birnboim et al. (2007) Birnboim Y., Dekel A., Neistein E., 2007, MNRAS, 380, 339
- Blake et al. (2004) Blake C. et al., 2004, MNRAS, 355, 713
- Blanton (2006) Blanton M. R., 2006, ApJ, 648, 268
- Blanton et al. (2005a) Blanton M. R., Lupton R. H., Schlegel D. J., Strauss M. A., Brinkmann J., Loveday J., 2005a, ApJ, 631, 208
- Blanton & Roweis (2007) Blanton M. R., Roweis S., 2007, AJ, 133, 734
- Blanton et al. (2005b) Blanton M. R. et al., 2005b, AJ, 129, 2562
- Booth & Schaye (2009) Booth C. M., Schaye J., 2009, MNRAS, 398, 53
- Bower et al. (2006) Bower R. G., Benson A. J., Malbon R., Helly J. C., Frenk C. S., Baugh C. M., Lacey C. G., 2006, MNRAS, 370, 645
- Brammer et al. (2009) Brammer G. B. et al., 2009, ApJ, 706, L173
- Brooks et al. (2009) Brooks A. M., Governato F., Quinn T., Brook C. B., Wadsley J., 2009, ApJ, 694, 396
- Brown et al. (2008) Brown M. J. I. et al., 2008, ApJ, 682, 937
- Brüggen et al. (2005) Brüggen M., Ruszkowski M., Hallman E., 2005, ApJ, 630, 740
- Bruzual & Charlot (2003) Bruzual G., Charlot S., 2003, MNRAS, 344, 1000
- Calura & Menci (2009) Calura F., Menci N., 2009, MNRAS, 400, 1347
- Calzetti et al. (2000) Calzetti D., Armus L., Bohlin R. C., Kinney A. L., Koornneef J., 2000, ApJ, 533, 682
- Cattaneo et al. (2006) Cattaneo A., Dekel A., Devriendt J., Guiderdoni B., Blaizot J., 2006, MNRAS, 370, 1651
- Charlot et al. (1996) Charlot S., Worthey G., Bressan A., 1996, ApJ, 457, 625
- Chieffi & Limongi (2004) Chieffi A., Limongi M., 2004, ApJ, 608, 405
- Coil et al. (2008) Coil A. L. et al., 2008, ApJ, 672, 153
- Colberg & Di Matteo (2008) Colberg J. M., Di Matteo T., 2008, MNRAS, 387, 1163
- Cole et al. (2000) Cole S., Lacey C. G., Baugh C. M., Frenk C. S., 2000, MNRAS, 319, 168
- Conroy et al. (2009) Conroy C., Gunn J. E., White M., 2009, ApJ, 699, 486
- Conroy et al. (2007) Conroy C., Ho S., White M., 2007, MNRAS, 379, 1491
- Cool et al. (2008) Cool R. J. et al., 2008, ApJ, 682, 919
- Cool et al. (2006) Cool R. J., Eisenstein D. J., Johnston D., Scranton R., Brinkmann J., Zehavi I., 2006, AJ, 131, 736
- Cooper et al. (2009) Cooper M. C., Gallazzi A., Newman J. A., Yan R., 2009, ArXiv e-prints
- Cooper et al. (2007) Cooper M. C. et al., 2007, MNRAS, 376, 1445
- Cooper et al. (2006) Cooper M. C. et al., 2006, MNRAS, 370, 198
- Cowie et al. (1996) Cowie L. L., Songaila A., Hu E. M., Cohen J. G., 1996, AJ, 112, 839
- Cox et al. (2006a) Cox T. J., Dutta S. N., Di Matteo T., Hernquist L., Hopkins P. F., Robertson B., 2006a, ApJ, 650, 791
- Cox et al. (2006b) Cox T. J., Jonsson P., Primack J. R., Somerville R. S., 2006b, MNRAS, 373, 1013
- Croft et al. (2009) Croft R. A. C., Di Matteo T., Springel V., Hernquist L., 2009, MNRAS, 1486
- Croton et al. (2006) Croton D. J. et al., 2006, MNRAS, 365, 11
- Dasyra et al. (2006) Dasyra K. M. et al., 2006, ApJ, 638, 745
- Davé et al. (2006) Davé R., Finlator K., Oppenheimer B. D., 2006, MNRAS, 370, 273
- Davé et al. (2007) —, 2007, in EAS Publications Series, Vol. 24, EAS Publications Series, E. Emsellem, H. Wozniak, G. Massacrier, J.-F. Gonzalez, J. Devriendt, & N. Champavert, ed., pp. 183–189
- Davis & Geller (1976) Davis M., Geller M. J., 1976, ApJ, 208, 13
- De Lucia et al. (2010) De Lucia G., Boylan-Kolchin M., Benson A. J., Fontanot F., Monaco P., 2010, ArXiv e-prints
- DeGraf et al. (2009) DeGraf C., Di Matteo T., Springel V., 2009, ArXiv e-prints
- Dekel & Birnboim (2006) Dekel A., Birnboim Y., 2006, MNRAS, 368, 2
- Dekel & Birnboim (2008) —, 2008, MNRAS, 383, 119
- Dekel et al. (2009a) Dekel A. et al., 2009a, Nature, 457, 451
- Dekel et al. (2009b) Dekel A., Sari R., Ceverino D., 2009b, ApJ, 703, 785
- Di Matteo et al. (2008) Di Matteo T., Colberg J., Springel V., Hernquist L., Sijacki D., 2008, ApJ, 676, 33
- Di Matteo et al. (2005) Di Matteo T., Springel V., Hernquist L., 2005, Nature, 433, 604
- Dressler (1980) Dressler A., 1980, ApJ, 236, 351
- Drory et al. (2003) Drory N., Bender R., Feulner G., Hopp U., Maraston C., Snigula J., Hill G. J., 2003, ApJ, 595, 698
- Eggen et al. (1962) Eggen O. J., Lynden-Bell D., Sandage A. R., 1962, ApJ, 136, 748
- Ellison et al. (2008) Ellison S. L., Patton D. R., Simard L., McConnachie A. W., 2008, ApJ, 672, L107
- Erb et al. (2006) Erb D. K., Shapley A. E., Pettini M., Steidel C. C., Reddy N. A., 2006, ApJ, 644, 813
- Faber et al. (2007) Faber S. M. et al., 2007, ApJ, 665, 265
- Fardal et al. (2001) Fardal M. A., Katz N., Gardner J. P., Hernquist L., Weinberg D. H., Davé R., 2001, ApJ, 562, 605
- Ferrarese & Merritt (2000) Ferrarese L., Merritt D., 2000, ApJ, 539, L9
- Finlator & Davé (2008) Finlator K., Davé R., 2008, MNRAS, 385, 2181
- Finlator et al. (2007) Finlator K., Davé R., Oppenheimer B. D., 2007, MNRAS, 376, 1861
- Finlator et al. (2006) Finlator K., Davé R., Papovich C., Hernquist L., 2006, ApJ, 639, 672
- Gabor et al. (2009) Gabor J. M. et al., 2009, ApJ, 691, 705
- Gebhardt et al. (2000) Gebhardt K. et al., 2000, ApJ, 539, L13
- Governato et al. (2009) Governato F. et al., 2009, MNRAS, 398, 312
- Governato et al. (2007) Governato F., Willman B., Mayer L., Brooks A., Stinson G., Valenzuela O., Quinn T., 2007, MNRAS, 374, 1479
- Graves et al. (2009) Graves G. J., Faber S. M., Schiavon R. P., 2009, ApJ, 693, 486
- Graves et al. (2007) Graves G. J., Faber S. M., Schiavon R. P., Yan R., 2007, ApJ, 671, 243
- Grogin et al. (2005) Grogin N. A. et al., 2005, ApJ, 627, L97
- Gunn & Gott (1972) Gunn J. E., Gott J. R. I., 1972, ApJ, 176, 1
- Hatton et al. (2003) Hatton S., Devriendt J. E. G., Ninin S., Bouchet F. R., Guiderdoni B., Vibert D., 2003, MNRAS, 343, 75
- Heavens et al. (2004) Heavens A., Panter B., Jimenez R., Dunlop J., 2004, Nature, 428, 625
- Hogg et al. (2002) Hogg D. W., Baldry I. K., Blanton M. R., Eisenstein D. J., 2002, ArXiv Astrophysics e-prints
- Hopkins & Beacom (2006) Hopkins A. M., Beacom J. F., 2006, ApJ, 651, 142
- Hopkins et al. (2008) Hopkins P. F., Cox T. J., Kereš D., Hernquist L., 2008, ApJS, 175, 390
- Hopkins et al. (2006) Hopkins P. F., Hernquist L., Cox T. J., Robertson B., Springel V., 2006, ApJS, 163, 50
- Hopkins et al. (2009) Hopkins P. F. et al., 2009, MNRAS, 397, 802
- Hubble (1926) Hubble E. P., 1926, ApJ, 64, 321
- Juneau et al. (2005) Juneau S. et al., 2005, ApJ, 619, L135
- Kauffmann et al. (2003a) Kauffmann G. et al., 2003a, MNRAS, 346, 1055
- Kauffmann et al. (2003b) Kauffmann G. et al., 2003b, MNRAS, 341, 33
- Kauffmann et al. (2003c) Kauffmann G. et al., 2003c, MNRAS, 341, 54
- Kaviraj et al. (2007) Kaviraj S. et al., 2007, ApJS, 173, 619
- Kennicutt (1998) Kennicutt Jr. R. C., 1998, ApJ, 498, 541
- Kereš & Hernquist (2009) Kereš D., Hernquist L., 2009, ApJ, 700, L1
- Kereš et al. (2009a) Kereš D., Katz N., Davé R., Fardal M., Weinberg D. H., 2009a, MNRAS, 396, 2332
- Kereš et al. (2009b) Kereš D., Katz N., Fardal M., Davé R., Weinberg D. H., 2009b, MNRAS, 395, 160
- Kereš et al. (2005) Kereš D., Katz N., Weinberg D. H., Davé R., 2005, MNRAS, 363, 2
- Kewley & Ellison (2008) Kewley L. J., Ellison S. L., 2008, ApJ, 681, 1183
- Kimm et al. (2009) Kimm T. et al., 2009, MNRAS, 394, 1131
- Komatsu et al. (2009) Komatsu E. et al., 2009, ApJS, 180, 330
- Kormendy et al. (2009) Kormendy J., Fisher D. B., Cornell M. E., Bender R., 2009, ApJS, 182, 216
- Kormendy & Richstone (1995) Kormendy J., Richstone D., 1995, ARA&A, 33, 581
- Kriek et al. (2008) Kriek M., van der Wel A., van Dokkum P. G., Franx M., Illingworth G. D., 2008, ApJ, 682, 896
- Lauer et al. (2005) Lauer T. R. et al., 2005, AJ, 129, 2138
- Lupton (1993) Lupton R., 1993, Statistics in theory and practice, Lupton, R., ed. Princeton, N.J.: Princeton University Press, —c1993
- Madgwick et al. (2002) Madgwick D. S. et al., 2002, MNRAS, 333, 133
- Magorrian et al. (1998) Magorrian J. et al., 1998, AJ, 115, 2285
- Maiolino et al. (2008) Maiolino R. et al., 2008, A&A, 488, 463
- Maller et al. (2009) Maller A. H., Berlind A. A., Blanton M. R., Hogg D. W., 2009, ApJ, 691, 394
- Martin (2005) Martin C. L., 2005, ApJ, 621, 227
- Mathews (2009) Mathews W. G., 2009, ApJ, 695, L49
- McGaugh et al. (2009) McGaugh S. S., Schombert J. M., de Blok W. J. G., Zagursky M. J., 2009, ArXiv e-prints
- McKee & Ostriker (1977) McKee C. F., Ostriker J. P., 1977, ApJ, 218, 148
- McNamara et al. (2006) McNamara B. R. et al., 2006, ApJ, 648, 164
- Mihos & Hernquist (1996) Mihos J. C., Hernquist L., 1996, ApJ, 464, 641
- Murray et al. (2005) Murray N., Quataert E., Thompson T. A., 2005, ApJ, 618, 569
- Ocvirk et al. (2008) Ocvirk P., Pichon C., Teyssier R., 2008, MNRAS, 390, 1326
- Oemler (1974) Oemler A. J., 1974, ApJ, 194, 1
- Oke (1974) Oke J. B., 1974, ApJS, 27, 21
- Oppenheimer & Davé (2006) Oppenheimer B. D., Davé R., 2006, MNRAS, 373, 1265
- Oppenheimer & Davé (2008) —, 2008, MNRAS, 387, 577
- Oppenheimer & Davé (2009) —, 2009, MNRAS, 395, 1875
- Oppenheimer et al. (2009a) Oppenheimer B. D., Davé R., Finlator K., 2009a, MNRAS, 396, 729
- Oppenheimer et al. (2009b) Oppenheimer B. D., Davé R., Kereš D., Fardal M., Katz N., Weinberg D. H., 2009b, ArXiv e-prints
- Padmanabhan et al. (2008) Padmanabhan N. et al., 2008, ApJ, 674, 1217
- Peterson & Fabian (2006) Peterson J. R., Fabian A. C., 2006, Phys. Rep., 427, 1
- Phleps et al. (2006) Phleps S., Peacock J. A., Meisenheimer K., Wolf C., 2006, A&A, 457, 145
- Pozzetti et al. (2003) Pozzetti L. et al., 2003, A&A, 402, 837
- Quintero et al. (2004) Quintero A. D. et al., 2004, ApJ, 602, 190
- Richstone et al. (1998) Richstone D. et al., 1998, Nature, 395, A14+
- Robertson et al. (2006) Robertson B., Bullock J. S., Cox T. J., Di Matteo T., Hernquist L., Springel V., 2006, ApJ, 645, 986
- Rupke et al. (2005) Rupke D. S., Veilleux S., Sanders D. B., 2005, ApJS, 160, 115
- Ruszkowski et al. (2004a) Ruszkowski M., Brüggen M., Begelman M. C., 2004a, ApJ, 611, 158
- Ruszkowski et al. (2004b) —, 2004b, ApJ, 615, 675
- Sánchez et al. (2004) Sánchez S. F. et al., 2004, ApJ, 614, 586
- Sánchez-Blázquez et al. (2009) Sánchez-Blázquez P., Gibson B. K., Kawata D., Cardiel N., Balcells M., 2009, MNRAS, 1599
- Scannapieco & Bildsten (2005) Scannapieco E., Bildsten L., 2005, ApJ, 629, L85
- Schawinski et al. (2007) Schawinski K. et al., 2007, ApJS, 173, 512
- Schawinski et al. (2009) Schawinski K., Virani S., Simmons B., Urry C. M., Treister E., Kaviraj S., 2009, ApJ, 692, L19
- Schaye et al. (2009) Schaye J. et al., 2009, ArXiv e-prints
- Schmidt (1959) Schmidt M., 1959, ApJ, 129, 243
- Schmidt (1968) —, 1968, ApJ, 151, 393
- Sijacki et al. (2007) Sijacki D., Springel V., Di Matteo T., Hernquist L., 2007, MNRAS, 380, 877
- Silverman et al. (2008) Silverman J. D. et al., 2008, ApJ, 675, 1025
- Simha et al. (2009) Simha V., Weinberg D. H., Davé R., Gnedin O. Y., Katz N., Kereš D., 2009, MNRAS, 399, 650
- Sobral et al. (2010) Sobral D., Best P. N., Geach J. E., Smail I., Cirasuolo M., Garn T., Kurk J., 2010, MNRAS, 255
- Somerville et al. (2008) Somerville R. S., Hopkins P. F., Cox T. J., Robertson B. E., Hernquist L., 2008, MNRAS, 391, 481
- Springel (2005) Springel V., 2005, MNRAS, 364, 1105
- Springel et al. (2005a) Springel V., Di Matteo T., Hernquist L., 2005a, ApJ, 620, L79
- Springel & Hernquist (2003) Springel V., Hernquist L., 2003, MNRAS, 339, 289
- Springel & Hernquist (2005) —, 2005, ApJ, 622, L9
- Springel et al. (2005b) Springel V. et al., 2005b, Nature, 435, 629
- Strateva et al. (2001) Strateva I. et al., 2001, AJ, 122, 1861
- Sutherland & Dopita (1993) Sutherland R. S., Dopita M. A., 1993, ApJS, 88, 253
- Taylor et al. (2009) Taylor E. N. et al., 2009, ApJ, 694, 1171
- Thompson (2002) Thompson R. I., 2002, ApJ, 581, L85
- Thompson et al. (2006) Thompson R. I., Eisenstein D., Fan X., Dickinson M., Illingworth G., 2006, ApJ, 647, 787
- Thompson et al. (2001) Thompson R. I., Weymann R. J., Storrie-Lombardi L. J., 2001, ApJ, 546, 694
- Toomre & Toomre (1972) Toomre A., Toomre J., 1972, ApJ, 178, 623
- Totani (2005) Totani T., 2005, New Astronomy Review, 49, 205
- Trager et al. (2000) Trager S. C., Faber S. M., Worthey G., González J. J., 2000, AJ, 120, 165
- Tremaine et al. (2002) Tremaine S. et al., 2002, ApJ, 574, 740
- Tremonti et al. (2004) Tremonti C. A. et al., 2004, ApJ, 613, 898
- Wang & Heckman (1996) Wang B., Heckman T. M., 1996, ApJ, 457, 645
- Weinberg et al. (2004) Weinberg D. H., Davé R., Katz N., Hernquist L., 2004, ApJ, 601, 1
- Weiner et al. (2005) Weiner B. J. et al., 2005, ApJ, 620, 595
- Weinmann et al. (2009) Weinmann S. M., Kauffmann G., van den Bosch F. C., Pasquali A., McIntosh D. H., Yang X., Guo Y., 2009, MNRAS, 394, 1213
- Weinmann et al. (2006) Weinmann S. M., van den Bosch F. C., Yang X., Mo H. J., 2006, MNRAS, 366, 2
- White & Rees (1978) White S. D. M., Rees M. J., 1978, MNRAS, 183, 341
- Wild et al. (2009) Wild V., Walcher C. J., Johansson P. H., Tresse L., Charlot S., Pollo A., de Ravel L., 2009, MNRAS, 395, 144
- Williams et al. (2009) Williams R. J., Quadri R. F., Franx M., van Dokkum P., Labbé I., 2009, ApJ, 691, 1879
- Willmer et al. (2006) Willmer C. N. A. et al., 2006, ApJ, 647, 853
- Woods et al. (2006) Woods D. F., Geller M. J., Barton E. J., 2006, AJ, 132, 197
- Yang et al. (2006) Yang Y., Zabludoff A. I., Davé R., Eisenstein D. J., Pinto P. A., Katz N., Barton E. J., 2006, ApJ, 640, 539
- Yang et al. (2008) Yang Y., Zabludoff A. I., Zaritsky D., Mihos J. C., 2008, ApJ, 688, 945
- Yi et al. (2005) Yi S. K. et al., 2005, ApJ, 619, L111
- Zabludoff et al. (1996) Zabludoff A. I., Zaritsky D., Lin H., Tucker D., Hashimoto Y., Shectman S. A., Kirshner R. P., 1996, ApJ, 466, 104
- Zehavi et al. (2002) Zehavi I. et al., 2002, ApJ, 571, 172
- Zehavi et al. (2005) Zehavi I. et al., 2005, ApJ, 630, 1