Ordered spin structures of β𝛽\beta-MnO2 (rutile-type) systems with competing exchange interactions: numerical approach using equi-energy contour plot

Masatsugu Suzuki suzuki@binghamton.edu Department of Physics, State University of New York at Binghamton, Binghamton, New York 13902-6000    Itsuko S. Suzuki itsuko@binghamton.edu Department of Physics, State University of New York at Binghamton, Binghamton, New York 13902-6000
Abstract

Using numerical calculations of equi-energy contour plot of the Fourier transform of the spin Hamiltonian, we study the magnetic phase diagram (J2subscript𝐽2J_{2} and J3subscript𝐽3J_{3}) of the rutile type β𝛽\beta-MnO2, where J1subscript𝐽1J_{1} (<0absent0<0) is fixed and is the antiferromagnetic interaction along the diagonal direction, J2subscript𝐽2J_{2} is the interaction along the c𝑐c axis, and J3subscript𝐽3J_{3} is the interaction along the aπ‘Ža axis. The magnetic phase diagram consists of the multricritical point (the intersection J2​J3=J12subscript𝐽2subscript𝐽3superscriptsubscript𝐽12J_{2}J_{3}=J_{1}^{2} and J2+J3=2​J1subscript𝐽2subscript𝐽32subscript𝐽1J_{2}+J_{3}=2J_{1}), the helical order along the c𝑐c axis, the (h=1/2,k=0,l=1/2)formulae-sequenceβ„Ž12formulae-sequenceπ‘˜0𝑙12(h=1/2,k=0,l=1/2) phase, the helical order along the aπ‘Ža axis, and the phase (h=0,k=0,l=1)formulae-sequenceβ„Ž0formulae-sequenceπ‘˜0𝑙1(h=0,k=0,l=1). The shift of the location of the magnetic Bragg peak in the (h,0,l)β„Ž0𝑙(h,0,l) reciprocal lattice plane is examined with the change of J2subscript𝐽2J_{2} and J3subscript𝐽3J_{3} in the phase diagram. The shift is discontinuous on the first-order phase transition, and is continuous on the second-order phase transition. The detail of our magnetic phase diagram is rather different from that reported by Yoshimori.

pacs:
75.10.-b,75.30.Kz

I Introduction

It is well known that β𝛽\beta-MnO2 (with the rutile-type structure) is one of the systems with a helical spin order along the c𝑐c axis. Ericksonref01 found from magnetic neutron scattering on β𝛽\beta-MnO2 that the spins are helically ordered with a period of 7c𝑐c along the c𝑐c axis. The direction of spins in the c𝑐c plane turns from one plane to the next plane by an angle of 129∘superscript129129^{\circ} (5​π/75πœ‹75\pi/7). In 1958, Yoshimoriref02 theoretically demonstrated the origin and stability of the helical spin order in β𝛽\beta-MnO2, based on the experimental results from Erickson. The spin Hamiltonian of β𝛽\beta-MnO2 is described by a form of the Heisenberg-type, where the combination of nearest neighbor (n.n.) exchange interactions, next nearest neighbor (n.n.n.) exchange interactions, and so on are included. His success lies in the use of the Fourier transform of the spin Hamiltonian in the reciprocal lattice space. Then the Fourier transform depends only on exchange interactions and wavevectors Q. The location of the magnetic Bragg points in the reciprocal lattice space are uniquely determined from the condition that the Fourier transform takes a maximum.

In spite of the success in theory established by Yoshimori,ref02 Erickson has not published his detailed data of the magnetic neutron scattering of β𝛽\beta-MnO2 as far as we know. Since 1958, there have been several papers on the magnetic structure of β𝛽\beta-MnO2 using magnetic neutron scatteringref03 ; ref04 ; ref05 and magnetic x-ray scattering.ref06 ; ref07 In recent years, Sato et al, have reported that the magnetic Bragg peaks appear at the wave vector Q = (1, 0, 2 + Ο΅italic-Ο΅\epsilon) in the units of aβˆ—superscriptπ‘Ža^{*} (=2​π/aabsent2πœ‹π‘Ž=2\pi/a), bβˆ—superscript𝑏b^{*} (=2​π/babsent2πœ‹π‘=2\pi/b), and cβˆ—superscript𝑐c^{*} (=2​π/cabsent2πœ‹π‘=2\pi/c) in the reciprocal lattice space, where Ο΅italic-Ο΅\epsilon = 0.297 at 10 K, increases with increasing temperature, and reaches 0.2992 just below TNsubscript𝑇𝑁T_{N} (= 92 K). The value of Ο΅italic-Ο΅\epsilon is rather different from 2/7 derived by Yoshimori.ref02 This indicates that the helical spin structure along the c𝑐c axis is incommensurate with the c𝑐c- axis lattice constant.

Because of the crystal field (distorted octahedron formed by O2- ions) in the vicinity of Mn4+ ion, the ground orbital state of Mn4+ ion (3​d33superscript𝑑33d^{3}, L𝐿L = 3 and S𝑆S = 3/2) is split into the t2​gsubscript𝑑2𝑔t_{2g} (d​ϡ𝑑italic-Ο΅d\epsilon) level (lower energy level, triple degenerate) and the egsubscript𝑒𝑔e_{g} (d​γ𝑑𝛾d\gamma) level (upper energy, double degenerate). As a result, the ground state is now orbital singlet, indicating that the orbital angular momentum is quenched. The egsubscript𝑒𝑔e_{g} electrons are responsible for the metallic conduction, while the localized t2​gsubscript𝑑2𝑔t_{2g} electrons are responsible for the magnetism. In recent years, Sato et al.ref08 have reported the transport properties of a single crystal β𝛽\beta-MnO2, such as electrical resistivity, thermopower, Hall effect, and magnetoresistance. Their data show an appreciable anomaly near TNsubscript𝑇𝑁T_{N}. This implies that there is a strong correlation between conduction Ο΅gsubscriptitalic-ϡ𝑔\epsilon_{g} electrons and localized t2​gsubscript𝑑2𝑔t_{2g} magnetic moment through the Hund’s rule. The DC magnetic susceptibility shows a significant deviation from a molecular-field theory based on a localized spin model, which was assumed by Yoshimoriref02 on his helical spin order.

In the present paper, we study the magnetic phase diagram of β𝛽\beta-MnO2 type structure using the molecular field theory developed by Yoshimori,ref02 where Mn4+ spins are localized. The exchange interactions J1subscript𝐽1J_{1} along the diagonal axis of the system, J2subscript𝐽2J_{2} along the c𝑐c axis and J3subscript𝐽3J_{3} along the aπ‘Ža axis are taken into account. Note that J1subscript𝐽1J_{1} is assumed to be fixed and be antiferromagnetic. According to Sato et al.,ref08 the intra-atomic t2​gβˆ’egsubscript𝑑2𝑔subscript𝑒𝑔t_{2g}-e_{g} exchange interaction (Hund coupling), the transfer interaction between adjacent egsubscript𝑒𝑔e_{g} orbitals, and the occupancy of the egsubscript𝑒𝑔e_{g} orbitals are defined by JH​u​n​dsubscript𝐽𝐻𝑒𝑛𝑑J_{Hund}, t𝑑t, and c𝑐c, respectively. Since |Jn|≫|c​JH​u​n​d|much-greater-thansubscript𝐽𝑛𝑐subscript𝐽𝐻𝑒𝑛𝑑\left|J_{n}\right|\gg\left|cJ_{Hund}\right| and |Jn|≫|c​t|much-greater-thansubscript𝐽𝑛𝑐𝑑\left|J_{n}\right|\gg\left|ct\right| for β𝛽\beta-MnO2 (n=1,2,3𝑛123n=1,2,3),ref08 this means that the spin structure of β𝛽\beta-MnO2 below TNsubscript𝑇𝑁T_{N} is not affected by the effect of c​JH​u​n​d𝑐subscript𝐽𝐻𝑒𝑛𝑑cJ_{Hund} and c​t𝑐𝑑ct at al. In other words, the spin structure is well described by the localized spin model with J1subscript𝐽1J_{1}, J2subscript𝐽2J_{2}, and J3subscript𝐽3J_{3}. We find that our magnetic phase diagram (J2subscript𝐽2J_{2} vs J3subscript𝐽3J_{3}) consists of four phases including the helical phase along the c𝑐c axis, the phase with (1/2, 0, 1/2), the helical phase along the aπ‘Ža axis, and the phase with (1, 0, 0). The detail of our phase diagram is rather different from that proposed by Yoshimori.ref02 We use a numerical calculation approach in finding the distribution of the magnetic Bragg peaks in the fixed reciprocal lattice planes such as (h,k,l)β„Žπ‘˜π‘™(h,k,l) with one index fixed. To this end we calculate the equi-energy contour plot of the negative sign of the Fourier transform of the spin Hamiltonian, J​(h,k,l)π½β„Žπ‘˜π‘™J(h,k,l). The magnetic Bragg peaks are located inside the maximum equi-energy contour. The selection rule for the location of the magnetic Bragg peaks is the same as that derived by Yoshimori.ref02 This numerical method has an advantage in visualizing the location of the magnetic Bragg peaks in the reciprocal lattice space. The nature of the phase transitions on the phase boundaries will be discussed.

II BACKGROUND: general theory for the ordered spin structure

We follow the theory presented by Nagamiya.ref09 We consider a lattice of magnetic atoms such as β𝛽\beta-MnO2. The unit cell can be chosen so that it contains one magnetic atom. On each magnetic atom, we assume a classical spin. Between the spin 𝐒isubscript𝐒𝑖{\bf S}_{i} at the position 𝐑isubscript𝐑𝑖{\bf R}_{i} and 𝐒jsubscript𝐒𝑗{\bf S}_{j} at 𝐑jsubscript𝐑𝑗{\bf R}_{j}, there is an Heisenberg-type exchange interaction. The Heisenberg spin Hamiltonian is expressed by

H=βˆ’2β€‹βˆ‘i,jJ​(𝐑i​j)​𝐒i⋅𝐒j,𝐻2subscript𝑖𝑗⋅𝐽subscript𝐑𝑖𝑗subscript𝐒𝑖subscript𝐒𝑗H=-2\sum\limits_{i,j}J({\bf R}_{ij}){\bf S}_{i}\cdot{\bf S}_{j}, (1)

where

J​(βˆ’π‘i​j)=J​(𝐑i​j),𝐽subscript𝐑𝑖𝑗𝐽subscript𝐑𝑖𝑗J(-{\bf R}_{ij})=J({\bf R}_{ij}),

and

𝐑i​j=𝐑iβˆ’π‘j.subscript𝐑𝑖𝑗subscript𝐑𝑖subscript𝐑𝑗{\bf R}_{ij}={\bf R}_{i}-{\bf R}_{j}.

The exchange interaction J​(𝐑i​j)𝐽subscript𝐑𝑖𝑗J({\bf R}_{ij}) is not restricted to the nearest neighbors. We now use the Fourier transformations of the exchange interaction and spin;

J​(πͺ)=βˆ‘j(β‰ i)J​(𝐑i​j)​exp⁑(βˆ’i​πͺ⋅𝐑i​j),𝐽πͺsubscriptannotated𝑗absent𝑖𝐽subscript𝐑𝑖𝑗⋅𝑖πͺsubscript𝐑𝑖𝑗\displaystyle J({\bf q})=\sum\limits_{j(\neq i)}J({\bf R}_{ij})\exp(-i{\bf q}\cdot{\bf R}_{ij}), (2)
𝐒i=1Nβ€‹βˆ‘πͺ𝐒πͺ​exp⁑(i​q⋅𝐑i),subscript𝐒𝑖1𝑁subscriptπͺsubscript𝐒πͺβ‹…π‘–π‘žsubscript𝐑𝑖\displaystyle{\bf S}_{i}=\frac{1}{\sqrt{N}}\sum\limits_{{\bf q}}{\bf S}_{{\bf q}}\exp(iq\cdot{\bf R}_{i}), (3)

with

𝐒πͺ=1Nβ€‹βˆ‘i𝐒i​exp⁑(βˆ’i​πͺ⋅𝐑i),subscript𝐒πͺ1𝑁subscript𝑖subscript𝐒𝑖⋅𝑖πͺsubscript𝐑𝑖{\bf S}_{{\bf q}}=\frac{1}{\sqrt{N}}\sum\limits_{i}{\bf S}_{i}\exp(-i{\bf q}\cdot{\bf R}_{i}),

where N𝑁N (=N1​N2​N3absentsubscript𝑁1subscript𝑁2subscript𝑁3=N_{1}N_{2}N_{3}) is the total number of spins, and 𝐒qβˆ—=π’βˆ’qsuperscriptsubscriptπ’π‘žsubscriptπ’π‘ž{\bf S}_{q}^{*}={\bf S}_{-q}. The position vector 𝐑isubscript𝐑𝑖{\bf R}_{i} is expressed by

𝐑i=n1β€‹πš1+n2β€‹πš2+n3β€‹πš3​ (​n1,n2,n3​ are integers),subscript𝐑𝑖subscript𝑛1subscript𝐚1subscript𝑛2subscript𝐚2subscript𝑛3subscript𝐚3Β (subscript𝑛1subscript𝑛2subscript𝑛3Β are integers){\bf R}_{i}=n_{1}{\bf a}_{1}+n_{2}{\bf a}_{2}+n_{3}{\bf a}_{3}\text{ (}n_{1},n_{2},n_{3}\text{ are integers)},

where n1=0,1,β‹―,N1subscript𝑛101β‹―subscript𝑁1n_{1}=0,1,\cdots,N_{1}, n2=0,1,β‹―,N2subscript𝑛201β‹―subscript𝑁2n_{2}=0,1,\cdots,N_{2}, n3=0,1,β‹―,N3subscript𝑛301β‹―subscript𝑁3n_{3}=0,1,\cdots,N_{3}, and 𝐚1subscript𝐚1{\bf a}_{1}, 𝐚2subscript𝐚2{\bf a}_{2}, and 𝐚3subscript𝐚3{\bf a}_{3} are the fundamental lattice vectors. We also define the reciprocal lattice vector G𝐺G by

G​(h,k,l)=h​𝐛1+k​𝐛2+l​𝐛3​ (​h,k,l​ are integers),πΊβ„Žπ‘˜π‘™β„Žsubscript𝐛1π‘˜subscript𝐛2𝑙subscript𝐛3Β (β„Žπ‘˜π‘™Β are integers)G(h,k,l)=h{\bf b}_{1}+k{\bf b}_{2}+l{\bf b}_{3}\text{ (}h,k,l\text{ are integers)},

where b1, b2, and b3 are fundamental reciprocal lattice vectors and are given by

𝐛1=2β€‹Ο€β€‹πš2Γ—πš3[𝐚1,𝐚2,𝐚3],𝐛2=2β€‹Ο€β€‹πš3Γ—πš1[𝐚1,𝐚2,𝐚3],𝐛3=2β€‹Ο€β€‹πš1Γ—πš2[𝐚1,𝐚2,𝐚3],formulae-sequencesubscript𝐛12πœ‹subscript𝐚2subscript𝐚3subscript𝐚1subscript𝐚2subscript𝐚3formulae-sequencesubscript𝐛22πœ‹subscript𝐚3subscript𝐚1subscript𝐚1subscript𝐚2subscript𝐚3subscript𝐛32πœ‹subscript𝐚1subscript𝐚2subscript𝐚1subscript𝐚2subscript𝐚3{\bf b}_{1}=2\pi\frac{{\bf a}_{2}\times{\bf a}_{3}}{[{\bf a}_{1},{\bf a}_{2},{\bf a}_{3}]},{\bf b}_{2}=2\pi\frac{{\bf a}_{3}\times{\bf a}_{1}}{[{\bf a}_{1},{\bf a}_{2},{\bf a}_{3}]},{\bf b}_{3}=2\pi\frac{{\bf a}_{1}\times{\bf a}_{2}}{[{\bf a}_{1},{\bf a}_{2},{\bf a}_{3}]},

with

[𝐚1,𝐚2,𝐚3]=𝐚1β‹…(𝐚2Γ—πš3)=𝐚2β‹…(𝐚3Γ—πš1)=𝐚3β‹…(𝐚1Γ—πš2).subscript𝐚1subscript𝐚2subscript𝐚3β‹…subscript𝐚1subscript𝐚2subscript𝐚3β‹…subscript𝐚2subscript𝐚3subscript𝐚1β‹…subscript𝐚3subscript𝐚1subscript𝐚2[{\bf a}_{1},{\bf a}_{2},{\bf a}_{3}]={\bf a}_{1}\cdot\left({\bf a}_{2}\times{\bf a}_{3}\right)={\bf a}_{2}\cdot\left({\bf a}_{3}\times{\bf a}_{1}\right)={\bf a}_{3}\cdot\left({\bf a}_{1}\times{\bf a}_{2}\right).

Noting that

𝐚1⋅𝐛1=2​π,𝐚2⋅𝐛2=2​π,𝐚3⋅𝐛3=2​π,formulae-sequenceβ‹…subscript𝐚1subscript𝐛12πœ‹formulae-sequenceβ‹…subscript𝐚2subscript𝐛22πœ‹β‹…subscript𝐚3subscript𝐛32πœ‹{\bf a}_{1}\cdot{\bf b}_{1}=2\pi,{\bf a}_{2}\cdot{\bf b}_{2}=2\pi,{\bf a}_{3}\cdot{\bf b}_{3}=2\pi,

we have

𝐆​(h,k,l)⋅𝐑i=2​π​(n1​h+n2​k+n3​l)=2​π×integer.β‹…π†β„Žπ‘˜π‘™subscript𝐑𝑖2πœ‹subscript𝑛1β„Žsubscript𝑛2π‘˜subscript𝑛3𝑙2πœ‹integer{\bf G}(h,k,l)\cdot{\bf R}_{i}=2\pi(n_{1}h+n_{2}k+n_{3}l)=2\pi\times\text{integer}.

The periodic boundary condition for 𝐒isubscript𝐒𝑖{\bf S}_{i} leads to

exp⁑[i​πͺβ‹…(N1β€‹πš1)]=1,exp⁑[i​πͺβ‹…(N2β€‹πš2)]=1,exp⁑[i​πͺβ‹…(N3β€‹πš3)]=1.formulae-sequence⋅𝑖πͺsubscript𝑁1subscript𝐚11formulae-sequence⋅𝑖πͺsubscript𝑁2subscript𝐚21⋅𝑖πͺsubscript𝑁3subscript𝐚31\exp[i{\bf q}\cdot(N_{1}{\bf a}_{1})]=1,\exp[i{\bf q}\cdot(N_{2}{\bf a}_{2})]=1,\exp[i{\bf q}\cdot(N_{3}{\bf a}_{3})]=1.

This means that the wavevector q is given by

πͺ=q1​𝐛1+q2​𝐛2+q3​𝐛3,πͺsubscriptπ‘ž1subscript𝐛1subscriptπ‘ž2subscript𝐛2subscriptπ‘ž3subscript𝐛3{\bf q}=q_{1}{\bf b}_{1}+q_{2}{\bf b}_{2}+q_{3}{\bf b}_{3},

where

q1=m1N1,q2=m2N2,q3=m3N2.formulae-sequencesubscriptπ‘ž1subscriptπ‘š1subscript𝑁1formulae-sequencesubscriptπ‘ž2subscriptπ‘š2subscript𝑁2subscriptπ‘ž3subscriptπ‘š3subscript𝑁2q_{1}=\frac{m_{1}}{N_{1}},q_{2}=\frac{m_{2}}{N_{2}},q_{3}=\frac{m_{3}}{N_{2}}.

For convenience we assume that

βˆ’N12≀m1≀N12,βˆ’N22≀m2≀N22,βˆ’N32≀m3≀N32,formulae-sequencesubscript𝑁12subscriptπ‘š1subscript𝑁12subscript𝑁22subscriptπ‘š2subscript𝑁22subscript𝑁32subscriptπ‘š3subscript𝑁32-\frac{N_{1}}{2}\leq m_{1}\leq\frac{N_{1}}{2},-\frac{N_{2}}{2}\leq m_{2}\leq\frac{N_{2}}{2},-\frac{N_{3}}{2}\leq m_{3}\leq\frac{N_{3}}{2},

corresponding to the first Brillouin zone. There are N1​N2​N3=Nsubscript𝑁1subscript𝑁2subscript𝑁3𝑁N_{1}N_{2}N_{3}=N wavevectors in the first Brillouin zone. The spin Hamiltonian is rewritten as

H=βˆ’βˆ‘πͺJ​(πͺ)​𝐒πͺβ‹…π’βˆ’πͺ.𝐻subscriptπͺ⋅𝐽πͺsubscript𝐒πͺsubscript𝐒πͺH=-\sum\limits_{{\bf q}}J({\bf q}){\bf S}_{{\bf q}}\cdot{\bf S}_{-{\bf q}}. (4)

We look for the lowest minimum of Eq.(1) under the condition that

𝐒i2=S2=1Nβ€‹βˆ‘πͺ,πͺ′𝐒πͺβ‹…π’βˆ’πͺ′​exp⁑[i​(πͺβˆ’πͺβ€²)⋅𝐑i],superscriptsubscript𝐒𝑖2superscript𝑆21𝑁subscriptπͺsuperscriptπͺβ€²β‹…subscript𝐒πͺsubscript𝐒superscriptπͺ′⋅𝑖πͺsuperscriptπͺβ€²subscript𝐑𝑖{\bf S}_{i}^{2}=S^{2}=\frac{1}{N}\sum\limits_{{\bf q},{\bf q}^{\prime}}{\bf S}_{{\bf q}}\cdot{\bf S}_{-{\bf q}^{\prime}}\exp[i({\bf q}-{\bf q}^{\prime})\cdot{\bf R}_{i}], (5)

for any i𝑖i. Instead of this condition, we impose a milder condition

N​S2𝑁superscript𝑆2\displaystyle NS^{2} =\displaystyle= βˆ‘i𝐒i2=1Nβ€‹βˆ‘iβˆ‘πͺ,πͺ′𝐒πͺβ‹…π’βˆ’πͺ′​exp⁑[i​(πͺβˆ’πͺβ€²)β‹…Ri]subscript𝑖superscriptsubscript𝐒𝑖21𝑁subscript𝑖subscriptπͺsuperscriptπͺβ€²β‹…subscript𝐒πͺsubscript𝐒superscriptπͺ′⋅𝑖πͺsuperscriptπͺβ€²subscript𝑅𝑖\displaystyle\sum\limits_{i}{\bf S}_{i}^{2}=\frac{1}{N}\sum\limits_{i}\sum\limits_{{\bf q},{\bf q}^{\prime}}{\bf S}_{{\bf q}}\cdot{\bf S}_{-{\bf q}^{\prime}}\exp[i({\bf q}-{\bf q}^{\prime})\cdot R_{i}] (6)
=\displaystyle= βˆ‘πͺ𝐒πͺβ‹…π’βˆ’πͺ,subscriptπͺβ‹…subscript𝐒πͺsubscript𝐒πͺ\displaystyle\sum\limits_{{\bf q}}{\bf S}_{{\bf q}}\cdot{\bf S}_{-{\bf q}},

where we use

βˆ‘iexp⁑[i​(πͺβˆ’πͺβ€²)⋅𝐑i]=N​δπͺ,πͺβ€².subscript𝑖⋅𝑖πͺsuperscriptπͺβ€²subscript𝐑𝑖𝑁subscript𝛿πͺsuperscriptπͺβ€²\sum\limits_{i}\exp[i({\bf q}-{\bf q}^{\prime})\cdot{\bf R}_{i}]=N\delta_{{\bf q},{\bf q}^{\prime}}.

Under this milder condition, the minimum of Eq.(1) is obtained simply by taking only that q for which J​(πͺ)𝐽πͺJ({\bf q}) has the maximum. Denoting this q by Q (q = -Q being equally allowed), we have the minimum value of Eq.(4) as

βˆ’J​(𝐐)​(π’πβ‹…π’βˆ’π+π’βˆ’πβ‹…π’π).𝐽𝐐⋅subscript𝐒𝐐subscript𝐒𝐐⋅subscript𝐒𝐐subscript𝐒𝐐-J({\bf Q})({\bf S}_{{\bf Q}}\cdot{\bf S}_{-{\bf Q}}+{\bf S}_{-{\bf Q}}\cdot{\bf S}_{{\bf Q}}).

We also obtain

𝐒i=1N​[𝐒𝐐​exp⁑(i​𝐐⋅𝐑i)+π’βˆ’πβ€‹exp⁑(βˆ’i​𝐐⋅𝐑i)].subscript𝐒𝑖1𝑁delimited-[]subscript𝐒𝐐⋅𝑖𝐐subscript𝐑𝑖subscript𝐒𝐐⋅𝑖𝐐subscript𝐑𝑖{\bf S}_{i}=\frac{1}{\sqrt{N}}[{\bf S}_{{\bf Q}}\exp(i{\bf Q}\cdot{\bf R}_{i})+{\bf S}_{-{\bf Q}}\exp(-i{\bf Q}\cdot{\bf R}_{i})].

The condition (6) can be written as

N​S2𝑁superscript𝑆2\displaystyle NS^{2} =\displaystyle= 2β€‹π’πβ‹…π’βˆ’π+𝐒𝐐⋅𝐒𝐐​exp⁑[2​i​𝐐⋅𝐑i]β‹…2subscript𝐒𝐐subscript𝐒𝐐⋅subscript𝐒𝐐subscript𝐒𝐐⋅2𝑖𝐐subscript𝐑𝑖\displaystyle 2{\bf S}_{{\bf Q}}\cdot{\bf S}_{-{\bf Q}}+{\bf S}_{{\bf Q}}\cdot{\bf S}_{{\bf Q}}\exp[2i{\bf Q}\cdot{\bf R}_{i}]
+\displaystyle+ π’βˆ’πβ‹…π’βˆ’πβ€‹exp⁑[βˆ’2​i​𝐐⋅𝐑i],β‹…subscript𝐒𝐐subscript𝐒𝐐⋅2𝑖𝐐subscript𝐑𝑖\displaystyle{\bf S}_{-{\bf Q}}\cdot{\bf S}_{-{\bf Q}}\exp[-2i{\bf Q}\cdot{\bf R}_{i}],

for any 𝐑isubscript𝐑𝑖{\bf R}_{i}. This indicates that

𝐒𝐐⋅𝐒𝐐=0.β‹…subscript𝐒𝐐subscript𝐒𝐐0{\bf S}_{{\bf Q}}\cdot{\bf S}_{{\bf Q}}=0. (7)

Here we assume that

𝐒𝐐=𝐑𝐐+i​I𝐐,subscript𝐒𝐐subscript𝐑𝐐𝑖subscript𝐼𝐐\displaystyle{\bf S}_{{\bf Q}}={\bf R}_{{\bf Q}}+iI_{{\bf Q}},
π’βˆ’π=π‘πβˆ’i​I𝐐,subscript𝐒𝐐subscript𝐑𝐐𝑖subscript𝐼𝐐\displaystyle{\bf S}_{-{\bf Q}}={\bf R}_{{\bf Q}}-iI_{{\bf Q}},

where RQ and 𝐈Qsubscriptπˆπ‘„{\bf I}_{Q} are real vectors.

π’πβ‹…π’βˆ’πβ‹…subscript𝐒𝐐subscript𝐒𝐐\displaystyle{\bf S}_{{\bf Q}}\cdot{\bf S}_{-{\bf Q}} =\displaystyle= (𝐑𝐐+iβ€‹πˆπ)β‹…(π‘πβˆ’iβ€‹πˆπ)β‹…subscript𝐑𝐐𝑖subscript𝐈𝐐subscript𝐑𝐐𝑖subscript𝐈𝐐\displaystyle({\bf R}_{{\bf Q}}+i{\bf I}_{{\bf Q}})\cdot({\bf R}_{{\bf Q}}-i{\bf I}_{{\bf Q}})
=\displaystyle= 𝐑𝐐⋅𝐑𝐐+πˆπβ‹…πˆπβ‹…subscript𝐑𝐐subscript𝐑𝐐⋅subscript𝐈𝐐subscript𝐈𝐐\displaystyle{\bf R}_{{\bf Q}}\cdot{\bf R}_{{\bf Q}}+{\bf I}_{{\bf Q}}\cdot{\bf I}_{{\bf Q}}
𝐒𝐐⋅𝐒𝐐⋅subscript𝐒𝐐subscript𝐒𝐐\displaystyle{\bf S}_{{\bf Q}}\cdot{\bf S}_{{\bf Q}} =\displaystyle= (𝐑𝐐+iβ€‹πˆπ)β‹…(𝐑𝐐+iβ€‹πˆπ)β‹…subscript𝐑𝐐𝑖subscript𝐈𝐐subscript𝐑𝐐𝑖subscript𝐈𝐐\displaystyle({\bf R}_{{\bf Q}}+i{\bf I}_{{\bf Q}})\cdot({\bf R}_{{\bf Q}}+i{\bf I}_{{\bf Q}}) (8)
=\displaystyle= π‘πβ‹…π‘πβˆ’πˆπβ‹…I𝐐+2​i​Rπβ‹…πˆπ=0.β‹…subscript𝐑𝐐subscript𝐑𝐐⋅subscript𝐈𝐐subscript𝐼𝐐⋅2𝑖subscript𝑅𝐐subscript𝐈𝐐0\displaystyle{\bf R}_{{\bf Q}}\cdot{\bf R}_{{\bf Q}}-{\bf I}_{{\bf Q}}\cdot I_{{\bf Q}}+2iR_{{\bf Q}}\cdot{\bf I}_{{\bf Q}}=0.

Then we have

R𝐐=I𝐐subscript𝑅𝐐subscript𝐼𝐐\displaystyle R_{{\bf Q}}=I_{{\bf Q}}
π‘πβ‹…πˆπ=0.β‹…subscript𝐑𝐐subscript𝐈𝐐0\displaystyle{\bf R}_{{\bf Q}}\cdot{\bf I}_{{\bf Q}}=0.

Then the vector 𝐑𝐐subscript𝐑𝐐{\bf R}_{{\bf Q}} is perpendicular to the vector 𝐈𝐐subscript𝐈𝐐{\bf I}_{{\bf Q}}, and the magnitude R𝐐subscript𝑅𝐐R_{{\bf Q}} is the same as the magnitude I𝐐subscript𝐼𝐐I_{{\bf Q}}. From Eq.(8), we get

R𝐐2=I𝐐2=14​N​S2.superscriptsubscript𝑅𝐐2superscriptsubscript𝐼𝐐214𝑁superscript𝑆2R_{{\bf Q}}^{2}=I_{{\bf Q}}^{2}=\frac{1}{4}NS^{2}.

The minimum energy Em​i​nsubscriptπΈπ‘šπ‘–π‘›E_{min} is obtained as

Em​i​n=βˆ’N​S2​J​(𝐐).subscriptπΈπ‘šπ‘–π‘›π‘superscript𝑆2𝐽𝐐E_{min}=-NS^{2}J({\bf Q}). (9)

The spin vector is expressed by

𝐒isubscript𝐒𝑖\displaystyle{\bf S}_{i} =\displaystyle= 1N[(𝐑𝐐+i𝐈𝐐)exp(i𝐐⋅𝐑i)\displaystyle\frac{1}{\sqrt{N}}[({\bf R}_{{\bf Q}}+i{\bf I}_{{\bf Q}})\exp(i{\bf Q}\cdot{\bf R}_{i})
+\displaystyle+ (π‘πβˆ’i𝐈𝐐)exp(βˆ’i𝐐⋅𝐑i)]\displaystyle({\bf R}_{{\bf Q}}-i{\bf I}_{{\bf Q}})\exp(-i{\bf Q}\cdot{\bf R}_{i})]
=\displaystyle= 2N[(𝐑𝐐cos(𝐐⋅𝐑i)βˆ’I𝐐sin(𝐐⋅𝐑i)]\displaystyle\frac{2}{\sqrt{N}}[({\bf R}_{{\bf Q}}\cos({\bf Q}\cdot{\bf R}_{i})-I_{{\bf Q}}\sin({\bf Q}\cdot{\bf R}_{i})]
=\displaystyle= S[(𝐑^𝐐cos(𝐐⋅𝐑i)βˆ’πˆ^𝐐sin(𝐐⋅𝐑i)],\displaystyle S[({\bf\hat{R}}_{{\bf Q}}\cos({\bf Q}\cdot{\bf R}_{i})-{\bf\hat{I}}_{{\bf Q}}\sin({\bf Q}\cdot{\bf R}_{i})],

where 𝐑^𝐐subscript^𝐑𝐐{\bf\hat{R}}_{{\bf Q}} and 𝐈^𝐐subscript^𝐈𝐐{\bf\hat{I}}_{{\bf Q}} are the unit vectors which are perpendicular to each other. For convenience, 𝐑^𝐐subscript^𝐑𝐐{\bf\hat{R}}_{{\bf Q}} and 𝐈^𝐐subscript^𝐈𝐐{\bf\hat{I}}_{{\bf Q}} are in the xπ‘₯x-y𝑦y plane. The z𝑧z axis is perpendicular to the xπ‘₯x-y𝑦y plane. Then using the unit vectors 𝐞xsubscript𝐞π‘₯{\bf e}_{x} and 𝐞ysubscriptπžπ‘¦{\bf e}_{y}, we get the final result

𝐒i=S​[cos⁑(𝐐⋅𝐑i+Ο•)β€‹πžx+sin⁑(𝐐⋅𝐑i+Ο•)β€‹πžy],subscript𝐒𝑖𝑆delimited-[]⋅𝐐subscript𝐑𝑖italic-Ο•subscript𝐞π‘₯⋅𝐐subscript𝐑𝑖italic-Ο•subscriptπžπ‘¦{\bf S}_{i}=S[\cos({\bf Q}\cdot{\bf R}_{i}+\phi){\bf e}_{x}+\sin({\bf Q}\cdot{\bf R}_{i}+\phi){\bf e}_{y}], (10)

where Ο•italic-Ο•\phi is the angle between 𝐑^𝐐subscript^𝐑𝐐{\bf\hat{R}}_{{\bf Q}} and xπ‘₯x axis.

The spin structure thus derived is the most fundamental spin structure and is realized as a result of the minimum energy state in the classical spin system. The ferromagnetic state (𝐐=0𝐐0{\bf Q}=0) and antiferromagnetic state (Q = the zone boundary of the first Brillouin zone) are the special case of the spin structures. In general, Q is not related to the crystal structure, but is related to the details of the exchange interactions.

III Helical spin order for β𝛽\beta-MnO2subscriptMnO2\text{MnO}_{2}

III.1 Calculation of J​(πͺ)𝐽πͺJ({\bf q}) for β𝛽\beta-MnO2

Refer to caption
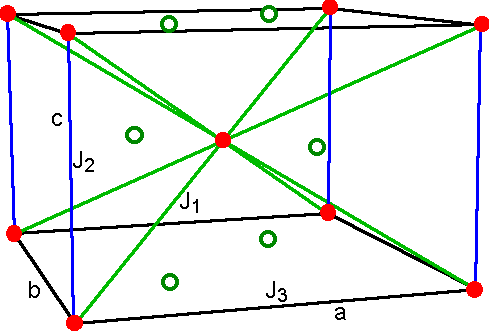
Figure 1: (Color online) The position of Mn4+ ions (denoted by solid circles) and O2- (denoted by open circles) in β𝛽\beta-MnO2 (rutile-type structure, space group P42/mmm). a=b=4.396β€‹Γ…π‘Žπ‘4.396italic-Γ…a=b=4.396\AA. c=2.871​Å𝑐2.871italic-Γ…c=2.871\AA. J1subscript𝐽1J_{1}, J2subscript𝐽2J_{2}, and J3subscript𝐽3J_{3} are the exchange interactions between Mn2+ spins. One of the O atom is located at (u​a,u​a)π‘’π‘Žπ‘’π‘Ž(ua,ua), where u=0.302𝑒0.302u=0.302.

Figure 1 shows the structure (rutile) of β𝛽\beta-MnO2 where a=b=4.396β€‹Γ…π‘Žπ‘4.396italic-Γ…a=b=4.396\AA, c=2.871​Å𝑐2.871italic-Γ…c=2.871\AA, and u=0.302𝑒0.302u=0.302.ref08 The exchange interactions J1subscript𝐽1J_{1}, J2subscript𝐽2J_{2}, and J3subscript𝐽3J_{3} are defined by Fig.Β 1. The definition of J1subscript𝐽1J_{1}, J2subscript𝐽2J_{2}, and J3subscript𝐽3J_{3} are the same as that used by Yoshimori. The NΓ©el temperature TNsubscript𝑇𝑁T_{N} is equal to 92 K. Each Mn4+ ion and surrounding six O2- ions form a cation-occupied deformed octahedron (see Sec.Β X).

Here we calculate J​(πͺ)𝐽πͺJ({\bf q}) for MnO2, where the wavenumber q, the lattice vectors πšβ€‹(n)πšπ‘›{\bf a}(n) (n𝑛n = 1, 2,…, 4) and c are given by

πͺπͺ\displaystyle{\bf q} =\displaystyle= (qx,qy,qz),subscriptπ‘žπ‘₯subscriptπ‘žπ‘¦subscriptπ‘žπ‘§\displaystyle(q_{x},q_{y},q_{z}),
πšβ€‹(n)πšπ‘›\displaystyle{\bf a}(n) =\displaystyle= a​cos⁑[Ο€2​(nβˆ’1)],a​sin⁑[Ο€2​(nβˆ’1)],0,π‘Žπœ‹2𝑛1π‘Žπœ‹2𝑛10\displaystyle{a\cos[\frac{\pi}{2}(n-1)],a\sin[\frac{\pi}{2}(n-1)],0},
𝐜𝐜\displaystyle{\bf c} =\displaystyle= (0,0,c).00𝑐\displaystyle(0,0,c).

Then the expression of J​(πͺ)𝐽πͺJ({\bf q}) is given by

J​(πͺ)𝐽πͺ\displaystyle J({\bf q}) =\displaystyle= J1​exp⁑[i​πͺβ‹…πœ+πšβ€‹(1)+πšβ€‹(2)2]+J1​exp⁑[i​πͺβ‹…βˆ’πœ+πšβ€‹(1)+πšβ€‹(2)2]subscript𝐽1⋅𝑖πͺ𝐜𝐚1𝐚22subscript𝐽1⋅𝑖πͺ𝐜𝐚1𝐚22\displaystyle J_{1}\exp[i{\bf q}\cdot\frac{{\bf c}+{\bf a}(1)+{\bf a}(2)}{2}]+J_{1}\exp[i{\bf q}\cdot\frac{-{\bf c}+{\bf a}(1)+{\bf a}(2)}{2}]
+J1​exp⁑[i​πͺβ‹…πœ+πšβ€‹(2)+πšβ€‹(3)2]+J1​exp⁑[i​πͺβ‹…βˆ’πœ+πšβ€‹(2)+πšβ€‹(3)2]subscript𝐽1⋅𝑖πͺ𝐜𝐚2𝐚32subscript𝐽1⋅𝑖πͺ𝐜𝐚2𝐚32\displaystyle+J_{1}\exp[i{\bf q}\cdot\frac{{\bf c}+{\bf a}(2)+{\bf a}(3)}{2}]+J_{1}\exp[i{\bf q}\cdot\frac{-{\bf c}+{\bf a}(2)+{\bf a}(3)}{2}]
+J1​exp⁑[i​πͺβ‹…πœ+πšβ€‹(3)+πšβ€‹(4)2]+J1​exp⁑[i​πͺβ‹…βˆ’πœ+πšβ€‹(3)+πšβ€‹(4)2]subscript𝐽1⋅𝑖πͺ𝐜𝐚3𝐚42subscript𝐽1⋅𝑖πͺ𝐜𝐚3𝐚42\displaystyle+J_{1}\exp[i{\bf q}\cdot\frac{{\bf c}+{\bf a}(3)+{\bf a}(4)}{2}]+J_{1}\exp[i{\bf q}\cdot\frac{-{\bf c}+{\bf a}(3)+{\bf a}(4)}{2}]
+J1​exp⁑[i​πͺβ‹…πœ+πšβ€‹(4)+πšβ€‹(1)2]+J1​exp⁑[i​πͺβ‹…βˆ’πœ+πšβ€‹(4)+πšβ€‹(1)2]subscript𝐽1⋅𝑖πͺ𝐜𝐚4𝐚12subscript𝐽1⋅𝑖πͺ𝐜𝐚4𝐚12\displaystyle+J_{1}\exp[i{\bf q}\cdot\frac{{\bf c}+{\bf a}(4)+{\bf a}(1)}{2}]+J_{1}\exp[i{\bf q}\cdot\frac{-{\bf c}+{\bf a}(4)+{\bf a}(1)}{2}]
+J2​exp⁑[i​πͺβ‹…πœ]+J2​exp⁑[βˆ’i​πͺβ‹…πœ]subscript𝐽2⋅𝑖πͺ𝐜subscript𝐽2⋅𝑖πͺ𝐜\displaystyle+J_{2}\exp[i{\bf q}\cdot{\bf c}]+J_{2}\exp[-i{\bf q}\cdot{\bf c}]
+J3​exp⁑[i​πͺβ‹…πšβ€‹(1)]+J3​exp⁑[βˆ’i​πͺβ‹…πšβ€‹(1)]+J3​exp⁑[i​πͺβ‹…πšβ€‹(2)]+J3​exp⁑[βˆ’i​πͺβ‹…πšβ€‹(2)].subscript𝐽3⋅𝑖πͺ𝐚1subscript𝐽3⋅𝑖πͺ𝐚1subscript𝐽3⋅𝑖πͺ𝐚2subscript𝐽3⋅𝑖πͺ𝐚2\displaystyle+J_{3}\exp[i{\bf q}\cdot{\bf a}(1)]+J_{3}\exp[-i{\bf q}\cdot{\bf a}(1)]+J_{3}\exp[i{\bf q}\cdot{\bf a}(2)]+J_{3}\exp[-i{\bf q}\cdot{\bf a}(2)].

Then J​(πͺ)𝐽πͺJ({\bf q}) can be rewritten as

J​(πͺ)𝐽πͺ\displaystyle J({\bf q}) =\displaystyle= J​(h,k,l)=8​J1​cos⁑(π​h)​cos⁑(π​k)​cos⁑(π​l)π½β„Žπ‘˜π‘™8subscript𝐽1πœ‹β„Žπœ‹π‘˜πœ‹π‘™\displaystyle J(h,k,l)=8J_{1}\cos(\pi h)\cos(\pi k)\cos(\pi l)
+\displaystyle+ 2​J2​cos⁑(2​π​l)+2​J3​[cos⁑(2​π​h)+cos⁑(2​π​k)],2subscript𝐽22πœ‹π‘™2subscript𝐽3delimited-[]2πœ‹β„Ž2πœ‹π‘˜\displaystyle 2J_{2}\cos(2\pi l)+2J_{3}[\cos(2\pi h)+\cos(2\pi k)],

where

qx=(2​πa)​h=aβˆ—β€‹h, ​qy=(2​πa)​k=aβˆ—β€‹k, ​qz=(2​πc)​l=cβˆ—β€‹lformulae-sequencesubscriptπ‘žπ‘₯2πœ‹π‘Žβ„Žsuperscriptπ‘Žβ„ŽΒ subscriptπ‘žπ‘¦2πœ‹π‘Žπ‘˜superscriptπ‘Žπ‘˜Β subscriptπ‘žπ‘§2πœ‹π‘π‘™superscript𝑐𝑙q_{x}=(\frac{2\pi}{a})h=a^{*}h,\text{ }q_{y}=(\frac{2\pi}{a})k=a^{*}k,\text{ }q_{z}=(\frac{2\pi}{c})l=c^{*}l

with hβ„Žh, kπ‘˜k, and l𝑙l being dimensionless numbers and aβˆ—superscriptπ‘Ža^{*} and cβˆ—superscript𝑐c^{*} being reciprocal lattice constants.

III.2 Mathematica programs used in the present work

In order to determine the magnetic Bragg peaks in the reciprocal lattice plane, we use the following three Mathematica programs, ContourPlot for the equi-energy contour plot, FindMaximum for finding maximum, and ListVectorPlot3D for drawing the spin directions in the lattice points of the real space.

III.2.1 Contour plot program

This program is used to determine the overview on the positions of the magnetic Bragg peaks in the (h,k,l)β„Žπ‘˜π‘™(h,k,l) reciprocal lattice plane, where one of hβ„Žh, kπ‘˜k, and l𝑙l are fixed. When the values of J1subscript𝐽1J_{1}, J2subscript𝐽2J_{2}, and J3subscript𝐽3J_{3} are given, using the Mathematica program [ContourPlot], we can make a plot of the contours of J​(h,k,l)=aπ½β„Žπ‘˜π‘™π‘ŽJ(h,k,l)=a (constant) in the (h,k,l)β„Žπ‘˜π‘™(h,k,l) plane, where the parameter aπ‘Ža is changed appropriately such that the maximum value of J​(h,k,l)π½β„Žπ‘˜π‘™J(h,k,l) is obtained. This program is very useful to find the selection rule for the position of the magnetic Bragg peaks, as a function of J1subscript𝐽1J_{1}, J2subscript𝐽2J_{2}, and J3subscript𝐽3J_{3}.

III.2.2 Finding maximum program

This program is used to determine the exact position of the magnetic Bragg peak in the (h,k,l)β„Žπ‘˜π‘™(h,k,l) reciprocal lattice plane, where one of hβ„Žh, kπ‘˜k, and l𝑙l are fixed. For convenience, here we assume that l𝑙l is fixed such that l𝑙l = 0. Using the Mathematica program [FindMaximum], we find the maximum value of J​(h,k,l)π½β„Žπ‘˜π‘™J(h,k,l) for given J2subscript𝐽2J_{2} and J3subscript𝐽3J_{3}, where J1subscript𝐽1J_{1} (= -1) is fixed, and the regions of hβ„Žh and kπ‘˜k are appropriately chosen. This program is very convenient when one wants to know how the position of the Bragg point changes as a function of J2subscript𝐽2J_{2} and J3subscript𝐽3J_{3}.

III.2.3 ListVectorPlot3D program

This program is used to draw the spin directions at each lattice sites in the real space. The spin structure depends on the values of Q.

IV Selection rule for the magnetic Bragg peaks from simple analysis

IV.1 Distribution of magnetic Bragg peaks in the (hβ„Žh, kπ‘˜k, l𝑙l = fixed integer) reciprocal lattice plane

The magnetic Bragg peaks can be located at the wavevector q, where J​(h,k,l)π½β„Žπ‘˜π‘™J(h,k,l) takes a maximum. When l𝑙l = fixed integer, J​(h,k,l)π½β„Žπ‘˜π‘™J(h,k,l) is given by

J​(h,k,l)π½β„Žπ‘˜π‘™\displaystyle J(h,k,l) =\displaystyle= 8​J1​(βˆ’1)l​cos⁑(π​h)​cos⁑(π​k)8subscript𝐽1superscript1π‘™πœ‹β„Žπœ‹π‘˜\displaystyle 8J_{1}(-1)^{l}\cos(\pi h)\cos(\pi k)
+\displaystyle+ 2​J2+2​J3​[cos⁑(2​π​h)+cos⁑(2​π​k)],2subscript𝐽22subscript𝐽3delimited-[]2πœ‹β„Ž2πœ‹π‘˜\displaystyle 2J_{2}+2J_{3}[\cos(2\pi h)+\cos(2\pi k)],

suggesting that the location of the magnetic Bragg peaks in the (hβ„Žh, kπ‘˜k, l𝑙l = fixed integer) reciprocal lattice plane depends only on J1subscript𝐽1J_{1} and J3subscript𝐽3J_{3},and is independent of the J2subscript𝐽2J_{2}. The selection rule can be derived as follows.
(i) The distribution of the magnetic Bragg peaks is the same in the reciprocal lattice planes, (hβ„Žh, kπ‘˜k, 1), (hβ„Žh, kπ‘˜k, 3), (hβ„Žh, kπ‘˜k, 5), (hβ„Žh, kπ‘˜k, 7),…
(ii) The distribution of the magnetic Bragg peaks is the same in the reciprocal lattice planes , (hβ„Žh, kπ‘˜k, 0), (hβ„Žh, kπ‘˜k, 2), (hβ„Žh, kπ‘˜k, 4), (hβ„Žh, kπ‘˜k, 8),…

IV.2 Magnetic Bragg peaks along the l𝑙l direction with hβ„Žh = fixed integer and k=0π‘˜0k=0

When kπ‘˜k = 0 and hβ„Žh is a fixed integer, J𝐽J(hβ„Žh = fixed integer, kπ‘˜k = 0, l𝑙l) is rewritten as

J​(h,0,l)=8​(βˆ’1)h​J1​cos⁑(π​l)+2​J2​cos⁑(2​π​l)+2​J3,π½β„Ž0𝑙8superscript1β„Žsubscript𝐽1πœ‹π‘™2subscript𝐽22πœ‹π‘™2subscript𝐽3J(h,0,l)=8(-1)^{h}J_{1}\cos(\pi l)+2J_{2}\cos(2\pi l)+2J_{3},

which indicates that the location of the magnetic Bragg peaks along the (hβ„Žh = fixed integer, kπ‘˜k = 0, l𝑙l) direction depends only on J1subscript𝐽1J_{1} and J2subscript𝐽2J_{2}, and is independent of J3subscript𝐽3J_{3}. The following selection rules can be derived.
(i) The location of the magnetic Bragg peaks along the l𝑙l direction is the same for (1, 0, l𝑙l), (3, 0, l𝑙l), (5, 0, l𝑙l), (7, 0, l𝑙l), β‹―β‹―\cdots.
(ii) The location of the magnetic Bragg peaks along the l𝑙l direction is the same for (0, 0, l𝑙l), (2, 0, l𝑙l), (4, 0, l𝑙l), (8, 0, l𝑙l), β‹―β‹―\cdots.

IV.3 Magnetic Bragg peaks along the l𝑙l direction with h=k=β„Žπ‘˜absenth=k= half inetgers

For h=k=β„Žπ‘˜absenth=k= half-integer (= 1/2, 3/2, 5/2, β‹―β‹―\cdots), we have

J​(h,h,l)=2​J2​cos⁑(2​π​l)βˆ’4​J3,π½β„Žβ„Žπ‘™2subscript𝐽22πœ‹π‘™4subscript𝐽3J(h,h,l)=2J_{2}\cos(2\pi l)-4J_{3},

leading to the appearance of the magnetic Bragg peaks appear at

l=1/2,3/2,5/2,⋯𝑙123252β‹―l=1/2,3/2,5/2,\cdots

for h=k=1/2,3/2,5/2,7/2,β‹―formulae-sequenceβ„Žπ‘˜12325272β‹―h=k=1/2,3/2,5/2,7/2,\cdots .

IV.4 Magnetic Bragg peaks along the (0,0,l)00𝑙(0,0,l) direction

For any l𝑙l, J​(0,0,l)𝐽00𝑙J(0,0,l) can be expressed by

J​(h=0,k=0,l)=J​(ΞΈ)=8​J1​cos⁑(ΞΈ)+2​J2​cos⁑(2​θ)+4​J3.𝐽formulae-sequenceβ„Ž0π‘˜0π‘™π½πœƒ8subscript𝐽1πœƒ2subscript𝐽22πœƒ4subscript𝐽3J(h=0,k=0,l)=J(\theta)=8J_{1}\cos(\theta)+2J_{2}\cos(2\theta)+4J_{3}.

with ΞΈ=π​lπœƒπœ‹π‘™\theta=\pi l . This indicates that the location of the magnetic Bragg peaks along the (0,0,l)00𝑙(0,0,l) direction, is independent of J3subscript𝐽3J_{3}. The derivative of J​(0,0,l)𝐽00𝑙J(0,0,l) with respect to ΞΈπœƒ\theta is obtained as

d​J​(ΞΈ)d​θ=βˆ’4​[J1+J2​cos⁑(ΞΈ)]​sin⁑(ΞΈ)=0.π‘‘π½πœƒπ‘‘πœƒ4delimited-[]subscript𝐽1subscript𝐽2πœƒπœƒ0\frac{dJ(\theta)}{d\theta}=-4[J_{1}+J_{2}\cos(\theta)]\sin(\theta)=0.

Then we get the two solutions.
(i) Ferromagnetic or antiferromagnetic configurations

sin⁑θ=0, ​θ=0,Ο€.formulae-sequenceπœƒ0Β πœƒ0πœ‹\sin\theta=0,\text{ }\theta=0,\pi.

where

J​(ΞΈ=0)π½πœƒ0\displaystyle J(\theta=0) =\displaystyle= 8​J1+2​J2+4​J38subscript𝐽12subscript𝐽24subscript𝐽3\displaystyle 8J_{1}+2J_{2}+4J_{3}
J​(ΞΈ=Ο€)π½πœƒπœ‹\displaystyle J(\theta=\pi) =\displaystyle= βˆ’8​J1+2​J2+4​J3.8subscript𝐽12subscript𝐽24subscript𝐽3\displaystyle-8J_{1}+2J_{2}+4J_{3}.

(ii) Helical spin configuration

cos⁑θ=βˆ’J1/J2,ΞΈ=ΞΈ0=arccos⁑(βˆ’J1/J2),formulae-sequenceπœƒsubscript𝐽1subscript𝐽2πœƒsubscriptπœƒ0subscript𝐽1subscript𝐽2\cos\theta=-J_{1}/J_{2},\theta=\theta_{0}=\arccos(-J_{1}/J_{2}),

under the condition of |J1/J2|<1subscript𝐽1subscript𝐽21\left|J_{1}/J_{2}\right|<1, where

J​(ΞΈ=ΞΈ0)=βˆ’4​J12J2βˆ’2​J2+4​J3.π½πœƒsubscriptπœƒ04superscriptsubscript𝐽12subscript𝐽22subscript𝐽24subscript𝐽3J(\theta=\theta_{0})=-4\frac{J_{1}^{2}}{J_{2}}-2J_{2}+4J_{3}.

The difference is calculated as

J(ΞΈ\displaystyle J(\theta =\displaystyle= ΞΈ0)βˆ’J(ΞΈ=Ο€)=βˆ’4J2(J1J2βˆ’1)2,\displaystyle\theta_{0})-J(\theta=\pi)=-4J_{2}(\frac{J_{1}}{J_{2}}-1)^{2},
J(ΞΈ\displaystyle J(\theta =\displaystyle= ΞΈ0)βˆ’J(ΞΈ=0)=βˆ’4J2(J1J2+1)2.\displaystyle\theta_{0})-J(\theta=0)=-4J_{2}(\frac{J_{1}}{J_{2}}+1)^{2}.

Then the helical spin order appears when

J​(ΞΈ=ΞΈ0)>J​(ΞΈ=Ο€),π½πœƒsubscriptπœƒ0π½πœƒπœ‹\displaystyle J(\theta=\theta_{0})>J(\theta=\pi),
J​(ΞΈ=ΞΈ0)>J​(ΞΈ=0).π½πœƒsubscriptπœƒ0π½πœƒ0\displaystyle J(\theta=\theta_{0})>J(\theta=0).

If the conditions J2<0subscript𝐽20J_{2}<0 and |J1/J2|<1subscript𝐽1subscript𝐽21\left|J_{1}/J_{2}\right|<1 are satisfied, the magnetic Bragg peaks appear at the wavevectors denoted by

(h,k,l)=(0,0,1Β±Ο΅),(0,0,3Β±Ο΅),(0,0,5Β±Ο΅),(0,0,7Β±Ο΅),β‹―,β„Žπ‘˜π‘™00plus-or-minus1italic-Ο΅00plus-or-minus3italic-Ο΅00plus-or-minus5italic-Ο΅00plus-or-minus7italic-Ο΅β‹―(h,k,l)=(0,0,1\pm\epsilon),(0,0,3\pm\epsilon),(0,0,5\pm\epsilon),(0,0,7\pm\epsilon),\cdots,

where Ο΅italic-Ο΅\epsilon is defined as

cos⁑(π​ϡ)=J1J2.πœ‹italic-Ο΅subscript𝐽1subscript𝐽2\cos(\pi\epsilon)=\frac{J_{1}}{J_{2}}.

IV.5 Magnetic Bragg peaks along the (h,0,0)β„Ž00(h,0,0) direction

J(h,k=0,l=0)J(h,k=0,l=0) and its derivative are given by

J(h,k=0,l=0)=8J1cos(Ο€h)+2J3cos(2Ο€h)+2J2+2J3,J(h,k=0,l=0)=8J_{1}\cos(\pi h)+2J_{3}\cos(2\pi h)+2J_{2}+2J_{3},

and

dJ(h,k=0,l=0)d​h=8​π​[J1βˆ’J3​cos⁑(π​h)]​sin⁑(π​h),\frac{dJ(h,k=0,l=0)}{dh}=8\pi[J_{1}-J_{3}\cos(\pi h)]\sin(\pi h),

respectively. Since |J1/J3|>1subscript𝐽1subscript𝐽31\left|J_{1}/J_{3}\right|>1 in MnO2, we have only sin⁑(π​h)=0πœ‹β„Ž0\sin(\pi h)=0. Since J1<0subscript𝐽10J_{1}<0, we have the following selection rule. The magnetic Bragg appears only at

(1,0,0),(3,0,0),(5,0,0),(7,0,0),β‹―100300500700β‹―(1,0,0),(3,0,0),(5,0,0),(7,0,0),\cdots

along the hβ„Žh-direction.

V Determination of J2subscript𝐽2J_{2} and J3subscript𝐽3J_{3} from experimental data on β𝛽\beta-MnO2subscriptMnO2\text{MnO}_{2}

V.1 The ratio J2/J1subscript𝐽2subscript𝐽1J_{2}/J_{1}

Refer to caption
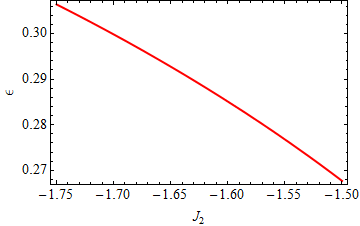
Figure 2: (Color online) Plot of Ο΅italic-Ο΅\epsilon as a function of J2subscript𝐽2J_{2}. J1=βˆ’1subscript𝐽11J_{1}=-1

We now calculate the value of Ο΅italic-Ο΅\epsilon, at which J​(h=1,k=0,l=2+Ο΅)𝐽formulae-sequenceβ„Ž1formulae-sequenceπ‘˜0𝑙2italic-Ο΅J(h=1,k=0,l=2+\epsilon) takes a maximum, as a function of J2subscript𝐽2J_{2}, where J1=βˆ’1subscript𝐽11J_{1}=-1. The value of Ο΅italic-Ο΅\epsilon is uniquely determined as a function J2subscript𝐽2J_{2} as shown in Fig.Β 2. When J2=βˆ’1.6039subscript𝐽21.6039J_{2}=-1.6039, we find Ο΅=2/7italic-Ο΅27\epsilon=2/7 (Yoshimoriref02 ).

Experimentally, the magnetic Bragg peak is observed at (h=1,k=0,l=2.29771)formulae-sequenceβ„Ž1formulae-sequenceπ‘˜0𝑙2.29771(h=1,k=0,l=2.29771) for β𝛽\beta-MnO2. Here we note that l=2.29771=2+ϡ𝑙2.297712italic-Ο΅l=2.29771=2+\epsilon, where Ο΅=2/7+0.0120italic-Ο΅270.0120\epsilon=2/7+0.0120. The value of l𝑙l is slightly deviated from the value of 2 + 2/7, which is predicted by Yoshimori.ref02 J​(h=1,k=0,l)𝐽formulae-sequenceβ„Ž1π‘˜0𝑙J(h=1,k=0,l) and its derivative are given by

J​(h=1,k=0,l)=βˆ’8​J1​cos⁑(π​l)+2​J2​cos⁑(2​π​l)+4​J3,𝐽formulae-sequenceβ„Ž1π‘˜0𝑙8subscript𝐽1πœ‹π‘™2subscript𝐽22πœ‹π‘™4subscript𝐽3J(h=1,k=0,l)=-8J_{1}\cos(\pi l)+2J_{2}\cos(2\pi l)+4J_{3},

and

J​(h=1,k=0,l)d​l=4​π​[2​J1​sin⁑(π​l)βˆ’J2​sin⁑(2​π​l)],𝐽formulae-sequenceβ„Ž1π‘˜0𝑙𝑑𝑙4πœ‹delimited-[]2subscript𝐽1πœ‹π‘™subscript𝐽22πœ‹π‘™\frac{J(h=1,k=0,l)}{dl}=4\pi[2J_{1}\sin(\pi l)-J_{2}\sin(2\pi l)],

respectively. J​(h=1,k=0,l)𝐽formulae-sequenceβ„Ž1π‘˜0𝑙J(h=1,k=0,l) has a maximum when

cos⁑(π​l)=J1J2.πœ‹π‘™subscript𝐽1subscript𝐽2\cos(\pi l)=\frac{J_{1}}{J_{2}}.

or

l=0Β±Ο΅,2Β±Ο΅,4Β±Ο΅,6Β±Ο΅,β‹―,𝑙plus-or-minus0italic-Ο΅plus-or-minus2italic-Ο΅plus-or-minus4italic-Ο΅plus-or-minus6italic-Ο΅β‹―l=0\pm\epsilon,2\pm\epsilon,4\pm\epsilon,6\pm\epsilon,\cdots,

where

cos⁑(π​ϡ)=J1J2.πœ‹italic-Ο΅subscript𝐽1subscript𝐽2\cos(\pi\epsilon)=\frac{J_{1}}{J_{2}}.

Since the magnetic Bragg peak appears at l=2.29771𝑙2.29771l=2.29771, we have

J2J1=1.68469,subscript𝐽2subscript𝐽11.68469\frac{J_{2}}{J_{1}}=1.68469,

indicating that J2<0subscript𝐽20J_{2}<0 since J1<0subscript𝐽10J_{1}<0.

V.2 Ratio p3=J3/J1subscript𝑝3subscript𝐽3subscript𝐽1p_{3}=J_{3}/J_{1}

Refer to caption
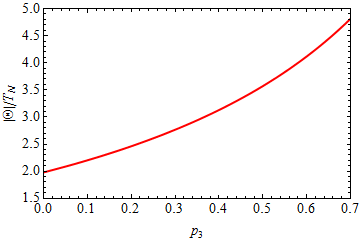
Figure 3: (Color online) Plot of |Θ|/TNΘsubscript𝑇𝑁\left|\Theta\right|/T_{N} as a function of p3subscript𝑝3p_{3}, where p2=1.68469subscript𝑝21.68469p_{2}=1.68469.

The ratio J3/J1subscript𝐽3subscript𝐽1J_{3}/J_{1} cannot be determined uniquely from the experimental results on the magnetic neutron scattering or x-ray magnetic scattering. The ratio |Θ|/TNΘsubscript𝑇𝑁\left|\Theta\right|/T_{N} can be calculated as

|Θ|TN=J​(0)J​(ΞΈ0)=4+p2+2​p32p2+p2βˆ’2​p3,Θsubscript𝑇𝑁𝐽0𝐽subscriptπœƒ04subscript𝑝22subscript𝑝32subscript𝑝2subscript𝑝22subscript𝑝3\frac{\left|\Theta\right|}{T_{N}}=\frac{J(0)}{J(\theta_{0})}=\frac{4+p_{2}+2p_{3}}{\frac{2}{p_{2}}+p_{2}-2p_{3}}, (13)

where p2=J2/J1subscript𝑝2subscript𝐽2subscript𝐽1p_{2}=J_{2}/J_{1}, p3=J3/J1subscript𝑝3subscript𝐽3subscript𝐽1p_{3}=J_{3}/J_{1}, ΘΘ\Theta is the Curie-Weiss temperature (the value is negative for β𝛽\beta-MnO2) and TNsubscript𝑇𝑁T_{N} is the NΓ©el temperature. The value of p3subscript𝑝3p_{3} can be determined from the ratio |Θ|/TNΘsubscript𝑇𝑁\left|\Theta\right|/T_{N} since p2subscript𝑝2p_{2} is already determined. We make a plot of |Θ|/TNΘsubscript𝑇𝑁\left|\Theta\right|/T_{N} as a function of p3subscript𝑝3p_{3} in Fig.Β 3, where p2=1.68469subscript𝑝21.68469p_{2}=1.68469.

As far as we know, there have been several reports on the experimental values of ΘΘ\Theta and TNsubscript𝑇𝑁T_{N} for β𝛽\beta-MnO2; Θ=βˆ’316Θ316\Theta=-316 K, TN=84subscript𝑇𝑁84T_{N}=84 K [Bizette and B. Tsai (1949)],ref10 Θ=βˆ’1050Θ1050\Theta=-1050 K, TN=92subscript𝑇𝑁92T_{N}=92 K [Ohama and Hamaguchi (1971)],ref03 Θ=βˆ’783Θ783\Theta=-783 K, TN=92subscript𝑇𝑁92T_{N}=92 K [Sato et al.(2000)],ref08 respectively. Using the values of TNsubscript𝑇𝑁T_{N}, ΘΘ\Theta and the value of p2subscript𝑝2p_{2} (= 1.68469) determined above, the value of p3subscript𝑝3p_{3} can be calculated as p3subscript𝑝3p_{3} = 0.537, 0.986, 1.091 using the data of Bizette and Tsai,ref10 Sato et al.,ref08 and Ohama and Hamaguchi,ref03 respectively.

We note that the boundary of the helical phase is described by (the derivation will be shown later)

p3=1/p2​ or ​J2​J3=J12.subscript𝑝31subscript𝑝2Β orΒ subscript𝐽2subscript𝐽3superscriptsubscript𝐽12p_{3}=1/p_{2}\text{ or }J_{2}J_{3}=J_{1}^{2}. (14)

The helical order can exist only when p3<1/p2subscript𝑝31subscript𝑝2p_{3}<1/p_{2}. When p2=1.68469subscript𝑝21.68469p_{2}=1.68469 for MnO2, p3subscript𝑝3p_{3} should be lower than 0.5935. In other words, the ratio |Θ|/TNΘsubscript𝑇𝑁\left|\Theta\right|/T_{N} should be lower than 4.07853. Since TN=92subscript𝑇𝑁92T_{N}=92 K, this means that |Θ|Θ\left|\Theta\right| should be smaller than 375.2 K. The value of |Θ|Θ\left|\Theta\right| by Bizette and Tsai seems to be reasonable, while the values of |Θ|Θ\left|\Theta\right| obtained by Sato et al.ref08 and Ohama and Hamaguchiref03 are much higher than 375.2 K. Note that Yoshimoriref02 predicts that the boundary is described by p3​p2=1/2subscript𝑝3subscript𝑝212p_{3}p_{2}=1/2. This expression is not correct according to our calculation.

VI Numerical calculation

VI.1 The contour plot of J​(h,0,l)π½β„Ž0𝑙J(h,0,l) in the (h,0,l)β„Ž0𝑙(h,0,l) reciprocal lattice plane

Refer to caption
Refer to caption
Refer to caption
Refer to caption
Refer to caption
Refer to caption
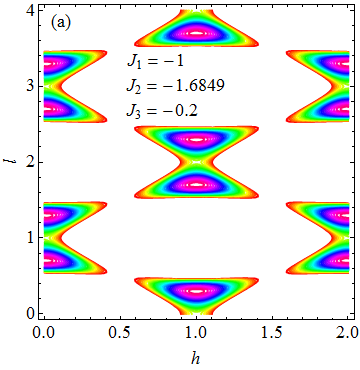
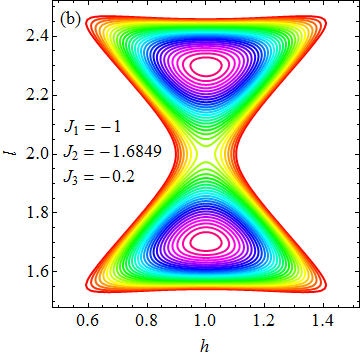
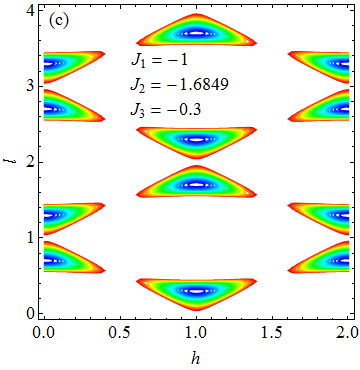
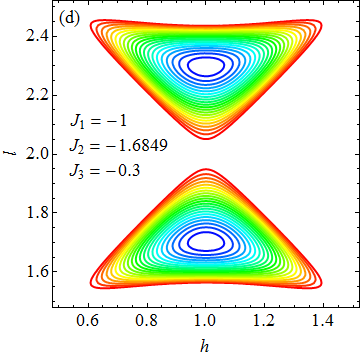
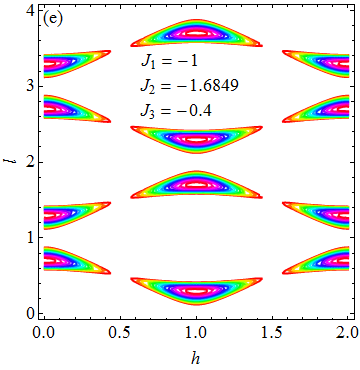
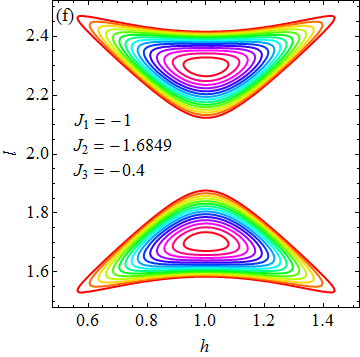
Figure 4: (Color online) (a)(b) Distribution of magnetic Bragg points in the (h,k=0,l)formulae-sequenceβ„Žπ‘˜0𝑙(h,k=0,l) reciprocal lattice plane. J1=βˆ’1subscript𝐽11J_{1}=-1, J2=βˆ’1.68469subscript𝐽21.68469J_{2}=-1.68469. J3=βˆ’0.2subscript𝐽30.2J_{3}=-0.2. p3=J3/J1=0.2subscript𝑝3subscript𝐽3subscript𝐽10.2p_{3}=J_{3}/J_{1}=0.2. (c)(d) Distribution of magnetic Bragg points in the (h,k=0,l)formulae-sequenceβ„Žπ‘˜0𝑙(h,k=0,l) reciprocal lattice plane. J1=βˆ’1subscript𝐽11J_{1}=-1, J2=βˆ’1.68469subscript𝐽21.68469J_{2}=-1.68469. J3=βˆ’0.3subscript𝐽30.3J_{3}=-0.3. p3=J3/J1=0.3subscript𝑝3subscript𝐽3subscript𝐽10.3p_{3}=J_{3}/J_{1}=0.3. (e)(f) Distribution of magnetic Bragg points in the (h,k=0,l)formulae-sequenceβ„Žπ‘˜0𝑙(h,k=0,l) reciprocal plane around h=1β„Ž1h=1 and l=2𝑙2l=2. J1=βˆ’1subscript𝐽11J_{1}=-1, J2=βˆ’1.68469subscript𝐽21.68469J_{2}=-1.68469. J3=βˆ’0.4subscript𝐽30.4J_{3}=-0.4. p3=J3/J1=0.4subscript𝑝3subscript𝐽3subscript𝐽10.4p_{3}=J_{3}/J_{1}=0.4.

Using the numerical calculation of the contour plot using the Mathematica, we find the location of the magnetic Bragg peaks in the (h,0,l)β„Ž0𝑙(h,0,l) reciprocal lattice, where

J​(h,0,l)π½β„Ž0𝑙\displaystyle J(h,0,l) =\displaystyle= 8​J1​cos⁑(π​h)​cos⁑(π​l)8subscript𝐽1πœ‹β„Žπœ‹π‘™\displaystyle 8J_{1}\cos(\pi h)\cos(\pi l)
+\displaystyle+ 2​J2​cos⁑(2​π​l)+2​J3​[cos⁑(2​π​h)+1],2subscript𝐽22πœ‹π‘™2subscript𝐽3delimited-[]2πœ‹β„Ž1\displaystyle 2J_{2}\cos(2\pi l)+2J_{3}[\cos(2\pi h)+1],

takes a maximum, where J1=βˆ’1subscript𝐽11J_{1}=-1, J2=p2​J1=βˆ’1.68469subscript𝐽2subscript𝑝2subscript𝐽11.68469J_{2}=p_{2}J_{1}=-1.68469. Figures 4(a)-(f) show the contour plot of J​(h,0,l)π½β„Ž0𝑙J(h,0,l) in the reciprocal lattice plane of (h,0,l)β„Ž0𝑙(h,0,l), where J3=p3​J1subscript𝐽3subscript𝑝3subscript𝐽1J_{3}=p_{3}J_{1} (p3<0.5935subscript𝑝30.5935p_{3}<0.5935) and J3subscript𝐽3J_{3} is changed as a parameter (J3=βˆ’0.2,βˆ’0.3,βˆ’0.4subscript𝐽30.20.30.4J_{3}=-0.2,-0.3,-0.4). As is predicted above, we find that the magnetic Bragg peaks appear at

(0,0,1Β±Ο΅),(0,0,3Β±Ο΅),(0,0,5Β±Ο΅),(0,0,7Β±Ο΅),…,00plus-or-minus1italic-Ο΅00plus-or-minus3italic-Ο΅00plus-or-minus5italic-Ο΅00plus-or-minus7italic-ϡ…\displaystyle(0,0,1\pm\epsilon),(0,0,3\pm\epsilon),(0,0,5\pm\epsilon),(0,0,7\pm\epsilon),\dots,
(1,0,0Β±Ο΅),(1,0,2Β±Ο΅),(1,0,4Β±Ο΅),(1,0,6Β±Ο΅),…,10plus-or-minus0italic-Ο΅10plus-or-minus2italic-Ο΅10plus-or-minus4italic-Ο΅10plus-or-minus6italic-ϡ…\displaystyle(1,0,0\pm\epsilon),(1,0,2\pm\epsilon),(1,0,4\pm\epsilon),(1,0,6\pm\epsilon),\dots,
(2,0,1Β±Ο΅),(2,0,3Β±Ο΅),(2,0,5Β±Ο΅),(2,0,7Β±Ο΅),…,20plus-or-minus1italic-Ο΅20plus-or-minus3italic-Ο΅20plus-or-minus5italic-Ο΅20plus-or-minus7italic-ϡ…\displaystyle(2,0,1\pm\epsilon),(2,0,3\pm\epsilon),(2,0,5\pm\epsilon),(2,0,7\pm\epsilon),\dots,

where Ο΅=0.29771italic-Ο΅0.29771\epsilon=0.29771 and is independent of p3subscript𝑝3p_{3} (p3<0.5935subscript𝑝30.5935p_{3}<0.5935). Note that the essential results are independent of the choice of p3subscript𝑝3p_{3} at least for 0.2≀p3≀0.40.2subscript𝑝30.40.2\leq p_{3}\leq 0.4.

VI.2 The contour plot of J(h,k=h,l)J(h,k=h,l) in the (h,k=h,l)formulae-sequenceβ„Žπ‘˜β„Žπ‘™(h,k=h,l) reciprocal lattice plane

Using the contour plot of the J(h,k=h,l)J(h,k=h,l), we find the location of the magnetic Braggs in the (h,h,l)β„Žβ„Žπ‘™(h,h,l) reciprocal lattice, where

J​(h,h,l)=8​J1​cos2⁑(π​h)​cos⁑(π​l)+2​J2​cos⁑(2​π​l)+4​J3​cos⁑(2​π​h).π½β„Žβ„Žπ‘™8subscript𝐽1superscript2πœ‹β„Žπœ‹π‘™2subscript𝐽22πœ‹π‘™4subscript𝐽32πœ‹β„ŽJ(h,h,l)=8J_{1}\cos^{2}(\pi h)\cos(\pi l)+2J_{2}\cos(2\pi l)+4J_{3}\cos(2\pi h).

The location of the magnetic Bragg peaks is given by

(0,0,1Β±Ο΅),(0,0,3Β±Ο΅),(0,0,5Β±Ο΅),(0,0,7Β±Ο΅),…,00plus-or-minus1italic-Ο΅00plus-or-minus3italic-Ο΅00plus-or-minus5italic-Ο΅00plus-or-minus7italic-ϡ…\displaystyle(0,0,1\pm\epsilon),(0,0,3\pm\epsilon),(0,0,5\pm\epsilon),(0,0,7\pm\epsilon),\dots,
(1/2,1/2,1/2),(1/2,1/2,3/2),(1/2,1/2,5/2),(1/2,1/2,7/2),…,121212121232121252121272…\displaystyle(1/2,1/2,1/2),(1/2,1/2,3/2),(1/2,1/2,5/2),(1/2,1/2,7/2),\dots,
(1,1,1Β±Ο΅),(1,1,3Β±Ο΅),(1,1,5Β±Ο΅),(1,1,7Β±Ο΅),…,11plus-or-minus1italic-Ο΅11plus-or-minus3italic-Ο΅11plus-or-minus5italic-Ο΅11plus-or-minus7italic-ϡ…\displaystyle(1,1,1\pm\epsilon),(1,1,3\pm\epsilon),(1,1,5\pm\epsilon),(1,1,7\pm\epsilon),\dots,
(3/2,3/2,1/2)​(3/2,3/2,3/2),(3/2,3/2,5/2),(3/2,3/2,7/2),…,323212323232323252323272…\displaystyle(3/2,3/2,1/2)(3/2,3/2,3/2),(3/2,3/2,5/2),(3/2,3/2,7/2),\dots,

in the reciprocal lattice plane of (h,k=h,l)formulae-sequenceβ„Žπ‘˜β„Žπ‘™(h,k=h,l), where Ο΅=0.29771italic-Ο΅0.29771\epsilon=0.29771.

VI.3 The contour plot in the (h,k,l)β„Žπ‘˜π‘™(h,k,l) plane with l=2​n𝑙2𝑛l=2n

Using the contour plot of the Mathematica, we find the location of the magnetic Braggs in the (h,k,l=2​n)β„Žπ‘˜π‘™2𝑛(h,k,l=2n) reciprocal lattice, where

J​(h,k,l=2​n)π½β„Žπ‘˜π‘™2𝑛\displaystyle J(h,k,l=2n) =\displaystyle= 8​J1​cos⁑(π​h)​cos⁑(π​k)8subscript𝐽1πœ‹β„Žπœ‹π‘˜\displaystyle 8J_{1}\cos(\pi h)\cos(\pi k)
+\displaystyle+ 2​J3​[cos⁑(2​π​h)+cos⁑(2​π​k)]+2​J2,2subscript𝐽3delimited-[]2πœ‹β„Ž2πœ‹π‘˜2subscript𝐽2\displaystyle 2J_{3}[\cos(2\pi h)+\cos(2\pi k)]+2J_{2},

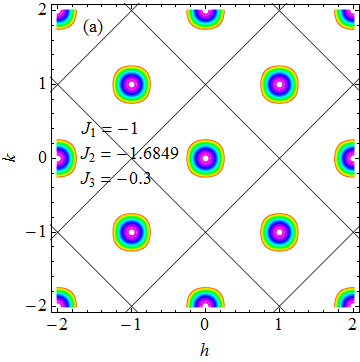
which does not depend on the index n𝑛n. Figures 5(a) show the location of magnetic Bragg peaks in the in-plane (h,k,l=2​n)β„Žπ‘˜π‘™2𝑛(h,k,l=2n) reciprocal lattice plane. We find that the magnetic Bragg peaks appear for h+k=β„Žπ‘˜absenth+k= even. This selection rule is true for l=2​n𝑙2𝑛l=2n with any integer n𝑛n.

VI.4 The contour plot in the (h,k,l)β„Žπ‘˜π‘™(h,k,l) plane with l=2​n+1𝑙2𝑛1l=2n+1

Refer to caption
Refer to caption
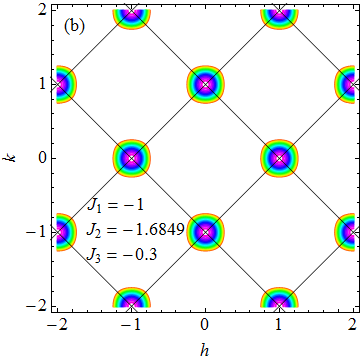
Figure 5: (Color online) (a) Magnetic Bragg points in the (h,k,l=2​n)β„Žπ‘˜π‘™2𝑛(h,k,l=2n) reciprocal lattice plane. (b) Magnetic Bragg points in the (h,k,l=2​n+1)β„Žπ‘˜π‘™2𝑛1(h,k,l=2n+1) reciprocal lattice plane. J1=βˆ’1subscript𝐽11J_{1}=-1, J2=βˆ’1.68469subscript𝐽21.68469J_{2}=-1.68469. J3=βˆ’0.3subscript𝐽30.3J_{3}=-0.3. p3=0.3subscript𝑝30.3p_{3}=0.3.

Using the contour plot of the Mathematica, we find the location of the magnetic Braggs in the (h,k,l=2​n+1)β„Žπ‘˜π‘™2𝑛1(h,k,l=2n+1) reciprocal lattice, where

J(h,k,l\displaystyle J(h,k,l =\displaystyle= 2n+1)=βˆ’8J1cos(Ο€h)cos(Ο€k))\displaystyle 2n+1)=-8J_{1}\cos(\pi h)\cos(\pi k))
+\displaystyle+ 2​J3​[cos⁑(2​π​h)+cos⁑(2​π​k)]+2​J2,2subscript𝐽3delimited-[]2πœ‹β„Ž2πœ‹π‘˜2subscript𝐽2\displaystyle 2J_{3}[\cos(2\pi h)+\cos(2\pi k)]+2J_{2},

which does not depend on the index n𝑛n. Figure 5(b) show the location of the magnetic Bragg peaks in the in-plane (h,k,l=2​n+1)β„Žπ‘˜π‘™2𝑛1(h,k,l=2n+1) reciprocal lattice plane, where n𝑛n is the integer. The magnetic Bragg peaks appear for h+k=β„Žπ‘˜absenth+k= odd for l=2​n+1𝑙2𝑛1l=2n+1.

VII Phase diagram in the (J2,J3)subscript𝐽2subscript𝐽3(J_{2},J_{3}) plane

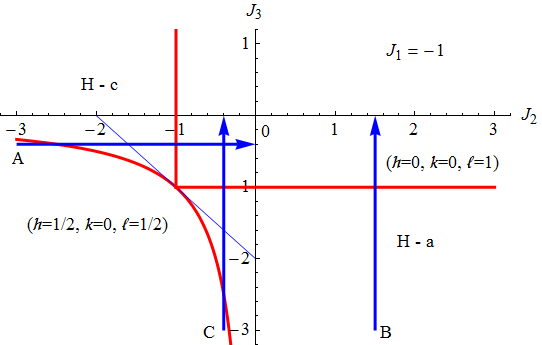
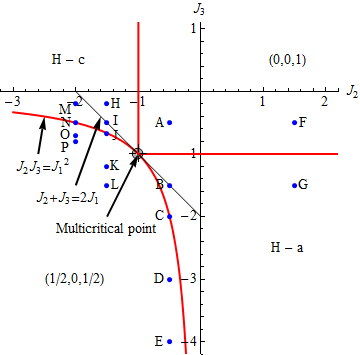
The phase diagram for J1=βˆ’1subscript𝐽11J_{1}=-1 can be determined using the programs of the ContourPlot and FindMaximum. The phase diagram consists of the four phases; (i) the helical order along the c𝑐c axis, (ii) the helical order along the aπ‘Ža axis, (iii) the ordered phase with h=1/2β„Ž12h=1/2, k=0π‘˜0k=0, and l=1/2𝑙12l=1/2, and (iv) the ordered phase with h=0β„Ž0h=0, k=0π‘˜0k=0, l=1𝑙1l=1 is shown in the phase diagram Fig.Β 6.

VII.1 Ordered phases

VII.1.1 Helical order along the c𝑐c axis

The spin vectors in the same a​bπ‘Žπ‘ab plane are parallel, i.e., h=0β„Ž0h=0 and k=0π‘˜0k=0. They screw along the c𝑐c axis. We find the maximum of

J​(h=0,k=0,l)𝐽formulae-sequenceβ„Ž0π‘˜0𝑙\displaystyle J(h=0,k=0,l) =\displaystyle= 4​J3+8​J1​cos⁑(l​π)4subscript𝐽38subscript𝐽1π‘™πœ‹\displaystyle 4J_{3}+8J_{1}\cos(l\pi)
+\displaystyle+ 2​J2​cos⁑(2​l​π),2subscript𝐽22π‘™πœ‹\displaystyle 2J_{2}\cos(2l\pi),

by taking the derivative of J​(h=0,k=0,l)𝐽formulae-sequenceβ„Ž0π‘˜0𝑙J(h=0,k=0,l) with respect to l𝑙l. The condition of the local maximum is given by

cos⁑(π​l)=βˆ’J1J2,πœ‹π‘™subscript𝐽1subscript𝐽2\cos(\pi l)=-\frac{J_{1}}{J_{2}},

where |J1/J2|<1subscript𝐽1subscript𝐽21\left|J_{1}/J_{2}\right|<1. Then the maximum of J​(h=0,k=0,l)𝐽formulae-sequenceβ„Ž0π‘˜0𝑙J(h=0,k=0,l) is given by

Jmax​(h=0,k=0,l)=4​J3βˆ’4​J12J2βˆ’2​J2,subscript𝐽formulae-sequenceβ„Ž0π‘˜0𝑙4subscript𝐽34superscriptsubscript𝐽12subscript𝐽22subscript𝐽2J_{\max}(h=0,k=0,l)=4J_{3}-4\frac{J_{1}^{2}}{J_{2}}-2J_{2}, (15)

for the helical order with (h=0β„Ž0h=0, k=0π‘˜0k=0, and l𝑙l) where l=0.70228𝑙0.70228l=0.70228,

VII.1.2 Helical order along the aπ‘Ža axis

The helical spin order where the spin vector in the same bc plane are parallel and they screw along the aπ‘Ža axis. We find the maximum of

J(h,k=0,l=1)=2J2+2J3+8J1cos(Ο€h)+2J3cos(2Ο€h),J(h,k=0,l=1)=2J_{2}+2J_{3}+8J_{1}\cos(\pi h)+2J_{3}\cos(2\pi h),

by taking the derivative of J(h,k=0,l=0)J(h,k=0,l=0) with respect to hβ„Žh. The condition of the local maximum is given by

cos⁑(π​h)=βˆ’J1J3,πœ‹β„Žsubscript𝐽1subscript𝐽3\cos(\pi h)=-\frac{J_{1}}{J_{3}},

where |J1/J3|<1subscript𝐽1subscript𝐽31\left|J_{1}/J_{3}\right|<1. The maximum value is

Jmax(h,k=0,l=1)=2J2βˆ’4J12J3.J_{\max}(h,k=0,l=1)=2J_{2}-4\frac{J_{1}^{2}}{J_{3}}. (16)

VII.1.3 The ordered phase with h=0β„Ž0h=0, k=0π‘˜0k=0, and l=1𝑙1l=1

J​(h=0,k=0,l=1)𝐽formulae-sequenceβ„Ž0formulae-sequenceπ‘˜0𝑙1J(h=0,k=0,l=1) is given by

J​(h=0,k=0,l=1)=βˆ’8​J1+2​J2+4​J3.𝐽formulae-sequenceβ„Ž0formulae-sequenceπ‘˜0𝑙18subscript𝐽12subscript𝐽24subscript𝐽3J(h=0,k=0,l=1)=-8J_{1}+2J_{2}+4J_{3}. (17)

VII.1.4 The ordered phase with h=1/2β„Ž12h=1/2, k=0π‘˜0k=0, and l=1/2𝑙12l=1/2

This phase corresponds to the MnF2-type antiferromagnetic structure (named by Yoshimoriref02 ). J​(h=1/2,k=0,l=1/2)𝐽formulae-sequenceβ„Ž12formulae-sequenceπ‘˜0𝑙12J(h=1/2,k=0,l=1/2) is evaluated as

J​(h=1/2,k=0,l=1/2)=βˆ’2​J2.𝐽formulae-sequenceβ„Ž12formulae-sequenceπ‘˜0𝑙122subscript𝐽2J(h=1/2,k=0,l=1/2)=-2J_{2}. (18)

VII.2 Boundaries between ordered phases

VII.2.1 The phase boundary between the spin order with the phase (h=1/2β„Ž12h=1/2, k=0π‘˜0k=0, and l=1/2𝑙12l=1/2) and the helical spin order along the c𝑐c axis

The difference of J​(h,k,l)π½β„Žπ‘˜π‘™J(h,k,l) between the helical spin order along the c𝑐c axis and the phase (h=1/2,k=0,l=1/2)formulae-sequenceβ„Ž12formulae-sequenceπ‘˜0𝑙12(h=1/2,k=0,l=1/2) is given by

Jmax​(h=0,k=0,l)βˆ’J​(h=1/2,k=0,l=1/2)subscript𝐽formulae-sequenceβ„Ž0π‘˜0𝑙𝐽formulae-sequenceβ„Ž12formulae-sequenceπ‘˜0𝑙12\displaystyle J_{\max}(h=0,k=0,l)-J(h=1/2,k=0,l=1/2)
=4​J2βˆ’4​J12J3.absent4subscript𝐽24superscriptsubscript𝐽12subscript𝐽3\displaystyle=4J_{2}-4\frac{J_{1}^{2}}{J_{3}}.

So the helical ordered phase is energetically favorable when

J2>J12J3,subscript𝐽2superscriptsubscript𝐽12subscript𝐽3J_{2}>\frac{J_{1}^{2}}{J_{3}},

with the condition of |J1/J2|<1subscript𝐽1subscript𝐽21\left|J_{1}/J_{2}\right|<1. When J3<0subscript𝐽30J_{3}<0, this inequality can be rewritten as

J2​J3<J12,subscript𝐽2subscript𝐽3superscriptsubscript𝐽12J_{2}J_{3}<J_{1}^{2}, (19)

or

p2​p3<1.subscript𝑝2subscript𝑝31p_{2}p_{3}<1.

VII.2.2 The phase boundary between the spin order with (h=0β„Ž0h=0, k=0π‘˜0k=0, l=1𝑙1l=1) and the spin order with (h=1/2β„Ž12h=1/2, k=0π‘˜0k=0, l=1/2𝑙12l=1/2)

The difference of J​(h,k,l)π½β„Žπ‘˜π‘™J(h,k,l) between the (h=0,k=0,l=1)formulae-sequenceβ„Ž0formulae-sequenceπ‘˜0𝑙1(h=0,k=0,l=1) and the phase (h=1/2,k=0,l=1/2)formulae-sequenceβ„Ž12formulae-sequenceπ‘˜0𝑙12(h=1/2,k=0,l=1/2) is given by

J​(h=1/2,k=0,l=1/2)βˆ’J​(h=0,k=0,l=1)𝐽formulae-sequenceβ„Ž12formulae-sequenceπ‘˜0𝑙12𝐽formulae-sequenceβ„Ž0formulae-sequenceπ‘˜0𝑙1\displaystyle J(h=1/2,k=0,l=1/2)-J(h=0,k=0,l=1)
=βˆ’4​J2βˆ’4​J3+8​J1.absent4subscript𝐽24subscript𝐽38subscript𝐽1\displaystyle=-4J_{2}-4J_{3}+8J_{1}.

When

2​J1>J2+J3,2subscript𝐽1subscript𝐽2subscript𝐽32J_{1}>J_{2}+J_{3}, (20)

the phase (h=1/2,k=0,l=1/2)formulae-sequenceβ„Ž12formulae-sequenceπ‘˜0𝑙12(h=1/2,k=0,l=1/2) is energetically favorable. When

2​J1<J2+J3.2subscript𝐽1subscript𝐽2subscript𝐽32J_{1}<J_{2}+J_{3}. (21)

the phase h=0β„Ž0h=0, k=0π‘˜0k=0, l=1𝑙1l=1) is energetically favorable.

VII.2.3 The phase boundary between the helical order along the aπ‘Ža axis and the phase (h=k=1/2β„Žπ‘˜12h=k=1/2, and l=1𝑙1l=1)

The difference of J​(h,k,l)π½β„Žπ‘˜π‘™J(h,k,l) between the (h=0,k=0,l=1)formulae-sequenceβ„Ž0formulae-sequenceπ‘˜0𝑙1(h=0,k=0,l=1) and the helical order along the aπ‘Ža axis is given by

Jmax(h,k=0,l=1)βˆ’J(h=0,k=0,l=1)\displaystyle J_{\max}(h,k=0,l=1)-J(h=0,k=0,l=1)
=βˆ’4​J3​(J1J3βˆ’1)2.absent4subscript𝐽3superscriptsubscript𝐽1subscript𝐽312\displaystyle=-4J_{3}(\frac{J_{1}}{J_{3}}-1)^{2}.

Then the helical order is stable for J3<βˆ’1subscript𝐽31J_{3}<-1. This inequality is satisfied for the condition of the helical order

|J1/J3|<1.subscript𝐽1subscript𝐽31\left|J_{1}/J_{3}\right|<1.

VII.3 Multicritical point (J2=βˆ’1subscript𝐽21J_{2}=-1 and J3=βˆ’1subscript𝐽31J_{3}=-1) and phase transition lines

Refer to caption
Figure 6: (Color online) Scans A, B, and C in the phase diagram (J2subscript𝐽2J_{2}, J3subscript𝐽3J_{3}) to determine the location of the magnetic Bragg peaks in the (h,k,l)β„Žπ‘˜π‘™(h,k,l) reciprocal space. J1=βˆ’1subscript𝐽11J_{1}=-1. Note that J2=βˆ’1.68469subscript𝐽21.68469J_{2}=-1.68469 and J3=βˆ’0.537subscript𝐽30.537J_{3}=-0.537 for β𝛽\beta-MnO2 (denoted by an open circle).

All four ordered phases merge only at the multicritical point at (J2=βˆ’1subscript𝐽21J_{2}=-1 and J3=βˆ’1subscript𝐽31J_{3}=-1), where the line given by 2​J1=J2+J32subscript𝐽1subscript𝐽2subscript𝐽32J_{1}=J_{2}+J_{3} and the curve J2​J3=J12subscript𝐽2subscript𝐽3superscriptsubscript𝐽12J_{2}J_{3}=J_{1}^{2} intersect with other (see the phase diagram of J3subscript𝐽3J_{3} vs J2subscript𝐽2J_{2}). Note that J1=βˆ’1subscript𝐽11J_{1}=-1. As will be shown later, the line (2​J1=J2+J32subscript𝐽1subscript𝐽2subscript𝐽32J_{1}=J_{2}+J_{3}) is of the first-order. The lines denoted byJ2=βˆ’1subscript𝐽21J_{2}=-1 and J3=βˆ’1subscript𝐽31J_{3}=-1 are of the second-order.
(1) Using the program of finding maximum in J​(πͺ)𝐽πͺJ({\bf q}) for each point (J2subscript𝐽2J_{2}, J3subscript𝐽3J_{3}) in the phase digram, we find the local maximum point (h,0,l)β„Ž0𝑙(h,0,l) in the hβ„Žh-l𝑙l plane. The location of these points is plotted as a function of J2subscript𝐽2J_{2} when J3subscript𝐽3J_{3} is fixed and as a function of J3subscript𝐽3J_{3} when J2subscript𝐽2J_{2} is fixed.
(2) Using the program of finding maximum in J​(πͺ)𝐽πͺJ({\bf q}) for each point (J2subscript𝐽2J_{2}, J3subscript𝐽3J_{3}) in the phase diagram, we find the local maximum point (h,k,0)β„Žπ‘˜0(h,k,0) in the hβ„Žh-kπ‘˜k plane. These points are plotted as a function of J2subscript𝐽2J_{2} when J3subscript𝐽3J_{3} is fixed and as a function of J3subscript𝐽3J_{3} when J2subscript𝐽2J_{2} is fixed.

VII.3.1 Scan A

Refer to caption
Refer to caption
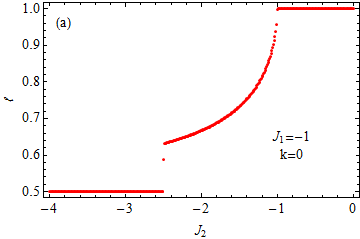
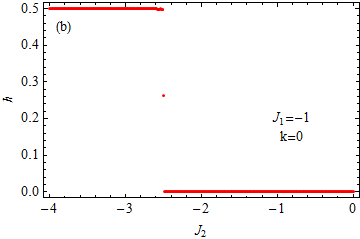
Figure 7: (Color online) (a) l𝑙l vs J2subscript𝐽2J_{2} and (b) hβ„Žh vs J2subscript𝐽2J_{2} along the scan A (βˆ’4≀J2≀04subscript𝐽20-4\leq J_{2}\leq 0 and J3=βˆ’0.4subscript𝐽30.4J_{3}=-0.4). k=0π‘˜0k=0. J1=βˆ’1subscript𝐽11J_{1}=-1.

In the Scan A (see Fig.Β 6), we choose J3=βˆ’0.4subscript𝐽30.4J_{3}=-0.4 and J1=βˆ’1subscript𝐽11J_{1}=-1. J2subscript𝐽2J_{2} is changed as a parameter between βˆ’4.04.0-4.0 and 0. We make a plot of l𝑙l vs J2subscript𝐽2J_{2} in Fig.Β 7(a). The discontinuity in l𝑙l vs J2subscript𝐽2J_{2} occurs at J2=βˆ’2.5subscript𝐽22.5J_{2}=-2.5 [the phase boundary (first order) between the phase with (h=1/2,k=0,l=1/2)formulae-sequenceβ„Ž12formulae-sequenceπ‘˜0𝑙12(h=1/2,k=0,l=1/2) and the helical order along the c𝑐c axis], where the relation J2​J3=J12subscript𝐽2subscript𝐽3superscriptsubscript𝐽12J_{2}J_{3}=J_{1}^{2} is satisfied (J1=βˆ’1subscript𝐽11J_{1}=-1). We find that the relation of l𝑙l vs J2subscript𝐽2J_{2} is well described by

cos⁑(π​l)=βˆ’J1J2,πœ‹π‘™subscript𝐽1subscript𝐽2\cos(\pi l)=-\frac{J_{1}}{J_{2}}, (22)

for βˆ’2.5≀J2β‰€βˆ’12.5subscript𝐽21-2.5\leq J_{2}\leq-1 (the helical phase along the c𝑐c axis). For example, when l=0.8𝑙0.8l=0.8, we have J2=βˆ’1.24subscript𝐽21.24J_{2}=-1.24 as shown in Fig.Β 7(a). We note that l𝑙l is equal to 1 at J2=βˆ’1subscript𝐽21J_{2}=-1 [the phase boundary(second order) between the helical phase along the c𝑐c axis and the phase with (h=0,k=0,l=1)formulae-sequenceβ„Ž0formulae-sequenceπ‘˜0𝑙1(h=0,k=0,l=1)] and remain unchanged (l=1𝑙1l=1) for βˆ’1≀J2≀01subscript𝐽20-1\leq J_{2}\leq 0. We also make a plot of hβ„Žh vs J2subscript𝐽2J_{2} in Fig.Β 7(b). The value of hβ„Žh undergoes a sudden change from h=0.5β„Ž0.5h=0.5 to 0 at J2=βˆ’2.5subscript𝐽22.5J_{2}=-2.5 (at the phase boundary between the phase with (h=1/2,k=0,l=1/2)formulae-sequenceβ„Ž12formulae-sequenceπ‘˜0𝑙12(h=1/2,k=0,l=1/2) and the helical order along the c𝑐c axis) and remains constant (h=0β„Ž0h=0) for βˆ’2.5≀J2≀02.5subscript𝐽20-2.5\leq J_{2}\leq 0. Note that there is no change of hβ„Žh at J2=βˆ’1subscript𝐽21J_{2}=-1.

VII.3.2 Scan B

Refer to caption
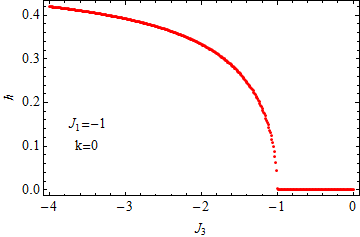
Figure 8: (Color online) hβ„Žh vs J3subscript𝐽3J_{3} along the scan B (βˆ’4≀J3≀04subscript𝐽30-4\leq J_{3}\leq 0 and J2=1.5subscript𝐽21.5J_{2}=1.5). J1=βˆ’1subscript𝐽11J_{1}=-1. k=0π‘˜0k=0 and l=1𝑙1l=1.

In the Scan B (see Fig.Β 6), we choose J2=1.5subscript𝐽21.5J_{2}=1.5 and J1=βˆ’1subscript𝐽11J_{1}=-1. J3subscript𝐽3J_{3} is changed as a parameter between -4.0 and 0. We make a plot of hβ„Žh vs J2subscript𝐽2J_{2} in Fig.Β 8. The value of hβ„Žh decreases with increasing J3subscript𝐽3J_{3} and reduces to zero at J3=βˆ’1subscript𝐽31J_{3}=-1 [the phase boundary (second-order) between the helical order along the aπ‘Ža axis and the phase with (h=0,k=0,l=1)formulae-sequenceβ„Ž0formulae-sequenceπ‘˜0𝑙1(h=0,k=0,l=1)]. We find that the relation of hβ„Žh vs J3subscript𝐽3J_{3} is well described by

cos⁑(π​h)=βˆ’J1J3.πœ‹β„Žsubscript𝐽1subscript𝐽3\cos(\pi h)=-\frac{J_{1}}{J_{3}}. (23)

The value of hβ„Žh is independent of J2subscript𝐽2J_{2}. For example, when h=0.2β„Ž0.2h=0.2, we have J3=βˆ’1.236subscript𝐽31.236J_{3}=-1.236. The plot of l𝑙l vs J2subscript𝐽2J_{2} (which is not shown here) indicates that l𝑙l remains constant (l=1𝑙1l=1) for βˆ’4≀J3≀04subscript𝐽30-4\leq J_{3}\leq 0, where J2=1.5subscript𝐽21.5J_{2}=1.5.

VII.3.3 Scan C

Refer to caption
Refer to caption
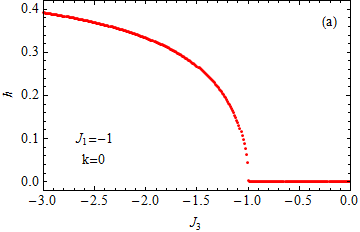
Figure 9: (Color online) (a) hβ„Žh vs J3subscript𝐽3J_{3} and (b) l𝑙l vs J3subscript𝐽3J_{3} along the scan C (βˆ’3.0≀J3≀03.0subscript𝐽30-3.0\leq J_{3}\leq 0 and J2=βˆ’0.4subscript𝐽20.4J_{2}=-0.4). J1=βˆ’1subscript𝐽11J_{1}=-1. k=0π‘˜0k=0.

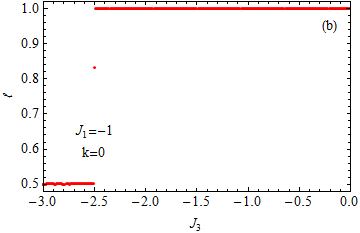
In the Scan C, we choose J2=βˆ’0.4subscript𝐽20.4J_{2}=-0.4 and J1=βˆ’1subscript𝐽11J_{1}=-1. J3subscript𝐽3J_{3} is changed as a parameter between -3.5 and 0. We make a plot of hβ„Žh vs J3subscript𝐽3J_{3} and l𝑙l vs J3subscript𝐽3J_{3} in Figs.Β 9(a) and (b). As shown in Fig.Β 9(a), the value of hβ„Žh decreases with increasing J3subscript𝐽3J_{3}, showing an abrupt decrease at J3=βˆ’2.5subscript𝐽32.5J_{3}=-2.5 (which is denoted by J2​J3=J12subscript𝐽2subscript𝐽3superscriptsubscript𝐽12J_{2}J_{3}=J_{1}^{2}) [the phase boundary (first-order) between the phase with (h=1/2,k=0,l=1/2)formulae-sequenceβ„Ž12formulae-sequenceπ‘˜0𝑙12(h=1/2,k=0,l=1/2) and the helical order along the aπ‘Ža axis]. The value of hβ„Žh decreases with further increasing J3subscript𝐽3J_{3}, following Eq.(23), and reduces to zero at J3=βˆ’1subscript𝐽31J_{3}=-1 [the phase boundary (second-order) between the helical order along the aπ‘Ža axis and the phase with (h=0,k=0,l=1)formulae-sequenceβ„Ž0formulae-sequenceπ‘˜0𝑙1(h=0,k=0,l=1)].

In Fig.Β 9(b), the value of l𝑙l increases with increasing J3subscript𝐽3J_{3}. It shows an abrupt change from l=1/2𝑙12l=1/2 to l=1𝑙1l=1 at J3=βˆ’2.5subscript𝐽32.5J_{3}=-2.5 at the phase boundary (first-order) between the phase with (h=1/2,k=0,l=1/2)formulae-sequenceβ„Ž12formulae-sequenceπ‘˜0𝑙12(h=1/2,k=0,l=1/2) and the helical state along the aπ‘Ža axis.

VIII Contour plot of (h,0,l)β„Ž0𝑙(h,0,l) for typical points in the (J2,J3)subscript𝐽2subscript𝐽3(J_{2},J_{3}) phase diagram

Refer to caption
Figure 10: (Color online) Phase diagram of J3subscript𝐽3J_{3} vs J2subscript𝐽2J_{2}: J1=βˆ’1subscript𝐽11J_{1}=-1.H𝐻H-aπ‘Ža: helical order along the aπ‘Ža axis.H𝐻H-c𝑐c: helical order along the c𝑐c axis. The ordered phase with (h=1/2,k=0,l=1/2)formulae-sequenceβ„Ž12formulae-sequenceπ‘˜0𝑙12(h=1/2,k=0,l=1/2). The ordered phase with (h=0,k=0,l=1)formulae-sequenceβ„Ž0formulae-sequenceπ‘˜0𝑙1(h=0,k=0,l=1). The multicritical point is at (J2=βˆ’1subscript𝐽21J_{2}=-1, J3=βˆ’1subscript𝐽31J_{3}=-1). The calculations of the contour plots are made at the points (A, B, C, β‹―β‹―\cdots, P). The line J2​J3=J12subscript𝐽2subscript𝐽3superscriptsubscript𝐽12J_{2}J_{3}=J_{1}^{2} is the first-order phase boundary. The line (J2=βˆ’1subscript𝐽21J_{2}=-1, J3>βˆ’1subscript𝐽31J_{3}>-1) and the line (J3=βˆ’1subscript𝐽31J_{3}=-1, J2>βˆ’1subscript𝐽21J_{2}>-1) are the second-order phase boundary.

Here we show the contour plot of J​(h,0,l)π½β„Ž0𝑙J(h,0,l) for the typical points in the (J2subscript𝐽2J_{2}, J3subscript𝐽3J_{3}) phase diagram (see Fig.Β 10). The maximum points in the countour plot of J​(h,0,l)π½β„Ž0𝑙J(h,0,l)) correspond to the magnetic Bragg peaks in the (h,0,l)β„Ž0𝑙(h,0,l) plane.

VIII.1 The points A, B, C, D, and E with J1=βˆ’1.0subscript𝐽11.0J_{1}=-1.0 and J2=βˆ’0.5subscript𝐽20.5J_{2}=-0.5

Refer to caption
Refer to caption
Refer to caption
Refer to caption
Refer to caption
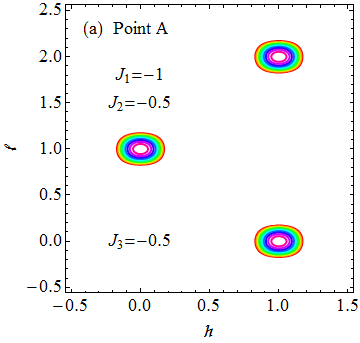
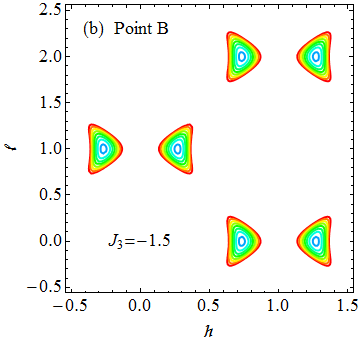
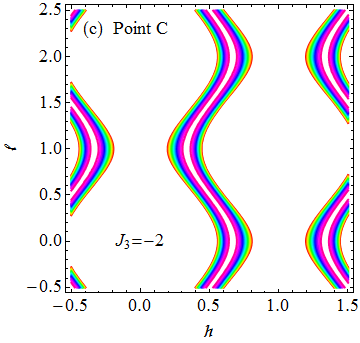
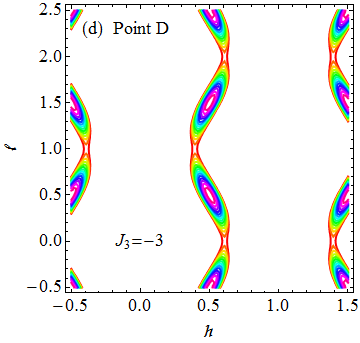
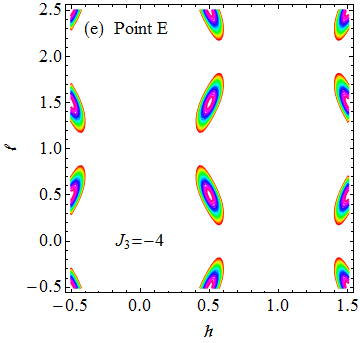
Figure 11: (Color online) Distribution of Bragg peaks in the (h,0,l)β„Ž0𝑙(h,0,l) reciprocal lattice plane. J1=βˆ’1subscript𝐽11J_{1}=-1. J2=βˆ’0.5subscript𝐽20.5J_{2}=-0.5, and J3subscript𝐽3J_{3} is changed as a parameter. (a) Point A (J3=βˆ’0.5subscript𝐽30.5J_{3}=-0.5), (b) Point B (J3=βˆ’1.5subscript𝐽31.5J_{3}=-1.5), (c) Point C (J3=βˆ’2.0subscript𝐽32.0J_{3}=-2.0), (d) Point D (J3=βˆ’3.0subscript𝐽33.0J_{3}=-3.0), and (e) Point E (J3=βˆ’4.0subscript𝐽34.0J_{3}=-4.0).

Typical contour plot of (h,0,l)β„Ž0𝑙(h,0,l) at the points A, B, C, D, and E in the (J2subscript𝐽2J_{2}, J3subscript𝐽3J_{3}) phase diagram are shown in Fig.Β 11. The point A (J3=βˆ’0.5subscript𝐽30.5J_{3}=-0.5) is in the phase with (hβ„Žh = 0, kπ‘˜k = 0, l𝑙l = 1). The point B (J3subscript𝐽3J_{3} = -1.5) is in the helical phase with the aπ‘Ža axis. The point C (J3=βˆ’2subscript𝐽32J_{3}=-2) is the phase boundary between the phase with (h=0,k=0,l=1)formulae-sequenceβ„Ž0formulae-sequenceπ‘˜0𝑙1(h=0,k=0,l=1) and the helical phase with the aπ‘Ža axis. The points D (J3=βˆ’3.0subscript𝐽33.0J_{3}=-3.0) and E (J3=βˆ’4.0subscript𝐽34.0J_{3}=-4.0) are in the phase with (h=1/2,k=0,l=1/2)formulae-sequenceβ„Ž12formulae-sequenceπ‘˜0𝑙12(h=1/2,k=0,l=1/2).

VIII.2 The points F and G with J1=βˆ’1.0subscript𝐽11.0J_{1}=-1.0 and J2=1.5subscript𝐽21.5J_{2}=1.5.

Refer to caption
Refer to caption
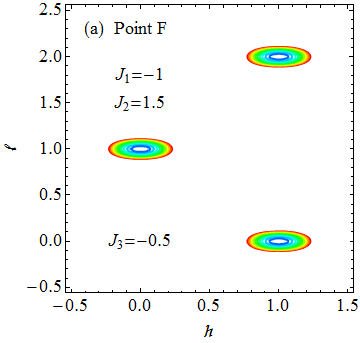
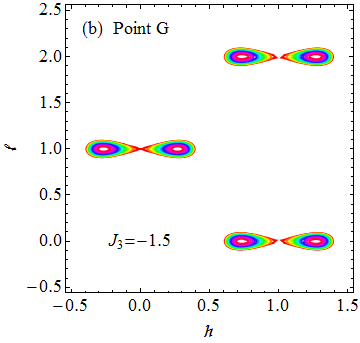
Figure 12: (Color online) Distribution of Bragg peaks in the (h,0,l)β„Ž0𝑙(h,0,l) reciprocal lattice plane. J1=βˆ’1subscript𝐽11J_{1}=-1. J2=1.5subscript𝐽21.5J_{2}=1.5, and J3subscript𝐽3J_{3} is changed as a parameter. (a) F (J3=βˆ’0.5subscript𝐽30.5J_{3}=-0.5) and (b) G (J3=βˆ’1.5subscript𝐽31.5J_{3}=-1.5).

Typical contour plot of (h,0,l)β„Ž0𝑙(h,0,l) at the points F and G in the (J2subscript𝐽2J_{2}, J3subscript𝐽3J_{3}) phase diagram are shown in Fig.Β 12. The point F (J3=βˆ’0.5subscript𝐽30.5J_{3}=-0.5) is in the phase with (h=0,k=0,l=1)formulae-sequenceβ„Ž0formulae-sequenceπ‘˜0𝑙1(h=0,k=0,l=1). The point G (J3=βˆ’1.5subscript𝐽31.5J_{3}=-1.5) is in the helical phase with the aπ‘Ža axis.

VIII.3 The points H, I, J, K, and L with J1=βˆ’1.0subscript𝐽11.0J_{1}=-1.0 and J2=βˆ’1.5subscript𝐽21.5J_{2}=-1.5

Refer to caption
Refer to caption
Refer to caption
Refer to caption
Refer to caption
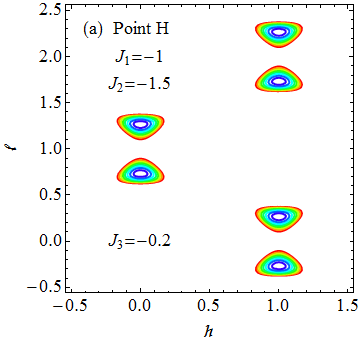
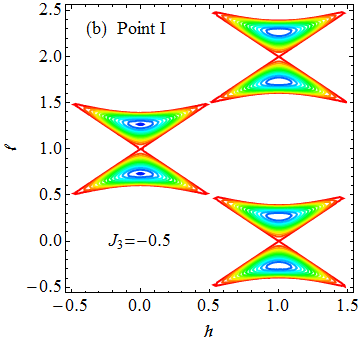
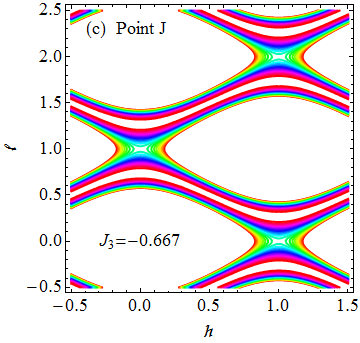
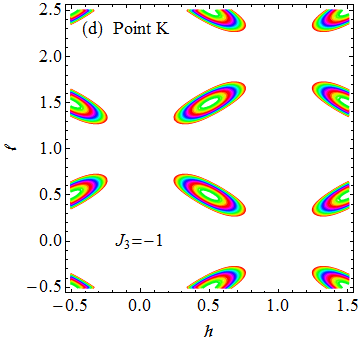
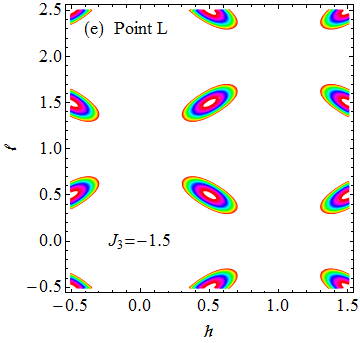
Figure 13: (Color online) Distribution of Bragg peaks in the (h,0,l)β„Ž0𝑙(h,0,l) reciprocal lattice plane. J1=βˆ’1subscript𝐽11J_{1}=-1. J2=βˆ’1.5subscript𝐽21.5J_{2}=-1.5, and J3subscript𝐽3J_{3} is changed as a parameter. (a) H (J3=βˆ’0.2subscript𝐽30.2J_{3}=-0.2), (b) I (J3=βˆ’0.5subscript𝐽30.5J_{3}=-0.5), (c) J (J3=βˆ’0.667subscript𝐽30.667J_{3}=-0.667), (d) K (J3=βˆ’1.2subscript𝐽31.2J_{3}=-1.2), and (e) L (J3=βˆ’1.5subscript𝐽31.5J_{3}=-1.5).

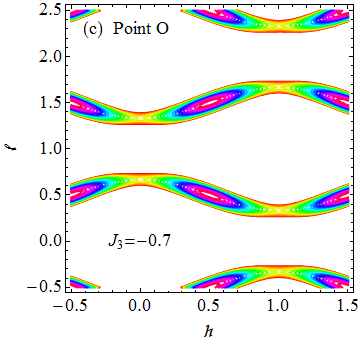
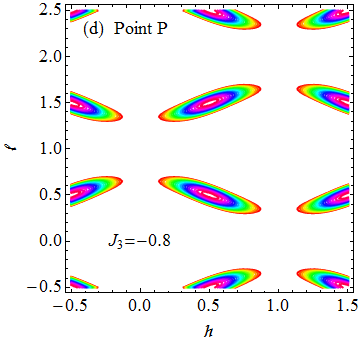
Typical contour plot of (h,0,l)β„Ž0𝑙(h,0,l) at the points H, I, J, K, and K in the (J2subscript𝐽2J_{2}, J3subscript𝐽3J_{3}) phase diagram are shown in Fig.Β 13. The point H (J3=βˆ’0.2subscript𝐽30.2J_{3}=-0.2) is in the helical phase along the c𝑐c axis. The point I (J3=βˆ’0.5subscript𝐽30.5J_{3}=-0.5) is in the helical phase with the c𝑐c axis and is on the line (J2+J3=2​J1subscript𝐽2subscript𝐽32subscript𝐽1J_{2}+J_{3}=2J_{1}). The point J (J3=βˆ’0.667subscript𝐽30.667J_{3}=-0.667) is on the phase boundary between the helical phase with the c𝑐c axis and the phase with (h=1.2,k=0,l=1/2)formulae-sequenceβ„Ž1.2formulae-sequenceπ‘˜0𝑙12(h=1.2,k=0,l=1/2). The points K (J3=βˆ’1.2subscript𝐽31.2J_{3}=-1.2) and L (J3=βˆ’1.5subscript𝐽31.5J_{3}=-1.5) are in the phase with (h=1/2,k=0,l=1/2)formulae-sequenceβ„Ž12formulae-sequenceπ‘˜0𝑙12(h=1/2,k=0,l=1/2).

VIII.4 The points M, N, O, and P with J1=βˆ’1.0subscript𝐽11.0J_{1}=-1.0 and J2=βˆ’2subscript𝐽22J_{2}=-2

Refer to caption
Refer to caption
Refer to caption
Refer to caption
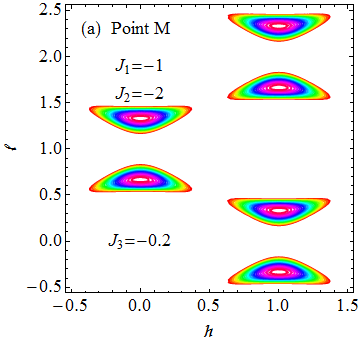
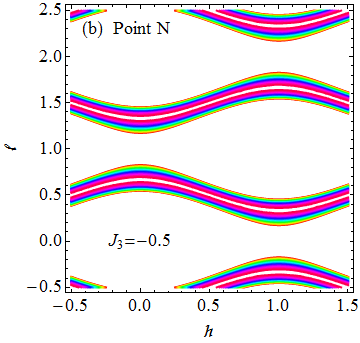
Figure 14: (Color online) Distribution of Bragg peaks in the (h,0,l)β„Ž0𝑙(h,0,l) reciprocal lattice plane. J1=βˆ’1subscript𝐽11J_{1}=-1. J2=βˆ’2subscript𝐽22J_{2}=-2, and J3subscript𝐽3J_{3} is changed as a parameter. (a) M (J3=βˆ’0.2subscript𝐽30.2J_{3}=-0.2), (b) N (J3=βˆ’0.5subscript𝐽30.5J_{3}=-0.5), (c) O (J3=βˆ’0.7subscript𝐽30.7J_{3}=-0.7), and (d) P (J3=βˆ’0.8subscript𝐽30.8J_{3}=-0.8).

Typical contour plot of (h,0,l)β„Ž0𝑙(h,0,l) at the points M, N, O, and P in the (J2subscript𝐽2J_{2}, J3subscript𝐽3J_{3}) phase diagram are shown in Fig.Β 14 The point M (J3=βˆ’0.2subscript𝐽30.2J_{3}=-0.2) is in the helical phase along the c𝑐c axis. The point N (J3=βˆ’0.5subscript𝐽30.5J_{3}=-0.5) is on the phase boundary (J2+J3=2​J1subscript𝐽2subscript𝐽32subscript𝐽1J_{2}+J_{3}=2J_{1}) between the helical phase with the c𝑐c axis and the phase with (h=1.2,k=0,l=1/2)formulae-sequenceβ„Ž1.2formulae-sequenceπ‘˜0𝑙12(h=1.2,k=0,l=1/2). The points O (J3=βˆ’0.7subscript𝐽30.7J_{3}=-0.7) and P (J3=βˆ’0.8subscript𝐽30.8J_{3}=-0.8) are in the phase with (h=1/2,k=0,l=1/2)formulae-sequenceβ„Ž12formulae-sequenceπ‘˜0𝑙12(h=1/2,k=0,l=1/2).

IX 3D spin structures

What is the three dimensional (3D) spin structure which is characterized with the wavevector of the magnetic Bragg peaks? The vector of spin at the site 𝐑isubscript𝐑𝑖{\bf R}_{i} of the real lattice space is given by

𝐒i=S​[cos⁑(𝐐⋅𝐑i)β€‹πžx+sin⁑(𝐐⋅𝐑i​ϕ)β€‹πžy]subscript𝐒𝑖𝑆delimited-[]⋅𝐐subscript𝐑𝑖subscript𝐞π‘₯⋅𝐐subscript𝐑𝑖italic-Ο•subscriptπžπ‘¦{\bf S}_{i}=S[\cos({\bf Q}\cdot{\bf R}_{i}){\bf e}_{x}+\sin({\bf Q}\cdot{\bf R}_{i}\phi){\bf e}_{y}]

where S=3/2𝑆32S=3/2, we assume that the phase factor Ο•italic-Ο•\phi is equal to zero, and Q is defined as

𝐐=(h​aβˆ—,k​aβˆ—,l​cβˆ—).πβ„Žsuperscriptπ‘Žπ‘˜superscriptπ‘Žπ‘™superscript𝑐{\bf Q}=(ha^{*},ka^{*},lc^{*}).

IX.1 Phase with (h=0,k=0,l=1)formulae-sequenceβ„Ž0formulae-sequenceπ‘˜0𝑙1(h=0,k=0,l=1)

Refer to caption
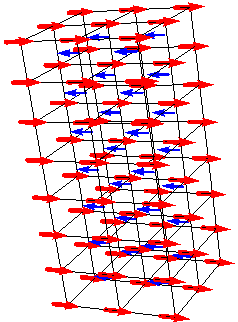
Figure 15: (Color online) structure in the phase (h=0,k=0,l=1)formulae-sequenceβ„Ž0formulae-sequenceπ‘˜0𝑙1(h=0,k=0,l=1).

A typical spin structure for the phase with (0, 0, 1) is described in Fig.Β 15.

IX.2 Phase with (h=1/2,k=0,l=1/2)formulae-sequenceβ„Ž12formulae-sequenceπ‘˜0𝑙12(h=1/2,k=0,l=1/2)

Refer to caption
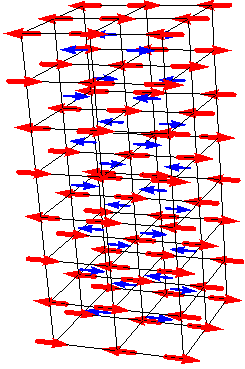
Figure 16: (Color online) Spin structure in the phase (h=1/2,k=0,l=1/2)formulae-sequenceβ„Ž12formulae-sequenceπ‘˜0𝑙12(h=1/2,k=0,l=1/2).

A typical spin structure for the phase with (1/2, 0, 1/2) is described in Fig.Β 16.

IX.3 Helical ordered phase along the c𝑐c axis; (0,0,l)00𝑙(0,0,l)

Refer to caption
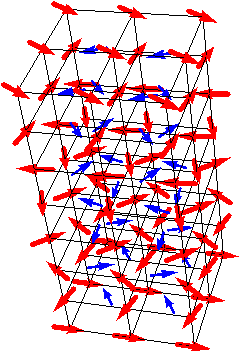
Figure 17: (Color online) Incommensurate spin structure for the helical order along the c𝑐c axis with the phase (0, 0, 0.7023).

The value l𝑙l is obtained as l=0.7023𝑙0.7023l=0.7023 for J2=βˆ’1.68469subscript𝐽21.68469J_{2}=-1.68469 from Eq. (22). A typical spin structure is incommensurate with the lattice structure and described by Fig.Β 17.

IX.4 Helical ordered phase along the c𝑐c axis (Yoshimori); commensurate structure
Refer to caption
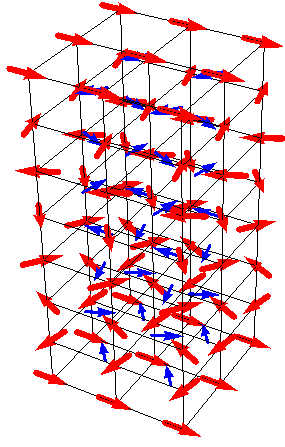
Figure 18: (Color online) Commensurate spin structure for the helical order along the c axis. with the phase (0,0,l=5/7)00𝑙57(0,0,l=5/7), which is proposed by Yoshimori.ref02

A typical spin structure with l=0.71421𝑙0.71421l=0.71421 is commensurate with the lattice structure and described by Fig.Β 18. The magnetic unit cell along the c𝑐c axis is seven times larger than the unit cell of the crystal unit cell.

IX.5 Helical ordered phase along the aπ‘Ža axis: (h,0,1)β„Ž01(h,0,1)

Refer to caption
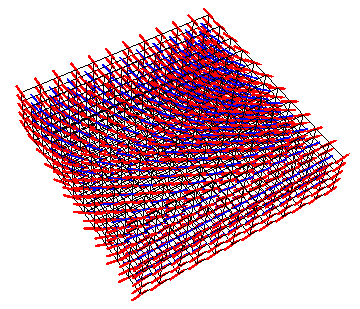
Figure 19: (Color online) Spin structure for the helical order along the aπ‘Ža axis with (hm​a​xsubscriptβ„Žπ‘šπ‘Žπ‘₯h_{max} = 2/3, 0, 1). J1=βˆ’1subscript𝐽11J_{1}=-1, and J3=βˆ’2.0subscript𝐽32.0J_{3}=-2.0.

When J3=βˆ’2.0subscript𝐽32.0J_{3}=-2.0 and J1=βˆ’1subscript𝐽11J_{1}=-1, hβ„Žh is equal to 2/3 from Eq. 23). Then a typical spin structure is described by Fig.Β 19.

X Discussion: nature of exchange interactions in the rutile-type β𝛽\beta-MnO2subscriptMnO2\text{MnO}_{2}

X.1 Overview

Refer to caption
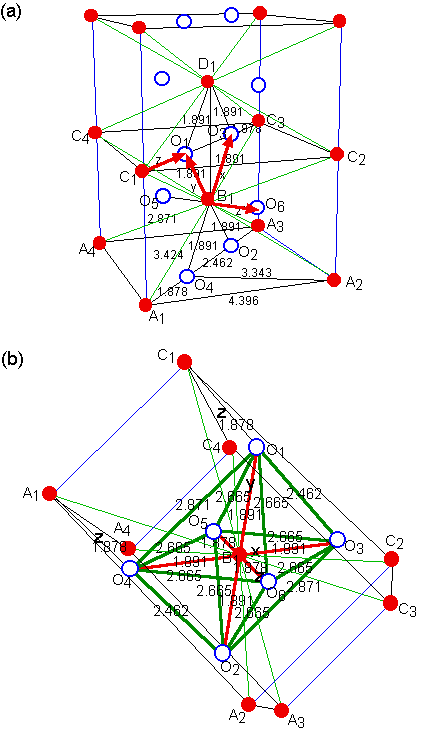
Figure 20: (Color online) (a) Crystal structure of β𝛽\beta-MnO2. ∠∠\angleA1O4B=1∠{}_{1}=\angleC1O1B=1130.62∘{}_{1}=130.62^{\circ}. ∠∠\angleA1O4A=2111.60∘{}_{2}=111.60^{\circ}. ∠∠\angleB1O3D=198.77∘{}_{1}=98.77^{\circ}. The distance (in the units of Γ…italic-Γ…\AA) is denoted by numerical value. (b) Distorted octahedra of β𝛽\beta-MnO2. ∠∠\angleO1B1O=498.77∘{}_{4}=98.77^{\circ}, ∠∠\angleO1B1O=381.225∘{}_{3}=81.225^{\circ}, ∠∠\angleO5O1O=689.590∘{}_{6}=89.590^{\circ}, ∠∠\angleO1O6O=545.205∘{}_{5}=45.205^{\circ}, and ∠∠\angleO1B1O=5∠{}_{5}=\angleO4B1O=590.0∘{}_{5}=90.0^{\circ}. The distance (in the units of Γ…italic-Γ…\AA) is denoted by numerical value.

We show that the magnetic phase diagram with J1=βˆ’1subscript𝐽11J_{1}=-1 is uniquely determined by the combination of J2subscript𝐽2J_{2} and J3subscript𝐽3J_{3}, where the sign of J3subscript𝐽3J_{3} is mainly negative and the sign of J2subscript𝐽2J_{2} is changed between negative to positive. For β𝛽\beta-MnO2, we have p2=1.68469subscript𝑝21.68469p_{2}=1.68469 and as p3=0.537subscript𝑝30.537p_{3}=0.537, leading to J2=βˆ’1.68469subscript𝐽21.68469J_{2}=-1.68469 and J3=βˆ’0.537subscript𝐽30.537J_{3}=-0.537 when J1=βˆ’1subscript𝐽11J_{1}=-1. This point (J2subscript𝐽2J_{2}, J3subscript𝐽3J_{3}) for β𝛽\beta-MnO2 is in the helical order along the c𝑐c axis, as shown in the magnetic phase diagram (Fig.Β 6).

In Fig.Β 20(a), we show the structure of β𝛽\beta-MnO2. Figure 20(b) shows the distorted octahedron where one Mn4+ ion (cation) at the point B1, is surrounded by six O2- ions (anion) at the points O1, O2, O3, O4, O5, and O6. The cation-cation separation (A1C1, B1D1) along a [001] axis is considerably smaller (2.871​Å2.871italic-Γ…2.871\AA). Because of the distorted octahedron formed by O2- ions in the vicinity of Mn4+ ion, the ground orbital state of Mn4+ ion (3​d33superscript𝑑33d^{3}, L=3𝐿3L=3 and S=3/2𝑆32S=3/2) is split into the t2​gsubscript𝑑2𝑔t_{2g} (d​ϡ𝑑italic-Ο΅d\epsilon) level [lower energy level, triple degenerate; d​(x​y)𝑑π‘₯𝑦d(xy), d​(y​z)𝑑𝑦𝑧d(yz), and d​(z​x)𝑑𝑧π‘₯d(zx) states] and the egsubscript𝑒𝑔e_{g} (d​γ𝑑𝛾d\gamma) level [upper energy, double degenerate; d​(3​z2βˆ’r2)𝑑3superscript𝑧2superscriptπ‘Ÿ2d(3z^{2}-r^{2}), d​(x2βˆ’y2)𝑑superscriptπ‘₯2superscript𝑦2d(x^{2}-y^{2}))]. The t2​gsubscript𝑑2𝑔t_{2g} state is occupied by three electrons with spin up state ∣+⟩ket\mid+\rangle. The Ο΅gsubscriptitalic-ϡ𝑔\epsilon_{g} state is empty. As a result, the ground state is orbital singlet, indicating that the orbital angular momentum is quenched. In β𝛽\beta-MnO2, the egsubscript𝑒𝑔e_{g} electrons are responsible for the metallic conduction, while the localized t2​gsubscript𝑑2𝑔t_{2g} electrons are responsible for the magnetism. In Fig.Β 20(b), the (3​z2βˆ’r2)3superscript𝑧2superscriptπ‘Ÿ2(3z^{2}-r^{2}) orbital axis at the point B1 coincides with O5B1O6 (the z𝑧z axis). The d​(x2βˆ’y2)𝑑superscriptπ‘₯2superscript𝑦2d(x^{2}-y^{2}) axes coincide with O3B1O4 (the xπ‘₯x axis) and the O1B1O2 (the y𝑦y axis). The xπ‘₯x and y𝑦y axes are perpendicular to the z𝑧z axis. However, the xπ‘₯x axis is not perpendicular to the y𝑦y axis (98.78∘superscript98.7898.78^{\circ}, 81.22∘superscript81.2281.22^{\circ}).

X.2 Origin of the direct exchange interaction J2subscript𝐽2J_{2}

We consider the exchange interaction J2subscript𝐽2J_{2} between the points B1 and D1 (or between the points A1 and C1). The distance B1D1 (A1C1) is 2.871​Å2.871italic-Γ…2.871\AA. In Fig.Β 20(b), one d​(x​y)𝑑π‘₯𝑦d(xy) orbital (t2​gsubscript𝑑2𝑔t_{2g}) from the point B1 bisects the angle ∠∠\angleO1B1O3 and meets at the middle point of the edge O1O3. The other d​(x​y)𝑑π‘₯𝑦d(xy) orbital from the point D1 (the center of neighboring octahedron) bisects the angle ∠∠\angleO1D1O3 and meets at the middle point of the edge O1O3. According to Goodenough,ref11 the predominant interactions between neighboring cations whose cation-ccupied octahedra share an edge, are assumed to be direct cation-cation exchange interaction. Thus the interaction J2subscript𝐽2J_{2} is antiferromagnetic (Heitler-London type) for β𝛽\beta-MnO2.

X.3 Origin of superexchange interaction J1subscript𝐽1J_{1}

We consider the interaction between Mn4+ at the point B1 and the Mn4+ at the point C1 as shown in Figs.Β 20 (a) and (b), where the distance C1B1 is 3.424​Å3.424italic-Γ…3.424\AA. According to Goodenough,ref11 this interaction (J1subscript𝐽1J_{1}) is a superexchange one since the cation-occupied octahedra share a common corner (point O1). The angle C1O1B1 is equal to 130.62∘superscript130.62130.62^{\circ}, this interaction is antiferromagnetic for β𝛽\beta-MnO2. According to Goodenough,ref11 when the cation-occupied octahedral share a common corner, there can be no direct overlap of neighboring cation orbitals and therefore there is no cation-cation interactions.

What is the origin of J1subscript𝐽1J_{1}? The point C1 is the center of the neighboring octahedron. The direction of C1O1 is the z𝑧z axis of this octahedron. A p𝑝p orbital of O1 is expected to be directed toward C1 (pΟƒsubscriptπ‘πœŽp_{\sigma} orbital) so as to overlap the d​(3​z2βˆ’r2)𝑑3superscript𝑧2superscriptπ‘Ÿ2d(3z^{2}-r^{2}) orbital of the point C1, where the p𝑝p orbital (pxsubscript𝑝π‘₯p_{x}, pysubscript𝑝𝑦p_{y}, pzsubscript𝑝𝑧p_{z} states) is called as pΟƒsubscriptπ‘πœŽp_{\sigma} orbital when the principal axis of the p𝑝p orbital coincides with the direction of the bond. A partial covalent bond between the d​(3​z2βˆ’r2)𝑑3superscript𝑧2superscriptπ‘Ÿ2d(3z^{2}-r^{2}) orbital and the pΟƒsubscriptπ‘πœŽp_{\sigma} orbital can be formed. Then the charge transfer occurs from the pΟƒsubscriptπ‘πœŽp_{\sigma} orbital with the spin-up state βˆ£β†‘βŸ©ket↑\mid\uparrow\rangle to the Ο΅gsubscriptitalic-ϡ𝑔\epsilon_{g} state. Consequently, the spin of Mn4+ at the point C1 is still in the spin-up state, while the resulting spin of O2- at the point O1 is in the spin-down state. The remaining pΟƒsubscriptπ‘πœŽp_{\sigma} state at the point O1 is magnetically coupled with the t2​gsubscript𝑑2𝑔t_{2g} state of the Mn4+ at the point B1. When this coupling (denoted as K0subscript𝐾0K_{0}) is antiferromagnetic, then the suprexchange interaction between Mn4+ at the point C1 and Mn4+ at the point B1 is ferromagnetic. On the other hand, when this coupling K0subscript𝐾0K_{0} is ferromagnetic, then the superexchange interaction between Mn4+ at the point C1 and Mn4+ at the point B1 is antiferromagnetic. Here we note that the angle Ξ±=βˆ π›Όβˆ \alpha=\angleC1O1B1 is equal to 130.62∘superscript130.62130.62^{\circ} for β𝛽\beta-MnO2, which is very different from 90∘superscript9090^{\circ}. If Ξ±=90βˆ˜π›Όsuperscript90\alpha=90^{\circ}, the pΟƒsubscriptπ‘πœŽp_{\sigma} orbital on the bond O1C1 coincides with the pΟ€subscriptπ‘πœ‹p_{\pi} orbital on the bond O1B1 (the y𝑦y axis), where the p𝑝p orbital (pxsubscript𝑝π‘₯p_{x}, pysubscript𝑝𝑦p_{y}, pzsubscript𝑝𝑧p_{z} states) is called as pΟ€subscriptπ‘πœ‹p_{\pi} orbital when the principal axis of the p𝑝p orbital is perpendicular to the direction of the bond. The pΟ€subscriptπ‘πœ‹p_{\pi} orbital is coupled with the t2​gsubscript𝑑2𝑔t_{2g} state of the Mn4+ at the point B1, since the Ο΅gsubscriptitalic-ϡ𝑔\epsilon_{g} state is empty. According to the Goodenough-Kamamori-Anderson rule,ref11 ; ref12 ; ref14 ; ref15 the interaction K0subscript𝐾0K_{0} is antiferromagnetic, since the pΟ€subscriptπ‘πœ‹p_{\pi} orbital is not orthogonal to the t2​gsubscript𝑑2𝑔t_{2g} orbital. If Ξ±=180βˆ˜π›Όsuperscript180\alpha=180^{\circ}, the pΟƒsubscriptπ‘πœŽp_{\sigma} orbital is coupled with the t2​gsubscript𝑑2𝑔t_{2g} orbital of the Mn4+ at the point B1 the interaction K0subscript𝐾0K_{0} is ferromagnetic, since the pΟƒsubscriptπ‘πœŽp_{\sigma} orbital is orthogonal to the t2​gsubscript𝑑2𝑔t_{2g} orbital.

The sign of K0subscript𝐾0K_{0} is dependent on the value of α𝛼\alpha. There may be a critical angle Ξ±csubscript𝛼𝑐\alpha_{c}. K0subscript𝐾0K_{0} is ferromagnetic for Ξ±>Ξ±c𝛼subscript𝛼𝑐\alpha>\alpha_{c} and K0subscript𝐾0K_{0} is antiferromagnetic for Ξ±<Ξ±c𝛼subscript𝛼𝑐\alpha<\alpha_{c}. Experimentally, the superexchange interaction J1subscript𝐽1J_{1} is antiferromagnetic for β𝛽\beta-MnO2, which means that K0subscript𝐾0K_{0} is ferromagnetic. The critical angle Ξ±csubscript𝛼𝑐\alpha_{c} is lower than 130.62∘superscript130.62130.62^{\circ}.

The direct cation-cation exchange interaction (J2subscript𝐽2J_{2}) is expected to be stronger than the superexchange interactions J1subscript𝐽1J_{1}. The competition between J1subscript𝐽1J_{1} and J2subscript𝐽2J_{2} can lead to a complicated compromise magnetic order; J2/J1=1.68469subscript𝐽2subscript𝐽11.68469J_{2}/J_{1}=1.68469 for β𝛽\beta-MnO2. Note that the discussion of Osmondref16 on the nature of J2subscript𝐽2J_{2} may be inappropriate.

X.4 Origin of superexchange interaction J3subscript𝐽3J_{3}

We consider the interaction between Mn4+ at the point A1 and the Mn4+ at the point A2, as shown in Figs.Β 20(a) and (b), where the distance A1A2 is 4.396​Å4.396italic-Γ…4.396\AA. According to Goodenough,ref11 ; ref12 this interaction (J3subscript𝐽3J_{3}) is a superexchange one (cation-anion-cation) since the cation-occupied octahedra share a common corner (point O4). The angle ∠∠\angleA1O4A2 is equal to Ξ±=111.60βˆ˜π›Όsuperscript111.60\alpha=111.60^{\circ}, the distance O4A2 is 3.343​Å3.343italic-Γ…3.343\AA, and the distance O4A1 is 1.878​Å1.878italic-Γ…1.878\AA. This interaction is experimentally antiferromagnetic for β𝛽\beta-MnO2; p3=J3/J1=0.537subscript𝑝3subscript𝐽3subscript𝐽10.537p_{3}=J_{3}/J_{1}=0.537. This means that the critical angle Ξ±csubscript𝛼𝑐\alpha_{c} is between 90∘superscript9090^{\circ} and 111.60∘superscript111.60111.60^{\circ}.

XI CONCLUSION

We have studied the phase diagram of (J2subscript𝐽2J_{2} vs J3subscript𝐽3J_{3}) with J1=βˆ’1subscript𝐽11J_{1}=-1 in the rutile type β𝛽\beta-MnO2 by using the equi-energy contour plot. The distribution of the magnetic Bragg peaks can be clearly visualized. The magnetic phase diagram consists of the multricritical point (the intersection J2​J3=J12subscript𝐽2subscript𝐽3superscriptsubscript𝐽12J_{2}J_{3}=J_{1}^{2} and J2+J3=2​J1subscript𝐽2subscript𝐽32subscript𝐽1J_{2}+J_{3}=2J_{1}), the helical order along the c𝑐c axis, the (h=1/2,k=0,l=1/2)formulae-sequenceβ„Ž12formulae-sequenceπ‘˜0𝑙12(h=1/2,k=0,l=1/2) phase, the helical order along the aπ‘Ža axis, and the phase (h=0,k=0,l=1)formulae-sequenceβ„Ž0formulae-sequenceπ‘˜0𝑙1(h=0,k=0,l=1). The phase transition is of the first order between the (h=1/2,k=0,l=1/2)formulae-sequenceβ„Ž12formulae-sequenceπ‘˜0𝑙12(h=1/2,k=0,l=1/2) phase and the helical order along the c𝑐c axis, and between the (h=1/2,k=0,l=1/2)formulae-sequenceβ„Ž12formulae-sequenceπ‘˜0𝑙12(h=1/2,k=0,l=1/2) phase and the helical order along the aπ‘Ža axis. The phase transition is of the second order between the phase (h=0,k=0,l=1)formulae-sequenceβ„Ž0formulae-sequenceπ‘˜0𝑙1(h=0,k=0,l=1) and the helical order along the c𝑐c axis, and between the phase (h=0,k=0,l=1)formulae-sequenceβ„Ž0formulae-sequenceπ‘˜0𝑙1(h=0,k=0,l=1) and the helical order along the aπ‘Ža axis.

Acknowledgements.
We are grateful to Prof. H. Sato for useful discussions on the itinerant nature of egsubscript𝑒𝑔e_{g} electrons in β𝛽\beta-MnO2.

References

  • (1) R.A. Erickson, Phys. Rev. 90, 779 (1953).
  • (2) A. Yoshimori, J. Phys. Soc. Jpn. 14, 807 (1959).
  • (3) N. Ohama and Y. Hamaguchi, J. Phys. Soc. Jpn. 30, 1311 (1971).
  • (4) M. Regulski, R.Przenioslo, I. Sosnowska, and J.-U. Hoffmann, Phys. Rev. B 68, 172401 (2003).
  • (5) M. Regulski, R.Przenioslo, I. Sosnowska, and J.-U. Hoffmann, J. Phys. Soc. Jpn.73, 3444 (2004).
  • (6) H. Sato, K. Wakiya, T. Enoki, T. Kiyama, Y. Wakabayashi, H. Nakano, and Y. Murakami, J. Phys. Soc. Jpn. 70, 37 (2001).
  • (7) H. Sato, Y. Kawamura, T. Ogawa, Y. Murakami, H. Ohsumi, M. Mizumaki, and N. Ikeda, Physica B 329 – 333, 757 (2003).
  • (8) H. Sato, T. Enoki, M. Isobe, and Y. Ueda, Phys. Rev. B 61, 3563 (2000).
  • (9) T. Nagamiya, Solid State Physics, edited by F. Seiz, D. Turnbull, and H. Ehrenreich, 20, 305 (Academic Press, New York,1967).
  • (10) H. Bizette and B. Tsai, Colloque sur la polarization de la matere cited by Lidiard (Paris, C.N.R.S., 1949) 164, Reports on Progr. in Phys. 17, 201 (1954).
  • (11) J.B. Goodenough, Phys. Rev.117, 1142 (1960).
  • (12) J.B. Goodenough, Magnetism and the Chemical Bond (John-Wiley & Sons, New York, 1963).
  • (13) J. Kanamori, J. Phys. Chem. Solid 10, 87 (1959).
  • (14) P.W. Anderson, Solid State Physics, edited by F. Seiz and D. Turnbull (Academic Press, New York and London, 1963) 14, 99.
  • (15) W.P. Osmond, Proc. Phys. Soc. 87, 335 (1966).