Suppression of the Shastry-Sutherland phase in Ce2Pd2Sn at a field induced critical point
Abstract
The magnetic phase diagram of Ce2Pd2Sn is investigated through the field dependence of thermal, transport and magnetic measurements performed at low temperature. The upper transition, K is practically not affected by magnetic field up to T, whereas the lower one rapidly increases from 2.1 K joining in a critical point at )K for T. At that point the intermediate phase, previously described as an unstable Shastry-Sutherland phase, is suppressed. A detailed analysis around the critical point reveals a structure in the maximum of the derivative which could be related to the formation of a novel phase in that critical region.
pacs:
75.20.Hr, 71.27.+a, 75.30.Kz, 75.10.-bI Introduction
Complex or metastable phases are favored in the proximity of magnetic transitions since, within the Landau theory, the change of sign of the first term of the free energy broadens its minimum as a function of the order parameter as . In these critical conditions the ’roughness’ of , occurring in real systems, may present relative minima which may become relevant in the formation of novel phases Kirchpat . In recent years an increasing number of magnetic systems exhibiting non trivial types of order parameters have been reported. Those complex phases may correspond to metastable ground states, such as frustrated or ’spin ice’ spinice systems, Shastry-Sutherland phases Shastry ; Miyahara or other exotic phases. Those phases can be tuned by non-thermal control parameters like pressure (e.g. in non conventional superconductors Macknezie ) or by magnetic field (e.g. in Sr3Ru2O7 Green ) and driven to a quantum critical points at HVL . Alternatively, some of those phases become unstable under moderate variation of the external parameters and are suppressed in a critical point at finite temperature.
Recently, the formation of an unstable Shastry-Sutherland ShSu phase was reported to form in Ce2Pd2Sn Ce2Pd2Sn . That phase is observed within a limited range of temperature, between K, having as the upper limit a correlated paramagnetic phase and a ferromagnetic FM one as ground state GS. This exotic phase builds up from FM-dimers formed by Ce nearest-neighbor atoms, and shows the onset of magnetic correlations at K. An antiferromagnetic AF exchange interaction between those dimers drives the formation of the ShSu phase, realized in this compound as a quasi 2D square lattice of effective spin below K Ce2Pd2Sn .
Stable ShSu phases are predicted for AF-dimers and AF inter-dimer interactions by theoretical calculations Miyahara . This scenario was recently observed in Yb2Pt2Pb single crystals Kim , which undergoes a slight shift of part of Pt atoms that results in two types of Yb-Pt tetrahedral sublattices. On the contrary, Ce2Pd2Sn presents a unique crystalline Ce-lattice where the mentioned exotic phase becomes unstable at K, undergoing a first order to its FM-GS. Neutron diffraction experiments Laffarge96 revealed a modulated character of this phase, with the local moments pointing in the ’c’ crystallographic direction. The incommensurate propagation vector changes from 0.11 (at 4.2 K) to 0.077 (at 2.8 K) where it suddenly drops to once the long range FM order parameter sets on.
Since the mentioned magnetic phase is unstable and only holds within a short range of temperature, the application of external field is expected to produce significant effects including its eventual suppression in a critical point. To our knowledge there are no systematic investigations of magnetic phase diagrams for Ce2T2X compounds (with T = Ni, Cu, Pd, Rh, Pt and X = Sn and In) performed yet. This is not a minor point since in the last years a big effort was done searching for critical points at very low temperature and magnetic field may fine tune the critical conditions. Furthermore, the scarce examples for FM critical points places the Ce2T2Sn family of compounds as good candidates for that current topic since it builds up from Ce atoms disposed in triangular prims mimiking those of CeT Gsch FM compounds.
Preliminary studies on the effect of the magnetic field Berisso on Ce2Pd2Sn showed that the upper transition is overcome by the lower one by applying moderate magnetic filed. In order to investigate the characteristics of that critical region, we have performed a detailed investigation of the magnetic field effects on the low temperature thermal, magnetic and transport properties of this compound. Such a study allows to assemble a magnetic phase diagram including the critical point where the intermediate phase is suppressed.
II Experimental details and results
Details of sample preparation were described in a previous paper Ce2Pd2Sn . Structural characterization confirms the single phase composition of the sample in a tetragonal Mo2FeB2-type structure with and lattice parameters. The actual composition of the sample was determined to be Ce2.005Pd1.988Sn0.997 after SEM/EDAX analysis.
Specific heat was measured using the heat pulse technique in a semi-adiabatic He-3 calorimeter in the range between 0.5 and 20K, at zero and applied magnetic field up to 4T. DC-magnetization measurements were carried out using a standard SQUID magnetometer operating between 2 and 300K, and as a function of field up to 5T. Electrical resistivity was measured between 0.5K and room temperature using a standard four probe technique with an LR700 bridge.
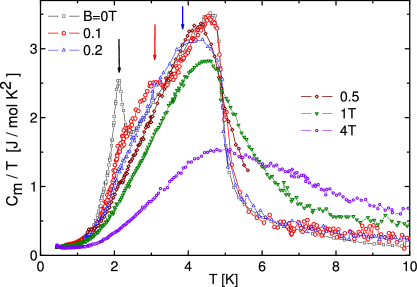
As shown in Fig. 1, the magnetic field affects quite differently the specific heat anomalies of both transitions. While the temperature of the lowest ( K) rapidly increases with field, the upper one ( K) reminds practically unaffected up to T. The well defined first order transition at transforms into a broaden anomaly by the effect of applied field, which extends between K for T, see Fig. 1. Such a broadening can be explained by the poly-crystalline nature of the sample since the crystals are randomly oriented between the easy and hard directions of magnetization. This random orientation yields to a continuous distribution of transitions according to the respective projections of the crystals respect to the magnetic field.
The fact that the jump of the specific heat remains unaffected and the temperature of the maximum value of (at ) does not decrease up to T are further evidences that the upper transition cannot be considered as AF in a canonical sense. Nevertheless, the cusp of at that temperature reveals that some type of AF interactions play some role in the magnetic structure below . The lack of variation of for fields T indicates that the arguments used in Ref.Ce2Pd2Sn to recognize the formation of Ce-Ce pairs remains valid at low field. At higher field (i.e. ) the maximum value of starts to decrease with a concomitant broadening of the anomaly, see Fig. 1. Such a behavior indicates that an induced ferromagnetic state sets in, which at T clearly tends to a Schottky-type anomaly.
According to the behavior depicted in Fig. 1, the temperature dependence of the magnetic entropy gain reduces its thermal increase as the external field increases. Independently of that reduction, reaches the full expected value of 2RLn2 at K even for . For highest measured field (c.f. T) only 80% of the total entropy of the doublet GS is reached at that temperature (c.f. our upper limit of temperature).
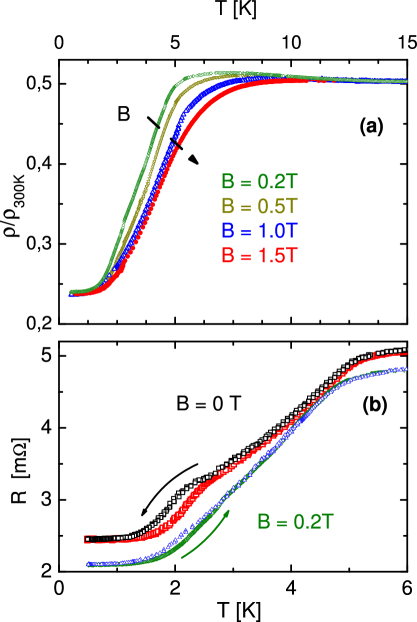
measurements, shown in Fig. 2a, indicate that magnetic correlations above are progressively quenched by magnetic field and the transition itself is smeared once the applied field induces the FM behavior. Concerning the lower transition, the hysteresis is strongly weakened in a field of 0.2 T in agreement with the specific heat results, see Fig. 2b. This means that the first order transition vanishes above that field.
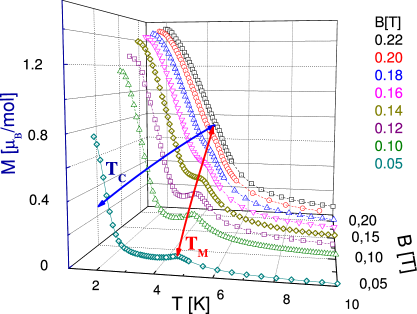
The dependence of was measured under different applied fields, starting from T. Between 0.1 T and 0.22 T the isodyna curves were measured with steps of 0.02 T as shown in Fig. 3. This study shows how the FM phase overcomes the modulated one, being the boundary of the former determined by the maximum slope of (i.e. ) and that of the later by the cusp at at (). Both phase boundaries are depicted in the phase diagram of Fig. 6 by respective curves which join at a critical point.
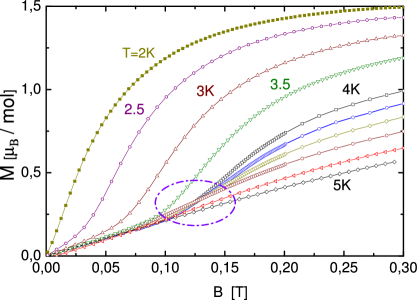
Isothermal measurements were performed within the K range of temperature up to T. In Fig. 4 we present the low field magnetization curves, with the typical FM dependence at K, including a weak hysteresis (not shown for clarity) between increasing and decreasing field. Above the transition (i.e. K), shows an S-shape dependence indicating that a re-arrangement of the magnetic structure occurs as a broad field induced meta-magnetic transformation. Such a broadening is attributed to the randomly distribution of the magnetic directions in this poly-crystalline and strongly anisotropic compound. Interestingly, curves start to intersect each other between 4 K and 4.7 K, see the remarked region in the figure around 0.12 T. This suggests that some anomalous variation of the magnetization occurs close to the critical field at that temperature range.
III Discussion
A simple thermodynamic analysis of the field effect on the thermal dependence of the specific heat allows to extract some trends concerning the magnetic behavior of the system. From Fig. 1, one sees that at low field ( T) slightly increases below and consequently computed as . From Maxwell relations, such increase of corresponds to the observed increase of as since . On the contrary, at higher fields (i.e. T) an induced FM behavior is reflected in a strong decrease. This change of behavior reveals that the apparent AF character of the intermediate phase is overcome by a FM behavior around 0.2 T.
Since the specific heat jump is progressively smeared by the mentioned random orientation of individual crystals and the maximum slope of is not properly defined, to determine the phase boundary between the magnetic phases for a phase diagram construction requires to use a precise procedure. For such a purpose we have analyzed the field dependence of the isothermal derivative between 2 K and 5 K. From Fig.5a one may extract the maximum slope of this derivative, which is related with the maximum curvature of the dependence (see Fig. 4) and provides a better approach for determining the field at which the induced FM phase sets in.
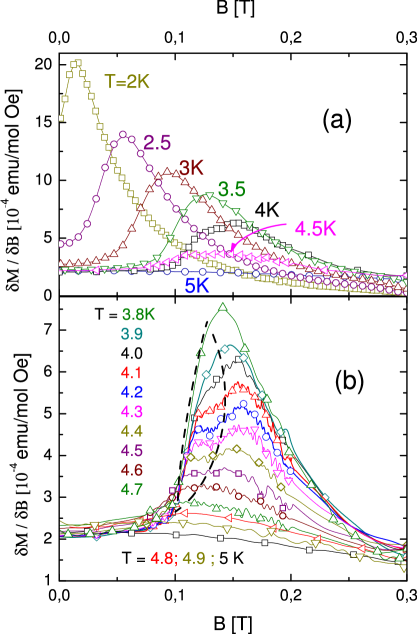
Also in Fig.5a one can see well defined maxima of isotherms as a function of field, whose intensity decreases as the temperature increases. Approaching the critical point, each maximum splits into two maxima hardly distinguish in the 4.5 K isotherm. To elucidate the real existence of a structure within that narrow range of field and temperature, we have performed detailed measurements of between 3.8 K and 4.7 K up to T.
Those results are presented in Fig.5b. Within that range of temperature one may distinguish between a main slope of , practically fixed at T, and a second contribution which arises up to T at K, see dashed curves in Fig.5b. Above that temperature the satellite maximum progressively vanishes, disappearing at K. Such a split of the derivative might be due to the formation of a field induced phase when the point is approached. This feature my be related to one of the predictions for the ShSu lattice, that is the appearance of a plateaux in the magnetization at 1/4, 1/8 and 1/10 of the full saturated moment, as different ordered states emerge from the initially frustrated spin liquid through the application of magnetic field Miyahara .
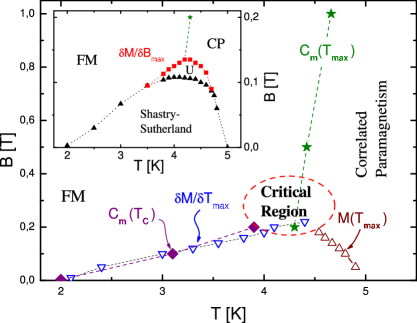
The obtained magnetic phase diagram is presented in Fig.6. There, the field driven transition between intermediate and FM phases is drawn according to the temperature of the maximum slope , which is in agreement with measurements. Since is practically not affected by field, both phase boundaries join at a critical point, at )K for )T.
In the inset of Fig. 6 we show a detail of the critical region extracted from the maximum slopes of the derivatives depicted in Fig.5b. As mentioned before, the structure observed in the as a function of field may correspond to one of the steps predicted in the dependence, which in this case corresponds to of the saturated moment . The weakness of this effect can be attributed to the poly-crystalline character of the samples.
As proposed in Ref.Ce2Pd2Sn for , Ce nearest-neighbors form FM pairs with effective spin which define a simple square lattice lying parallel to the basal plane. A ShSu phase builds up from those dimers at , which interact antiferromagnetically among them. From the present results we observe that dimers keep forming under moderate external field. However, the fact that the jump and the height of the maxima decrease as indicates that the degrees of freedom involved in the formation of the intermediate phase are progressively reduced by increasing magnetic field.
IV Conclusions
The field dependent magnetic phase diagram was established for Ce2Pd2Sn. The application of magnetic field confirms that the transition at cannot be regarded as a canonical AF transition since is practically not affected by fields of moderate intensity. On the contrary, the low temperature FM phase is favored by field since the AF interaction among dimers in the intermediate phase is progressively suppressed.
The instability of the intermediate Shasry-Sutherland phase in this compound is confirmed by the low value of applied field T required for its suppression. Around the critical region, a weak structure is observed in the maximum of dependence at , which may be an expected sign for the mentioned phase. In any case, further investigations are required in order to elucidate whether this anomalous feature, extending between K and T, confirms the presence of a ShSu phase or it is due to some other effect.
Other studies are in progress in this family of compounds with the aim to tune this critical point by doping Ce ligands or alloying them out of stoichiometry taking profit of the extended range of solubility of these compounds Mauro
Acknowledgments
We acknowledge J. Luzuriaga and K. Ogando for their contribution to magnetic measurements. This work was partially supported by PIP-6016 (CONICET) and Secyt-UNC project 6/C256. J.G.S. and M.G.B. are members of CONICET and Instituto Balseiro (UN Cuyo) of Argentina.
References
- (1) T.R. Kirkpatric and D. Belitz, Phys. Rev. B 67 024419 (2003).
- (2) R. Higashinaka, H. Fukazawa, K. Deguchi, Y. Maeno, Jour. Phys. Soc. Japan 73] 2845 (2004).
- (3) B.S. Shastry and B. Sutherland; Physica 108B 1069 (1981).
- (4) S. Miyahara and K. Ueda; Phys. Rev. Lett. 82 3701 (1999).
- (5) A.P. Mackenzie and S.A. Grigera; Science 309 1330 (22005).
- (6) A.G. Green, S.A. Grigera, R.A. Borzi, A.P. Mackenzie, R.S. Perry, B.D. Simons, Phys. Rev. Lett. 95 086402 (2005)
- (7) H.v.Löhneysen, A. Rosch, M. Vojta, P. Wölfe, Rev. Mod. Phys. 79 1015 (2007).
- (8) J.G. Sereni, M. G.- Berisso, A. Breghta, G. Schmerber and J.P. Kappler, Phys. Rev. B 80 024428 (2009).
- (9) M. S. Kim, M.C. Bennett and M.C. Aronson; Phys. Rev. B 77 144425 (2008).
- (10) D. Laffarge et al., Solid State Commun. 100 575 (1996).
- (11) see for example: J.G. Sereni, in Handbook for Physics and Chemistry of Rare Earths, edited by K.A. Gschneidner Jr. and L. Eyring (Elsevier Science B.V, Amsterdam, 1991), Vol 15, Chap. 98.
- (12) M. G mez Berisso, J.G. Sereni, A. Braghta, G. Schmerber, B. Chevalier, J.P. Kappler; Physica B 404 2930 (2009).
- (13) D. Vollhardt, Phys. Rev. Lett. 78 1307 (1997).
- (14) M. Giovannini, H. Michor, E. Bauer, G. Hilscher, P. Rogl, T. Bonelli, F. Fauth, P. Fischer, T. Hermannsdorfer, L. Keller, W. Sikora, A. Saccone, R. Ferro, Phys. Rev. B 61 4044 (2000).