Survival of Star-Forming Giant Clumps in High-Redshift Galaxies
Abstract
We investigate the effects of radiation pressure from stars on the survival of the star-forming giant clumps in high-redshift massive disc galaxies, during the most active phase of galaxy formation. The clumps, typically of mass and radius , are formed in the turbulent gas-rich discs by violent gravitational instability and then migrate into a central bulge in dynamical times. We show that the survival or disruption of these clumps under the influence of stellar feedback depends critically on the rate at which they form stars. If they convert a few percent of their gas mass to stars per free-fall time, as observed for all local star-forming systems and implied by the Kennicutt-Schmidt law, they cannot be disrupted. Only if clumps convert most of their mass to stars in a few free-fall times can feedback produce significant gas expulsion. We consider whether such rapid star formation is likely in high-redshift giant clumps.
keywords:
galaxies: formation — galaxies: ISM — galaxies: star clusters: general — galaxies: star formation — ISM: clouds — stars: formation1 Introduction
A significant fraction of the massive galaxies, in baryons, during the period from when star formation is at its peak and most stellar mass is assembled (Hopkins & Beacom, 2006; Magnelli et al., 2009), form stars at high star formation rates (SFR) of . Many of these are turbulent, gas-rich, extended rotating discs in which much of the star formation takes place in a few giant clumps (Cowie et al., 1995; van den Bergh et al., 1996; Elmegreen et al., 2004a, 2005, 2007). Based on this morphology, they were first termed “chain” or “clump-cluster” galaxies. In a typical galaxy of this type, of the UV rest-frame light is emitted from a few clumps of characteristic size that form stars at tens of each (Elmegreen et al., 2004b, 2005; Förster Schreiber et al., 2006; Genzel et al., 2008). These clumps are much more massive than the star-forming complexes in local galaxies. The star formation in these clumps, and their survival subject to stellar feedback, are central to our understanding of galaxy formation.
Kinematically, most of the galaxies that host the clumps are thick rotating discs, with high velocity dispersions of (one dimensional), compared to is present-day discs; they have rotation to dispersion ratios of (Cresci et al., 2009). Estimates of the total gas fraction in star-forming galaxies, based on CO measurements, range from 0.2 to 0.8, with an average of (Tacconi et al., 2008; Daddi et al., 2008, 2009), systematically higher than the typical gas fraction in today’s discs. These properties are generally incompatible with these systems being ongoing major mergers or remnants of such mergers (Shapiro et al., 2008; Bournaud et al., 2008; Dekel et al., 2009a; Bournaud & Elmegreen, 2009; Dekel et al., 2009b), though there may be counter examples (Robertson & Bullock, 2008).
Instead, giant clumps form through a scenario, summarized by Dekel et al. (2009b), in which massive galaxies at are fed by a few narrow and partly clumpy streams of cold gas (K) that flow along the dark matter filaments of the cosmic web (e.g. Hahn et al., 2007) and penetrate deep into the centres of the massive dark matter haloes of (Birnboim & Dekel, 2003; Kereš et al., 2005; Dekel & Birnboim, 2006; Ocvirk et al., 2008; Dekel et al., 2009a). Indeed, the existence of these streams is an inevitable prediction of the standard CDM cosmology. They may produce the structures we observe as Lyman-alpha blobs (Furlanetto et al., 2005; Goerdt et al., 2009; Dijkstra & Loeb, 2009). The angular momentum they carry leads the accreted material to form a disc of radius . The continuous intense input of gas at the level of maintains a high gas surface density , which drives a violent gravitational instability with a Toomre Q parameter below unity, , where is the one-dimensional velocity dispersion and is the angular velocity associated with the potential well (Toomre, 1964). The disc instability is self-regulated at by the gravitational interactions in the perturbed disc, which keep the disc thick and with a high velocity dispersion. The disc forms strong, transient spiral features that fragment to produce 5-10 bound clumps, that together comprise of the disc mass. The largest clumps have characteristic radii kpc, and characteristic masses of a few percent of the disc mass, . A spectrum of smaller clumps with somewhat lower masses forms as well. The clumps’ large masses cause them to migrate to the centre of the disc on a short time scale of disc crossing times, where they merge into a central bulge (Noguchi, 1999; Immeli et al., 2004a, b; Bournaud et al., 2007; Ceverino et al., 2009; Agertz et al., 2009). This violent instability phase can last for more than a gigayear, during which the mass flow from the disc to the bulge is replenished by fresh accretion, keeping the mass within the disc radius divided quite evenly between disc, bulge and dark matter components.
While this scenario of clump formation and migration to build up bulges is appealing, it relies on the ability of clumps to survive for disc dynamical times, i.e. a few hundred million years, while the gas in them turns into stars on a comparable timescale (Genzel et al., 2008; Dekel et al., 2009b; Ceverino et al., 2009). However, at the SFR of a few tens of solar masses per year in the clumps, it is possible that they might be disrupted by stellar feedback on considerably shorter timescales. Murray et al. (2009) argue for exactly this scenario. In their models, clumps disrupt after dynamical time, during which they turn only of their mass into stars. In this picture clumps would not survive long enough to migrate, and bulges would instead need to be built up by mergers. While this scenario seems difficult to reconcile with the estimated ages of a few hundred Myr for the oldest stellar populations in some clumps (Elmegreen et al., 2009a; Förster Schreiber et al., 2009), there is sufficient uncertainty in both the observational estimates of clump ages and the theoretical modeling of clump evolution and disruption to merit a re-investigation of the problem, which we provide in this paper.
The outline of the paper is as follows. In §2 we derive the expected gas ejection fraction as a function of SFR efficiency. In §3 we address the observational estimates of the SFR efficiency. In §4 we discuss some of the issues raised by our results and compare to previous work. We summarize our conclusions in §5.
2 Radiative Feedback and Clump Survival
Consider a uniform-density giant gas clump of mass , radius , and surface density . It forms stars at a rate , and the stars formed within it have a combined luminosity . (We defer discussing the effect of sub-clumping within giant clumps to § 3.3, since it does not change the qualitative result.) Characteristic numbers to keep in mind for the largest, best-observed clumps, found in galaxies with baryonic masses , are , kpc, and g cm-1. Clumps in the galaxies, which are more common, have masses and sizes that are at or below the resolution limit of present observations. We will assume that they have surface densities comparable to those their larger cousins; they cannot be much smaller, since the mean column densities of the galactic disks as a whole is g cm-2. We wish to evaluate the fraction of clump mass that will be ejected by stellar feedback and the fraction that is transformed into stars, because this is the critical parameter that determines whether the clump will form a bound stellar system. Both N-body simulations and analytic models (e.g. Hills, 1980; Kroupa, 2001; Kroupa & Boily, 2002; Baumgardt & Kroupa, 2007) indicate that if , then most of the stellar mass will remain bound, while if then no bound stellar system will be left. Small portions of the clump where was locally higher may form bound clusters, but these will be orders of magnitude smaller than the initial clump.
Several common feedback mechanisms are not important for giant clumps in the relevant mass range. First, supernova feedback is unlikely to be effective in ejecting mass from these giant clumps, due to cooling and leakage of hot gas (Dekel et al., 2009b; Krumholz & Matzner, 2009; Murray et al., 2009). Second, the pressure of warm ( K) ionized gas is ineffective because the escape velocity from the clump is larger than the gas sound speed of km s-1. Third, protostellar outflows are unable to eject mass because they do not provide enough momentum (Fall et al., 2010). Instead, the dominant feedback mechanism is likely to be radiation pressure from newly-formed stars, which creates a radiation-dominated H ii region. The expansion of such a region follows a similarity solution (Krumholz & Matzner, 2009), and Fall et al. (2010) use this solution to show that all the remaining gas will be ejected once the fraction of gas mass transformed into stars reaches a value
| (1) |
where
| (2) |
is a constant of order unity that depends on the density distribution within the clump, is the light to mass ratio of the stellar population, represents the factor by which the radiation force is enhanced by trapping of re-radiated infrared light within the expanding shell, and is a parameter of order unity that describes the critical velocity required to eject mass from the cloud. Fall et al. (2010) assume fiducial values of and for the local star-forming regions, and we adopt the same values here since there is no obvious reason for them to be systematically different in the case of giant clumps at redshift 2. We refer to as the final star fraction.111Note that this is sometimes referred to as star formation efficiency as well, but we avoid the term efficiency because it does not have a standard meaning, and different authors use it for different concepts.
To determine the light to mass ratio, we must deal with the complication that the characteristic crossing time of a giant clump is rather long, Myr, where and . Depending on the exact values of and , this can be either greater than or less than the main-sequence lifetime of massive stars. Thus we can neither assume a single burst, so that all stars are coeval, nor continuous star formation, so that the population is in equilibrium between new stars forming and old ones evolving off the main sequence. However, we can treat these scenarios as two limiting cases, which must bracket any real stellar population. Krumholz & Tan (2007) point out that in stellar populations younger than 3 Myr, where no stars have left the main sequence yet, the light-to-mass ratio has a constant value, , for which we adopt erg s-1 g-1 (Fall et al., 2010). Once a stellar population is old enough to reach statistical equilibrium between star formation and star death, it instead has a nearly constant luminosity-to-star-formation rate ratio, , which we take to be erg g-1 (Krumholz & Tan, 2007). For any realistic stellar population whose light is dominated by young, massive stars as opposed to old ones, the luminosity is roughly equal to the smaller of these two limits, and for simplicity we simply take the light-to-mass ratio to be
| (3) |
We refer to the first case as the “young stars” limit and the second as the “old stars” limit, since they represent the opposite extremes of stellar populations that have undergone no evolution and populations that are old enough to have reached equilibrium between star formation and stellar evolution.
Substituting these two light-to-mass estimates into equation (1) gives
| (4) |
where
| (5) |
is the critical density evaluated in the young-stars limit and is the depletion time, i.e. the time that would be required to convert all of the gas into stars. The numerical evaluation in equation (5) is for the fiducial parameters of Fall et al. (2010). Note that this expression is a maximum rather than a minimum because is a decreasing function of .
Following Krumholz & McKee (2005), we define the dimensionless star-formation rate efficiency as the ratio between the free-fall time and the depletion time222Note that the rate efficiency that we have defined here is distinct both from the star formation rate, which has units of yr-1 and is not normalized by the ratio of mass over free-fall time, and the final stellar mass fraction , which is dimensionless but does not carry any information about the star formation rate., namely
| (6) |
Krumholz & Tan (2007) show that across a very broad range of densities, size scales, and environments. Here we define the free-fall time as , where is the gas density. We discuss in § 3 below whether this value of applies in high- giant clumps. If we adopt it for now and make this substitution in equation (4), we find that
| (7) | |||||
| (8) |
where , , and the numerical evaluation uses the fiducial parameters from Fall et al. (2010). We use Equation (8) to plot as a function of in Figure 1.
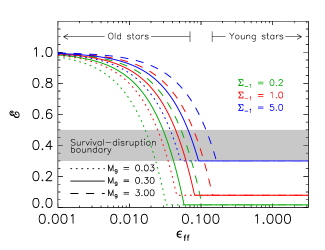
What does this result imply for the survival of high- giant clumps? We note that the second term in brackets in equation (8), corresponding to the case of a stellar population older than Myr, is generally the one that applies for giant clumps. This reflects the fact that the crossing time for our fiducial values of the parameters is 15 Myr, which is significantly larger than 3 Myr. The young stellar population limit applies only if the star formation rate efficiency is much higher than is observed in any star-forming systems anywhere in the local universe, , or if the star-forming systems are significantly less massive or much more dense. This makes high- giant clumps very different from Galactic star clusters or even super-star clusters, such as those found in local starburst galaxies, e.g. the Antennae or M82. These have lower masses and higher surface densities, with crossing times Myr (e.g. McCrady & Graham, 2007), placing them firmly in the young-star limit. Indeed, the first term in the brackets is identical to that derived by Fall et al. (2010) for local star-forming clumps.333To get numerical agreement in the coefficient of , we must adjust by a factor of to account for measuring the escape velocity at the surface instead of at the half-mass radius.
We conclude that unless for giant clumps, as opposed to for the local star-forming systems, star-forming clumps with masses and surface densities g cm-2 cannot be disrupted by radiation pressure — so they end up converting most of their mass to stars. Thus, the expulsion fraction relevant for high- giant clumps, as derived in the old-star limit, is
| (9) |
Since , we expect the resulting stellar systems to remain gravitationally bound. Clumps with have and suffer significant disruption only if their masses are below , and they reach and undergo complete disruption only at masses . Thus the observed giant clumps in high galaxies should survive disruption unless . Even if we are maximally conservative and assume that the smaller clumps have , i.e. that their surface densities do not exceed the mean surface densities of their host galaxies, our estimated maximum mass for disruption only increases by a factor of 2.
3 The Star Formation Rate Efficiency in High-z Clumps
Equation (9) shows that the most important parameter in determining the survival of giant clumps is how quickly, normalized to their free-fall times, they turn themselves into stars. Only if they do so with a very high rate efficiency, , do we expect significant gas expulsion. In the local universe, one measures by determining the star formation rate of an object or a population of objects, and comparing this to the objects’ gas mass divided by the free-fall time computed for their density. This procedure was first applied by Zuckerman & Evans (1974) to the population of giant molecular clouds in the Milky Way, and has subsequently been extended to other objects by Krumholz & Tan (2007) and Evans et al. (2009). These measurements give over a very wide range of star-forming environments, from small star clusters in the Milky Way to entire starburst galaxies. The results are subject to considerable uncertainty, but values are strongly excluded by the data. However, we lack comparable data for star formation at high redshifts. In this section, we therefore turn to the question of the likely value of in high- giant clumps.
3.1 Estimates of from Observations of Giant Clumps
Unfortunately, we cannot easily apply the direct measurement procedure used to determine in the local universe to the high- clumps, because, while we can evaluate star-formation rates using H luminosities, we are limited in our ability to measure the corresponding gas properties.
For example, Elmegreen et al. (2009b) use stellar population synthesis to estimate masses and ages for the stellar populations seen in giant clumps in high- galaxies, and they then compare the ages to the clump dynamical times, defined as , where is taken to be the stellar mass density. They find typical values , corresponding to , with a factor of scatter. It is tempting to identify with and simply estimate , but this is likely to be a significant overestimate. Based on dynamical mass estimates, Genzel et al. (2008) estimate that gas comprises 10-30% of the total mass within the disc radius. Estimates based on direct CO measurements indicate gas fractions of at (Daddi et al., 2009; Tacconi et al., 2010). It is likely to be an even larger fraction of the mass within the dense, rapidly star-forming giant clumps, which are self-gravitating and lack a dark matter component. If the stars measured by Elmegreen et al. comprise only a small fraction of the total mass in clump, then will be reduced by a factor of roughly relative to the previous estimate – one power of to account for the gas that has not yet formed stars, and another factor of because the free-fall time will be shorter than the value Elmegreen et al. estimate based on the stars alone. To give a sense of the possible magnitude of the error, note that Murray et al. (2009) estimate for a giant clump in BX 482 (and we argue in Section 4.2 that is probably even smaller), and this value of would be sufficient to lower the estimate of by a factor of 10, to . A secondary worry is that, as Elmegreen et al. point out, since the clumps are selected using rest-frame blue light there is a strong bias against selecting older, redder clumps, causing an underestimate of . In general, is expected to be an underestimate of because the former refers only to the stars that have already formed.
Given this problem, many observers have attempted to estimate gas masses via the “inverse” Kennicutt (1998) law, namely by measuring the SFR surface density and then assuming that the gas surface density has the value required for the object to obey the Kennicutt law (e.g. Genzel et al., 2006, 2008). Unfortunately this procedure does not yield an independent estimate of . The Kennicutt relation is
| (10) |
with yr-1 kpc-2. Thus if the scale height of the galaxy is , then the midplane gas density is , the free-fall time is , and we have
| (11) |
where and yr-1 kpc. The true value of is almost certainly a bit smaller than this, since star-forming clouds have densities higher than the mean midplane density, and thus smaller free-fall times. Nonetheless, this calculation illustrates a crucial point: to the extent that galactic scale heights do not have a very large range of variation (and the dependence is only to the 0.5 power), the statement that is roughly equivalent to the Kennicutt law. (See Krumholz & McKee 2005 and Schaye & Dalla Vecchia 2008 for a more detailed discussion of the relationship between volumetric and areal star formation laws.) Thus, no measurement of the gas surface density that assumes the Kennicutt law a priori can produce a value of significantly different from this. Any measurement of that did yield a significantly larger value would necessarily place the galaxy well off the Kennicutt relation.
3.2 Estimates of from Observations of Clump Host Galaxies
Given the difficulties of estimating in giant clumps directly, we instead turn to indirect inferences, based on the more robust measurements of the overall disc properties. We first note that the observed correlation between total gas mass and total star-formation rate in high- galaxies (e.g. Carilli et al., 2005; Greve et al., 2005; Gao et al., 2007) is consistent with these galaxies having the same value of as local star-forming systems (Krumholz & Thompson, 2007; Narayanan et al., 2008a, b). Bothwell et al. (2009) have claimed to detect a deviation from a universal star formation law in spatially resolved observations of three systems. However, Bothwell et al. obtain this result only because they choose a non-standard conversion factor between CO luminosity and mass, which leads them to conclude that the gas fraction in these systems is only , much lower than in typical star forming galaxies at , and on the low side even for local star-forming galaxies. Tacconi et al. (2010), using a standard conversion factor, conclude instead that these galaxies have molecular gas fractions of . This is consistent with the star formation law and the value of at being the same as in the local universe.
We can also approach the problem more theoretically. The high- clumps discs with which we are concerned have SFR , baryonic mass , and disc radius . We first express the relevant quantities in Equation (9) as a function of the clump mass , surface density , and SFR . The free-fall time (which is times the crossing time ), expressed in yr, is
| (12) |
Then
| (13) |
where is the SFR in a clump in .
Now let us express the clump quantities in terms of the disc mass, surface density, and total SFR. The disc surface density is
| (14) |
where is the disc radius measured in units of 10 kpc. The virialized clumps can be assumed to have collapsed by at least a factor 2 in radius, so the clump surface density is times larger than the disc’s, or
| (15) |
with .
Assume that a fraction () of the disc mass is in () identical clumps and a fraction () of the SFR is in the clumps (Dekel et al., 2009b; Ceverino et al., 2009). Then
| (16) |
and
| (17) |
Substituting the last three expressions in eq. (13) we obtain in terms of the disc quantities
| (18) |
Note the very weak dependence on . We see that the most straightforward observational estimates for the massive clumpy discs at (e.g. the BzK galaxies, Genzel et al., 2008) yield and , i.e. no significant expulsion.
This estimate is based on the observed properties of galaxies over a relatively narrow range of galaxy masses and redshifts, but using simple theoretical arguments we can deduce how the results are likely to scale to other galaxies for which we currently lack direct observations. For a self-gravitating disc, the circular velocity is roughly , so , namely
| (19) |
A constant () is consistent with the SFR being a constant fraction of the baryon accretion rate, because the latter is roughly proportional to halo mass (Neistein et al., 2006; Birnboim et al., 2007):
| (20) |
The fact that the SFR follows the accretion rate is a natural result of the fact that the SFR is proportional to the mass of the available gas (Bouche et al., 2009; Dutton et al., 2009), and is consistent with the finding from simulations when compared to observed SFR (Dekel et al., 2009a). We learn that is only weakly dependent on .
The redshift dependence at a given halo mass, using and , is
| (21) |
The system can adjust the SFR to match the rate of gas supply by accretion with at all times by slight variations in the contraction factor . At higher redshift, the clumps should contract a bit further and form stars at a somewhat higher surface density.
3.3 Sub-Resolution Clumping
Our discussion of clump survival in the preceding sections is based on the assumption that giant clumps represent single star-forming molecular clouds, although we of course expect them to possess significant substructure, as do local molecular clouds. These substructures are unresolved by current observations and by simulations. Here we discuss how their presence affects our conclusions.
First note that, for this purpose, we do not care whether any sub-clumps within the giant clumps themselves survive star formation feedback and form bound stellar clusters. To see why, consider an extreme case in which all the sub-clumps within the giant clump expel most of their gas, and thus do not leave behind bound remnants. This is what we might expect to happen if all the sub-clumps had surface densities similar to that of their parent giant clump, but had masses well below the minimum survival mass that we computed in § 2. In this case the sub-clumps would all form stars, expel their gas, and disperse, but both the stars and the expelled gas would still remain trapped within the much larger gravitational potential well of the giant clump. They could escape from this potential well only if the giant clump as a whole were disrupted by gas expulsion, which we have already shown in § 2 will happen only if is much larger than the expected value. Thus the end result of this scenario would be a bound giant star cluster without any bound sub-clusters inside it.
At the opposite extreme, suppose that all the sub-clumps were to remain bound and undergo negligible gas expulsion. We might expect this scenario if the sub-clumps all had surface densities much higher than that of their parent giant clump. In this case the sub-clumps would convert most of their mass to stars, forming bound clusters. All the bound clusters would irradiate the remaining mass in the giant clump, imparting momentum to it. If the stars imparted enough momentum, this gas would be expelled. Assuming most of the mass were in the inter-clump medium, as is the case for local molecular clouds, this expulsion would unbind the giant clump, producing many small individually bound clusters that are not bound to one another. Conversely, if the imparted momentum were not sufficient to unbind the giant clump, as we expect, the result would be a giant star cluster consisting of many smaller bound clusters, all gravitationally bound to one another.
In either extreme scenario, whether or not sub-clumps survive does not make any difference to whether a giant clump as a whole survives. This is dictated solely by the expulsion fraction from the giant clump. However, sub-clumping still could make a difference for giant clump survival by raising the value of . In this case the sub-clumps would still have , but the giant clump would have because it would have the same star formation rate but a much lower mean density, and thus a longer free-fall time.
To see whether this is likely to happen, we note that the turbulent motions within a giant clump are likely to break it up into smaller sub-clumps, much a local molecular clouds are broken up into clump, filamentary structures by turbulence. In such a configuration, a majority of the mass is at a density higher than the volumetric mean density that we have computed, and would therefore have a shorter free-fall time and a higher star formation rate. Quantitatively, we have computed the star formation rate as , where is the total mass of the giant clump, is its volume-averaged density, and is the free-fall time computed at that density. However, if most of the mass is at a density , the appropriate mass might be the mass above that higher density, and the appropriate timescale might be computed for that density. While one might worry that this could be a significant effect, Krumholz & Thompson (2007) point out that it is in reality quite small. Turbulent systems generally have lognormal density distributions. For such a distribution, the fraction of the cloud mass with density greater than is given by
| (22) |
where , is the volumetric mean density, and is the dispersion of the density distribution. This is related to the Mach number of the turbulence by , where is a constant of order unity (Padoan & Nordlund, 2002; Federrath et al., 2008). For , the range of values expected for the Mach numbers found in giant clumps, the quantity varies by only a factor of a few over a range of densities . Thus even if most of the mass is at a density vastly larger than the mean density we have used, as long as the mass distribution follows the lognormal form expected for supersonic turbulence, the star formation rate will not be modified significantly from our estimate using the volume-averaged density.
4 Discussion
4.1 Turbulence and Energy Balance in Giant Clumps
Our finding that the fraction of gas ejected from giant clumps depends critically on their dimensionless star-formation rate efficiency naturally leads to the question of how this quantity is set, and whether the physical processes responsible for setting in the local universe might determine a different value in high-redshift clumps. Krumholz & McKee (2005) show that, as long as the gas in a molecular cloud is supersonically turbulent with a velocity dispersion comparable to the cloud’s virial velocity, as is observed to be the case in all molecular clouds in the local universe, is the inevitable consequence. In contrast, in the absence of supersonic turbulence, simulations find that clouds undergo a rapid global collapse in which they convert all their mass into stars in roughly a dynamical time, i.e. (e.g. Nakamura & Li, 2007; Wang et al., 2009).444 This can be avoided if clouds are magnetically subcritical (e.g. Nakamura & Li, 2008), but magnetic fields in the early universe are likely to be weaker than those in the local universe, and even in the local universe clouds do not appear to be subcritical in typical clouds (Crutcher et al., 2009). Thus, a value of may be expected in high- giant clumps only if they maintain the level of turbulence required to avoid rapid, global collapse.
Whether the turbulence can actually be maintained is somewhat less clear. Simulations show that supersonic turbulence decays in roughly one cloud-crossing time (e.g. Stone et al., 1998; Mac Low et al., 1998; Mac Low, 1999), so global collapse can be avoided only if this energy is replaced on a comparable timescale. In local, low-mass star-forming clouds ( ), observations (Quillen et al., 2005), simulations (Nakamura & Li, 2007; Wang et al., 2009), and analytic theory (Matzner, 2007) all suggest that protostellar outflows can supply the necessary energy. In local giant molecular clouds with masses of , H ii regions driven by the pressure of photoionized gas are likely to be able to supply the necessary energy (Matzner, 2002; Krumholz et al., 2006). However, neither of these mechanisms are effective for clumps with and , because they do not provide enough momentum input and because they are overwhelmed by radiation pressure (see Figure 2 of Fall et al. 2010).
Supernova feedback (Dekel & Silk, 1986) does not appear to be a likely candidate to drive the turbulence either. Supernovae do not provide enough power to drive the observed level of turbulence (Dekel et al., 2009a), and analytic calculations (Harper-Clark & Murray, 2009; Krumholz & Matzner, 2009), numerical simulations of isolated disk galaxies (Tasker & Bryan, 2008; Joung et al., 2009), and numerical simulations of galaxies in cosmological context (Ceverino & Klypin, 2009) all indicate that supernova-heated gas is likely to escape through low-density holes in the molecular gas without driving much turbulence.
Contrary to this conclusion, Lehnert et al. (2009) use the observed correlation between H surface brightness and linewidth in galaxies to argue that supernova feedback is responsible for driving the turbulence, based in part on simulations by Dib et al. (2006), who obtain a scaling relation between velocity dispersion and supernova rate in numerical simulations. However, the efficiency with which supernova energy is coupled to the ISM is a free parameter in both Lehnert et al.’s analysis and in Dib et al.’s simulations, and their results are consistent with the data only if it is , whereas in the dense environments found in high redshift galaxies it is expected to be far lower (Thompson et al., 2005). This conclusion is confirmed by the more recent simulations, which do not need to assume an efficiency because they have sufficient resolution to resolve the multiphase structure of the ISM. Finally, we note that the correlation between H surface brightness and linewidth observed by Lehnert et al. has a more prosaic explanation: in a marginally stable galactic disk of constant circular velocity, the velocity dispersion is proportional to the gas surface density, since . Thus higher velocity dispersions correspond to higher surface densities, which in turn produce higher star formation rates in accordance with the standard Kennicutt (1998) relation. This naturally explains the observed correlation.
Radiation pressure is another mechanism to consider. If radiation pressure is not able to drive mass out of the clump, as found above for , this suggests that it might not be able to drive turbulence to the required virial level either, since the virial and escape velocities only differ by a factor of . However, it is unclear whether this conclusion is warranted. Radiation pressure cannot drive material out of a clump not because stars do not accelerate material enough, but because they evolve off the main sequence before they are actually able to eject matter. As a result, they produce expanding shells whose velocities greatly exceed the escape velocity. They simply fail to drive mass out because the clump because the driving sources turn off before the shells actually escape from the cluster. It is unclear if the expanding shells might provide enough energy to maintain the turbulence; this problem will require further modeling.
We are left with the possibility that the turbulence is driven by gravity. The driving source cannot be the collapse of the clump itself; although such a collapse does produce turbulence, it does so at the price of reducing the crossing time, raising the rate of energy loss. Consequently, the collapse becomes a runaway process, and all the gas quickly converts to stars. However, as shown by Dekel et al. (2009a), the gravitational migration of the clumps through the galactic disc does provide enough power to maintain the turbulence within them. The main uncertainty in this model is how much of that power will go into driving internal motions within the clump, rather than motions in the external galactic disc. This depends on how the clumps are torqued by one another and by the disc. However, there is suggestive evidence from simulations of giant clumps that this mechanism might be viable. The simulations of clumpy galaxies that have been done to date (e.g. Bournaud et al., 2007; Elmegreen et al., 2008; Agertz et al., 2009; Ceverino et al., 2009) either include no feedback or only supernova feedback (which is ineffective). If the giant clumps formed in these simulations did lose their turbulence and undergo global collapse, then, depending on the details of the simulation method, they would either convert all of their mass into stars, or all of the mass within them would collapse to the maximum density allowed by the imposed numerical pressure floor. This collapse would happen on the crossing time scale of a clump, which is much less than the time required for the clumps to migrate to the galactic centre. However, such collapses are not observed in the simulations. This strongly suggests that, even in the absence of feedback, gravitational power is sufficient to maintain the turbulence.
We conclude that the generation of turbulence in the giant clumps is an important open issue, to be addressed by further studies including simulations of higher resolution.
4.2 Comparison to Previous Work
Our conclusion that giant clumps are not likely to be disrupted by feedback is in contrast with the findings of Murray et al. (2009) for the giant clump in the galaxy Q2346-BX 482 (Genzel et al., 2008), and this difference merits discussion. Based on the H luminosity of the clump, Murray et al. estimate a total bolometric luminosity of , which corresponds to a star-formation rate of 34 yr-1 in the old stars limit, or a stellar mass of in the young stars limit, which Murray et al. assume. If these stars are indeed young, then the star-formation rate could be higher than 34 yr-1, but it could not be any lower.
While the estimate of the star-formation rate is relatively straightforward, inferring the gas mass is much less so. Murray et al. (2009) take it to be based on an order-of-magnitude estimate for the Toomre mass in the galaxy. This choice is crucial to their result. The clump radius is pc, so if we adopt this radius, the mean density-free fall time is 15 Myr, so . Using this value in equation (8), together with the corresponding surface density and mass and , tells us that we are in the young stars limit and that – fully consistent with Murray et al.’s conclusion that only a relatively small fraction of the gas mass turns into stars, and that this is sufficient to expel the remaining gas. Murray et al. derive a slightly higher value because their criterion for ejection amounts to adopting .
However, this conclusion depends crucially on having a low estimate of the gas mass, and a correspondingly high estimate for . Indeed, if the value of were accurate, this clump would have the highest star formation rate efficiency of any known system. It is therefore useful to consider alternative methods for estimating the mass. If we were to adopt the inverse-Kennicutt method, the observed star-formation rate per unit area yr-1 kpc-1, together with equation (10), gives a gas surface density of (or 2300 pc-2). The corresponding gas mass is , and recomputing for this mass gives , consistent with the point we made earlier that the Kennicutt Law is in practice equivalent to having . With this mass we would predict , i.e. essentially no gas expulsion. One would expect similar results from Murray et al.’s models, because the effect of this mass increase would be to increase the gravitational force by a factor of 40 while leaving the radiative force unchanged. Thus while Murray et al.’s models suggest that the clump in BX 482 has stopped forming stars and all the remaining gas has just been expelled, according to our estimate this clump can be only part of the way through its life and may continue to form stars.
Murray et al. (2009) also suggest another method of estimating the gas mass. Based on the H luminosity, if one assumes that the clump is filled with uniform-density gas, then ionization balance requires that this gas have a density of hydrogen nuclei
| (23) |
where is the hydrogen mass fraction and this expression assumes that He is singly-ionized. If, following Murray et al. (2009), we adopt the young stars limit, then the ionizing luminosity is photons s-1 (Murray & Rahman, 2009).555The ionizing luminosity is somewhat lower in the old stars limit: photons s-1. Combining this with the case B recombination coefficient cm3 s-1 and the Solar hydrogen mass fraction (mean mass per H nucleus of ) gives cm-3, corresponding to a mass of and . Plugging this mass, surface density, and value of into equation (8) gives , i.e. the star fraction is more than three times what we would obtain using Murray et al.’s mass of . Adopting to shift our fiducial parameters closer to those used in Murray et al. would give , no significant gas expulsion. We emphasize that these calculations are lower limits on the gas mass and upper limits on the fraction of mass ejected, because this mass estimate includes only ionized gas. However, models of both classical gas pressure-driven H ii regions and ones driven by radiation pressure (Krumholz & Matzner, 2009; Murray et al., 2009) suggest that the ionized gas mass in the H ii region interior is significantly smaller than the mass of neutral gas swept up in the shell around it. Including this mass would lower and increase even further.
In summary, our conclusions differ from those of Murray et al. (2009) not because of any difference in the physics of radiation feedback, but because they have used an estimated gas mass that produces an extraordinarily high value of .
5 Conclusions
Our main result in this paper, summarized in Equation (9) and Figure 1, is that the survival or disruption of giant star-forming clumps in high- galaxies depends critically on the rate at which they turn into stars. We find that as long as the high-redshift clumps convert their gas mass into stars at a rate of one to a few percent of the mass per free-fall time, , as is observed in low-redshift star-forming systems from small galactic clusters to ultraluminous infrared galaxies, the clumps retain most of their gas and turn it into stars. As a result, they remain bound as they migrate into the galactic centre on timescales of disc orbital times. A significant fraction of the clump gas could be ejected on a free-fall timescale before turning into stars only if clumps can convert of their gas mass into stars in a free-fall time, forming stars much faster than any other star-forming system known. We argue the current high- data is consistent with the standard SFR rate efficiencies at the level of one to a few percent, with no significant evidence for a change in the star formation process in high- star-forming galaxies. Nevertheless, this is clearly an interesting issue to explore with more direct observational estimates of the gas mass in these galaxies.
It is possible to check our theoretical arguments for clump survival with a number of possible observations. First, clumps can be disrupted by radiation pressure only if a majority of their gas is expelled, and the resulting massive radiation-driven outflows from clumps may be observable as systematic blueshifts at the clump locations. A preliminary search for such a phenomenon have yielded a null result (K. Shapiro, private communication, 2009), but further investigations of the kinematics in and around the clumps are worthwhile. It is possible that sufficient extinction could hide the blueshifted signature, but we note that, if the gas surface densities are relatively low as, e.g., Murray et al. (2009) propose, the extinction is relatively mild.
Second, stellar populations in high-redshift clumps can provide independent observational tests that could help distinguish between the two scenarios of clump survival or disruption. One such test involves the age spread of stars in actively star-forming clumps. If radiative feedback disrupts the clumps after one or a few free-fall times, the spread of stellar ages in each clump should not exceed Myr. If clumps survive, on the other hand, then the age spreads may reach Myr, with a high and roughly constant SFR during the lifetime of the clump. There is preliminary observational evidence in favor of the latter (Elmegreen et al., 2009b; Förster Schreiber et al., 2009), but this should be explored further. In this case, migration toward the bulge will produce an age gradient, so that clumps closer to the bulge have systematically larger age spreads than those further out in the disc.
A third test is associated with the properties of massive star clusters in the disc that are not actively forming stars. Clusters with masses can only be made in giant clumps, not in the rest of the disc, where molecular clouds are smaller. If clumps undergo rapid disruption by feedback, most of the clusters are likely to dissolve as is the case for local star formation (e.g. Fall et al., 2009), but the few clusters that may survive will remain in the disc near their formation radii. None will migrate into the bulge, since the migration time varies as (Dekel et al., 2009b), and the masses of the clusters are much smaller than those of their parent gas clumps. In contrast, if gas clumps survive feedback and convert most of their mass to stars, the resulting massive objects will rapidly migrate toward the galactic center. They will lose of their mass due to tidal stripping (Bournaud et al., 2007), possibly including some massive sub-clusters, but they will deliver the rest of their mass to the bulge. Thus, if giant clumps do not survive, we expect to see a few massive clusters in the disk and none in the bulge. If, on the other hand, our model is correct, then there should be comparable masses of disk and bulge clusters. Those bulge clusters that survive today may correspond to the metal-rich globular cluster population seen in present-day galactic bulges (Brodie & Strader 2006; Shapiro et al. 2010; Romanowsky et al., in preparation).
Even though we have concluded that the high- giant clumps are expected to survive radiative stellar feedback, we do emphasize the important role that this process is likely to play in galaxy formation. For example, it can provide some of the pressure support needed in these giant clumps, it can drive non-negligible winds out of them, and it is likely to disrupt the less massive clumps where stars form at later redshifts. In many circumstances, this mode of feedback is expected to be more important than supernova feedback, as it pushes away the cold dense gas while the latter mostly affects the hot dilute gas. We thus highlight the need for incoroprating radiative stellar feedback in hydrodynamical simulations as well as in semi-analytic models of galaxy evolution.
Acknowledgments
We acknowledge stimulating discussions with Andi Burkert, Daniel Ceverino, Reinhard Genzel, Norm Murray, and Aaron Romanowsky, and helpful comments on the manuscript from Mark Dijkstra, Bruce Elmegreen, and the referee, Frederic Bournaud. This research has been supported by the Alfred P. Sloan Foundation (MRK); NASA through ATP grants NNX09AK31G (MRK), NAG5-8218 (AD), and as part of the Spitzer Theoretical Research Program, through a contract issued by the JPL (MRK); the National Science Foundation through grant AST-0807739 (MRK); the German-Israeli Foundation (GIF) through grant I-895-207.7/2005 (AD); the German Research Foundation (DFG) via German-Israeli Project Cooperation grant STE1869/1-1.GE625/15-1 (AD); the Israel Science Foundation (AD); and France-Israel Teamwork in Sciences (AD).
References
- Agertz et al. (2009) Agertz O., Teyssier R., Moore B., 2009, MNRAS, 397, L64
- Baumgardt & Kroupa (2007) Baumgardt H., Kroupa P., 2007, MNRAS, 380, 1589
- Birnboim & Dekel (2003) Birnboim Y., Dekel A., 2003, MNRAS, 345, 349
- Birnboim et al. (2007) Birnboim Y., Dekel A., Neistein E., 2007, MNRAS, 380, 339
- Bothwell et al. (2009) Bothwell M. S., et al., 2009, MNRAS, submitted, arXiv:0912.1598
- Bouche et al. (2009) Bouche N., et al., 2009, ApJ, submitted, arXiv:0912.1858
- Bournaud et al. (2008) Bournaud F., et al., 2008, A&A, 486, 741
- Bournaud & Elmegreen (2009) Bournaud F., Elmegreen B. G., 2009, ApJ, 694, L158
- Bournaud et al. (2007) Bournaud F., Elmegreen B. G., Elmegreen D. M., 2007, ApJ, 670, 237
- Brodie & Strader (2006) Brodie J. P., Strader J., 2006, ARA&A, 44, 193
- Carilli et al. (2005) Carilli C. L., et al., 2005, ApJ, 618, 586
- Ceverino et al. (2009) Ceverino D., Dekel A., Bournaud F., 2009, MNRAS, submitted, arXiv:0907.3271
- Ceverino & Klypin (2009) Ceverino D., Klypin A., 2009, ApJ, 695, 292
- Cowie et al. (1995) Cowie L. L., Hu E. M., Songaila A., 1995, AJ, 110, 1576
- Cresci et al. (2009) Cresci G., et al., 2009, ApJ, 697, 115
- Crutcher et al. (2009) Crutcher R. M., Hakobian N., Troland T. H., 2009, ApJ, 692, 844
- Daddi et al. (2009) Daddi E., et al., 2009, ApJ, submitted, arXiv:0911.2776
- Daddi et al. (2008) Daddi E., Dannerbauer H., Elbaz D., Dickinson M., Morrison G., Stern D., Ravindranath S., 2008, ApJ, 673, L21
- Dekel & Birnboim (2006) Dekel A., Birnboim Y., 2006, MNRAS, 368, 2
- Dekel et al. (2009a) Dekel A., et al., 2009a, Nature, 457, 451
- Dekel et al. (2009b) Dekel A., Sari R., Ceverino D., 2009b, ApJ, 703, 785
- Dekel & Silk (1986) Dekel A., Silk J., 1986, ApJ, 303, 39
- Dib et al. (2006) Dib S., Bell E., Burkert A., 2006, ApJ, 638, 797
- Dijkstra & Loeb (2009) Dijkstra M., Loeb A., 2009, MNRAS, 400, 1109
- Dutton et al. (2009) Dutton A. A., van den Bosch F. C., Dekel A., 2009, ArXiv e-prints
- Elmegreen et al. (2008) Elmegreen B. G., Bournaud F., Elmegreen D. M., 2008, ApJ, 688, 67
- Elmegreen et al. (2009a) Elmegreen B. G., Elmegreen D. M., Fernandez M. X., Lemonias J. J., 2009a, ApJ, 692, 12
- Elmegreen et al. (2004a) Elmegreen D. M., Elmegreen B. G., Hirst A. C., 2004a, ApJ, 604, L21
- Elmegreen et al. (2009b) Elmegreen D. M., Elmegreen B. G., Marcus M. T., Shahinyan K., Yau A., Petersen M., 2009b, ApJ, 701, 306
- Elmegreen et al. (2007) Elmegreen D. M., Elmegreen B. G., Ravindranath S., Coe D. A., 2007, ApJ, 658, 763
- Elmegreen et al. (2005) Elmegreen D. M., Elmegreen B. G., Rubin D. S., Schaffer M. A., 2005, ApJ, 631, 85
- Elmegreen et al. (2004b) Elmegreen D. M., Elmegreen B. G., Sheets C. M., 2004b, ApJ, 603, 74
- Evans et al. (2009) Evans N. J., et al., 2009, ApJS, 181, 321
- Fall et al. (2009) Fall S. M., Chandar R., Whitmore B. C., 2009, ApJ, 704, 453
- Fall et al. (2010) Fall S. M., Krumholz M. R., Matzner C. D., 2010, ApJ, 710, L142
- Federrath et al. (2008) Federrath C., Klessen R. S., Schmidt W., 2008, ApJ, 688, L79
- Förster Schreiber et al. (2009) Förster Schreiber N. M., et al., 2009, ApJ, 706, 1364
- Förster Schreiber et al. (2006) Förster Schreiber N. M., et al., 2006, ApJ, 645, 1062
- Furlanetto et al. (2005) Furlanetto S. R., Schaye J., Springel V., Hernquist L., 2005, ApJ, 622, 7
- Gao et al. (2007) Gao Y., Carilli C. L., Solomon P. M., Vanden Bout P. A., 2007, ApJ, 660, L93
- Genzel et al. (2008) Genzel R., et al., 2008, ApJ, 687, 59
- Genzel et al. (2006) Genzel R., et al., 2006, Nature, 442, 786
- Goerdt et al. (2009) Goerdt T., Dekel A., Sternberg A., Ceverino D., Teyssier R., Primack J. R., 2009, MNRAS, submitted, arXiv:0911.5566
- Greve et al. (2005) Greve T. R., et al., 2005, MNRAS, 359, 1165
- Hahn et al. (2007) Hahn O., Porciani C., Carollo C. M., Dekel A., 2007, MNRAS, 375, 489
- Harper-Clark & Murray (2009) Harper-Clark E., Murray N., 2009, ApJ, 693, 1696
- Hills (1980) Hills J. G., 1980, ApJ, 235, 986
- Hopkins & Beacom (2006) Hopkins A. M., Beacom J. F., 2006, ApJ, 651, 142
- Immeli et al. (2004a) Immeli A., Samland M., Gerhard O., Westera P., 2004a, A&A, 413, 547
- Immeli et al. (2004b) Immeli A., Samland M., Westera P., Gerhard O., 2004b, ApJ, 611, 20
- Joung et al. (2009) Joung M. R., Mac Low M., Bryan G. L., 2009, ApJ, 704, 137
- Kennicutt (1998) Kennicutt Jr. R. C., 1998, ApJ, 498, 541
- Kereš et al. (2005) Kereš D., Katz N., Weinberg D. H., Davé R., 2005, MNRAS, 363, 2
- Kroupa (2001) Kroupa P., 2001, MNRAS, 322, 231
- Kroupa & Boily (2002) Kroupa P., Boily C. M., 2002, MNRAS, 336, 1188
- Krumholz & Matzner (2009) Krumholz M. R., Matzner C. D., 2009, ApJ, 703, 1352
- Krumholz et al. (2006) Krumholz M. R., Matzner C. D., McKee C. F., 2006, ApJ, 653, 361
- Krumholz & McKee (2005) Krumholz M. R., McKee C. F., 2005, ApJ, 630, 250
- Krumholz & Tan (2007) Krumholz M. R., Tan J. C., 2007, ApJ, 654, 304
- Krumholz & Thompson (2007) Krumholz M. R., Thompson T. A., 2007, ApJ, 669, 289
- Lehnert et al. (2009) Lehnert M. D., et al., 2009, ApJ, 699, 1660
- Mac Low (1999) Mac Low M., 1999, ApJ, 524, 169
- Mac Low et al. (1998) Mac Low M., Klessen R. S., Burkert A., Smith M. D., 1998, Physical Review Letters, 80, 2754
- Magnelli et al. (2009) Magnelli B., Elbaz D., Chary R. R., Dickinson M., Le Borgne D., Frayer D. T., Willmer C. N. A., 2009, A&A, 496, 57
- Matzner (2002) Matzner C. D., 2002, ApJ, 566, 302
- Matzner (2007) —, 2007, ApJ, 659, 1394
- McCrady & Graham (2007) McCrady N., Graham J. R., 2007, ApJ, 663, 844
- Murray et al. (2009) Murray N., Quataert E., Thompson T. A., 2009, ApJ, submitted, arXiv:0906.5358
- Murray & Rahman (2009) Murray N. W., Rahman M., 2009, ArXiv e-prints
- Nakamura & Li (2007) Nakamura F., Li Z.-Y., 2007, ApJ, 662, 395
- Nakamura & Li (2008) —, 2008, ApJ, 687, 354
- Narayanan et al. (2008a) Narayanan D., Cox T. J., Hernquist L., 2008a, ApJ, 681, L77
- Narayanan et al. (2008b) Narayanan D., Cox T. J., Shirley Y., Davé R., Hernquist L., Walker C. K., 2008b, ApJ, 684, 996
- Neistein et al. (2006) Neistein E., van den Bosch F. C., Dekel A., 2006, MNRAS, 372, 933
- Noguchi (1999) Noguchi M., 1999, ApJ, 514, 77
- Ocvirk et al. (2008) Ocvirk P., Pichon C., Teyssier R., 2008, MNRAS, 390, 1326
- Padoan & Nordlund (2002) Padoan P., Nordlund Å., 2002, ApJ, 576, 870
- Quillen et al. (2005) Quillen A. C., et al., 2005, ApJ, 632, 941
- Robertson & Bullock (2008) Robertson B. E., Bullock J. S., 2008, ApJ, 685, L27
- Schaye & Dalla Vecchia (2008) Schaye J., Dalla Vecchia C., 2008, MNRAS, 383, 1210
- Shapiro et al. (2010) Shapiro K. L., Genzel R., Förster Schreiber N. M., 2010, MNRAS, L9+
- Shapiro et al. (2008) Shapiro K. L., et al., 2008, ApJ, 682, 231
- Stone et al. (1998) Stone J. M., Ostriker E. C., Gammie C. F., 1998, ApJ, 508, L99
- Tacconi et al. (2010) Tacconi L. J., et al., 2010, Nature, in press
- Tacconi et al. (2008) Tacconi L. J., et al., 2008, ApJ, 680, 246
- Tasker & Bryan (2008) Tasker E. J., Bryan G. L., 2008, ApJ, 673, 810
- Thompson et al. (2005) Thompson T. A., Quataert E., Murray N., 2005, ApJ, 630, 167
- Toomre (1964) Toomre A., 1964, ApJ, 139, 1217
- van den Bergh et al. (1996) van den Bergh S., Abraham R. G., Ellis R. S., Tanvir N. R., Santiago B. X., Glazebrook K. G., 1996, AJ, 112, 359
- Wang et al. (2009) Wang P., Li Z.-Y., Abel T., Nakamura F., 2009, ApJ, submitted, arXiv:0908.4129
- Zuckerman & Evans (1974) Zuckerman B., Evans N. J., 1974, ApJ, 192, L149