Mid-Infrared Photometry of Cold Brown Dwarfs:
Diversity in Age, Mass and Metallicity
Abstract
We present new Spitzer IRAC photometry of twelve very late-type T dwarfs; nine have [3.6], [4.5], [5.8] and [8.0] photometry and three have [3.6] and [4.5] photometry only. Combining this with previously published photometry, we investigate trends with type and color that are useful for both the planning and interpretation of infrared surveys designed to discover the coldest T or Y dwarfs. The on-line Appendix provides a collation of MKO-system and IRAC photometry for a sample of M, L and T dwarfs. Brown dwarfs with effective temperature () below 700 K emit more than half their flux at wavelengths longer than 3 m, and the ratio of the mid-infrared flux to the near-infrared flux becomes very sensitive to at these low temperatures. We confirm that the color (1.6 m) [4.5] is a good indicator of with a relatively weak dependence on metallicity and gravity. Conversely, the colors (2.2 m) and [4.5] [5.8] are sensitive to metallicity and gravity. Thus near- and mid-infrared photometry provide useful indicators of the fundamental properties of brown dwarfs, and if temperature and gravity are known, then mass and age can be reliably determined from evolutionary models. There are twelve dwarfs currently known with [4.5] , and K , which we examine in detail. The ages of the dwarfs in the sample range from very young (0.1 – 1.0 Gyr) to relatively old (3 – 12 Gyr). The mass range is possibly as low as 5 Jupiter masses to up to 70 Jupiter masses, i.e. near the hydrogen burning limit. The metallicities also span a large range, from [m/H] to [m/H]. The small number of T8 – T9 dwarfs found in the UKIRT Infrared Deep Sky Survey to date appear to be predominantly young low-mass dwarfs. Accurate mid-infrared photometry of cold brown dwarfs is essentially impossible from the ground, and extensions to the mid-infrared space missions warm-Spitzer and WISE are desirable in order to obtain the vital mid-infrared data for cold brown dwarfs, and to discover more of these rare objects.
Keywords: stars: low-mass, brown dwarfs — infrared: stars
1 Introduction
The last decade has seen a remarkable increase in our knowledge of the bottom of the stellar main-sequence and of the low-mass stellar and sub-stellar (brown dwarf) population of the solar neighbourhood. Two new classes have been added to the spectral type sequence following M: L and T (e.g. Kirkpatrick 2005). T dwarfs with effective temperatures () as low as 500 K are now known (Warren et al. 2007, Burningham et al. 2008, Delorme et al. 2008a, Leggett et al. 2009) and we are truly finding objects that provide the link between the low-mass stars and the giant planets. The very late-type T dwarf discoveries are primarily a result of the red and near-infrared wide-field surveys: the Two Micron All Sky Survey (2MASS; Skrutskie et al. 2006), the Sloan Digital Sky Survey (SDSS; York et al. 2000), the UK Infrared Telescope (UKIRT) Infrared Deep Sky Survey (UKIDSS; Lawrence et al. 2007), and the Canada France Hawaii Telescope’s Brown Dwarf Survey (CFBDS; Delorme et al. 2008b). Late-type T dwarfs have also been found as companions to stars in infrared imaging data (Mugrauer et al. 2006, Luhman et al. 2007).
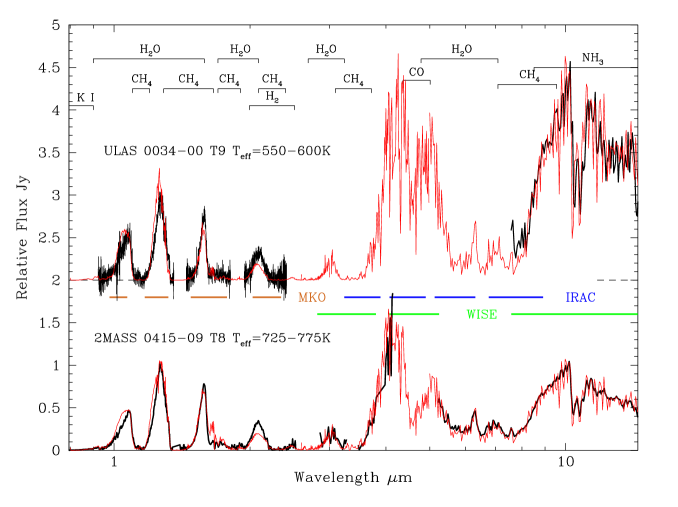
Interestingly, despite the great success of recent surveys, there are currently less than half the number of T dwarfs known than there are extrasolar planets; DwarfArchives.org lists 155 T dwarfs as opposed to the 407 exoplanets listed at exoplanet.eu, as of December 2009. An increase in the number of known T dwarfs is expected, due to the ongoing CFBDS and UKIDSS surveys, and other imminent ground-based near-infrared surveys, such as the Visible and Infrared Survey Telescope for Astronomy (VISTA, McPherson et al. 2006). Also, as decreases brown dwarfs emit significant flux at mid-infrared wavelengths (e.g. Burrows et al. 2003, Leggett et al. 2009) and it is expected that the recently launched Wide-Field Infrared Survey Explorer (WISE, Liu et al. 2008) will detect a significant number of cold brown dwarfs in its 2.8 – 3.8, 4.1 – 5.2 and 7.5 – 16.5 m bands. Figure 1 demonstrates the rapidly increasing importance of the mid-infrared region for late-type T dwarfs; for dwarfs cooler than 700 K more than half the flux is emitted at wavelengths longer than 3 m.
This paper investigates photometric trends seen in very late-type dwarfs at mid-infrared wavelengths, with the expectation that these longer wavelengths will be crucial for both the discovery and the understanding of the coolest T-type dwarfs, and even more so for the proposed cooler Y-type dwarfs (Kirkpatrick et al. 1999). We were awarded time on the Spitzer Space Telescope (Werner et al. 2004) to follow up at mid-infrared wavelengths late-type T dwarfs found by UKIDSS. In this paper we present new 3 – 8 m photometry of UKIDSS dwarfs obtained with IRAC (Fazio et al. 2004), as well as previously unpublished IRAC photometry from the Spitzer archive. We combine these data with previously published near- and mid-infrared photometry to examine trends in colors with type, which will be useful for the design and use of ongoing and planned infrared surveys. We also examine in detail the colors of the K dwarfs for correlations with the photospheric parameters temperature, gravity and metallicity. We find that various colors do provide useful indicators of temperature and gravity, which in turn provide estimates of mass and age (from evolutionary models) for these, usually isolated, very low mass objects.
Figure 2 shows spectral energy distributions (SEDs) for a T8 dwarf with K and a T9 dwarf with K. Principal absorption features are indicated and it can be seen that the flux from cool brown dwarfs emerges from windows between strong bands of, primarily, CH4 and H2O absorption. As the temperature drops from 750 K to 600 K the ratio of the mid- to the near-infrared flux increases dramatically, and more flux emerges through the windows centered near 5 m and 10 m. Passbands are indicated for the near-infrared system used here, as well as the four IRAC bands and three shortest-wavelength WISE bands. The IRAC and WISE filters sample regions of high flux, as well as regions of strong absorption where very little flux is emitted. Thus both cameras are sensitive to cold brown dwarfs, which can be identified by extreme colors in their photometric systems.
2 Atmospheric and Evolutionary Models
Atmospheric and evolutionary models used in this analysis were generated by members of our team (Marley et al. 2002, Saumon & Marley 2008). The atmospheric models include all the significant sources of gas opacity (Freedman et al. 2008). However there are known deficiencies in the molecular opacity line lists. For CH4, the list effectively contains no lines below 1.6m. For NH3, there are no lines below 1.4m in our data base. The FeH line list is known to be incomplete for the – transition in the 1.2 – 1.3m region (Cushing et al. 2003). This is not a concern for this study however as FeH bands disappear by the L7 spectral type (Cushing, Rayner & Vacca 2005) and are completely absent in late-type T dwarfs. Finally, our treatment of the red wing of the pressure broadened K I resonance doublet (0.78m) does not properly reproduce the observations in the 0.8 - 1.1m range.
Condensates of certain refractory elements are included in atmospheric layers where physical conditions favor such condensation. Variations in condensate cloud properties are treated in these models using a sedimentation parameter which is the ratio of the sedimentation velocity to the convective velocity (Ackerman & Marley 2001). Small values of represent thick clouds with small grain sizes, and large values represent thin clouds with larger grains. The cloud decks impact the flux emitted in the near- infrared wavelength region for early-type L to early-type T dwarfs. Cloud-free models best fit the spectra of later-type, cooler, objects and we employ such models here. In reality condensates certainly form deep in the atmospheres of such cool T dwarfs but a combination of atmospheric dynamics and cloud physics results in a negligible spectral influence from clouds at these effective temperatures. We generally find that the colors and spectra of L dwarfs are reproduced with – 2, while those of later T dwarfs are reproduced with or cloud-free () models (e.g. Knapp et al. 2004; Stephens et al. 2009).
Our models also include vertical transport in the atmosphere, which significantly affects the chemical abundances of C-, N- and O-bearing species. The very stable molecules CO and N2 are dredged up from deep layers to the photosphere faster than they can reach chemical equilibrium with CH4 and NH3, respectively, causing enhanced abundances of these species and decreased abundances of CH4, H2O, and NH3 (e.g. Fegley & Lodders 1996, Hubeny & Burrows 2007, Saumon et al. 2007). Vertical transport is parameterized in our models by an eddy diffusion coefficient (cm2 s-1) which is related to the mixing time scale. Generally, larger values of imply greater enhancement of CO and N2 over CH4 and NH3, respectively. Values of – 6, corresponding to mixing time scales of yr to h respectively, reproduce the observations of T dwarfs (e.g. Leggett et al. 2007b, Saumon et al. 2007). The mixing parameter has a large influence on the 4.6 m and 9 – 15 m fluxes for both L and T dwarfs: increasing leads to increased CO and an increase in the CO absorption at 4.6 m, and to decreased NH3 and so a decrease in the 9 – 15 m NH3 absorption (e.g. Stephens et al. 2009). Models which do not include mixing, usually referred to as chemical equilibrium models, do not reproduce observations, especially at these wavelengths.
The evolutionary sequences of Saumon & Marley (2008) provide radius, mass, and age for a variety of atmospheric parameters. These have been computed with both cloudy () and cloudless models as the surface-boundary condition.
3 The Sample and Data Sources
The primary sample for this paper consists of T dwarfs with spectral types T7 and later, as defined by the Burgasser et al. (2006b) scheme. Very few of these are currently known — 26 are listed in the DwarfArchives.org compendium at the time of writing. The latest spectral type currently defined is T9, of which three are currently known: ULAS J003402.77-005206.7 (hereafter ULAS 0034-00; Warren et al. 2007), CFBDS J005910.90-011401.3 (CFBDS 0059-00; Delorme et al. 2008a) and ULAS J133553.45+113005.2 (ULAS 1335+11; Burningham et al. 2008). The discovery papers provide new spectral indices for typing such extreme T dwarfs, as the Burgasser et al. indices measure absorption regions that show little change beyond T8 types. Figure 2 shows that very little flux remains to be absorbed at the near-infrared CH4 bands, for T8 and T9 dwarfs.
The Spitzer General Observer programs 40449 and 60093, and the Director’s Time program 527, allowed us to obtain IRAC photometry of apparently very late-type T dwarfs discovered in the UKIDSS data, that had an estimated brightness of [4.5] 16.5 magnitudes. The Cycle 4 Target of Opportunity program and the Director’s Time program provided photometry in all four IRAC bands, while the Cycle 6 warm mission program provides only photometry at the shortest two wavelengths. All targets observed were found in the Large Area Survey (LAS) component of the UKIDSS. The LAS will cover 3800 deg2 of the sky in the filters to (Vega magnitudes, ), with a large degree of overlap with existing SDSS optical data. The UKIDSS photometric system is described in Hewett et al. (2006) and is based on the Mauna Kea Observatories system (MKO; Tokunaga et al. 2002). Technical information on the survey data reduction and quality control is given in Dye et al. (2006). The identification and spectral classification methods for the T dwarfs selected for the Spitzer program are described by Pinfield et al. (2008).
We obtained IRAC photometry via GO 40449 for four T dwarfs, all of which were initially classified as having spectral types later than T7: ULAS J085715.96+091325.3 (hereafter ULAS 0857+09), ULAS J101721.40+011817.9 (ULAS 1017+01), ULAS J123828.51+095351.3 (ULAS 1238+09) and ULAS 1335+11. Additional spectroscopy later showed ULAS 0857+09 to have an earlier type of T6. The IRAC photometry for ULAS 1335+11 is published in Burningham et al. (2008). We were awarded Spitzer Director’s Time (program 527) for photometry and spectroscopy of the T8.5 companion to an M dwarf, ULAS J214638.83-001038.7 or Wolf 940B. We present the photometry here, the spectroscopy will be presented in a later paper. Three T7.5 dwarfs have been observed as part of our warm Spitzer program GO 60093 to date, which provides the shorter wavelength IRAC photometry: ULAS J01393977+0048138 (ULAS 0139+00), ULAS J01502437+1359240 (ULAS 0150+13) and ULAS J23212379+1354549 (ULAS 2321+13). Unpublished four-band IRAC photometry for an additional five T7 and later type dwarfs were found in the Spitzer archive: 2MASS J00501994-3322402 (2MASS 0050-33), 2MASS J03480772-6022270 (2MASS 0348-60), 2MASS J11145133-2618235 (2MASS 1114-26), SDSS J150411.63+102718.4 (SDSS 1504+10) and SDSS J162838.77+230821.1 (SDSS 1628+23). The archived data were obtained through GO programs 20544 and 40198, and GT 35. Table 1 lists the twelve dwarfs with previously unpublished photometry and gives the discovery reference, spectral type and associated Spitzer program number for each dwarf. Details of the observations and data reduction are given in .
Previously published IRAC photometry for a reference sample of late-type M, L and T dwarfs was taken from Burgasser et al. (2008b); Burningham et al. (2008); Leggett et al. (2007b); Luhman et al. (2007); Patten et al. (2006); Warren et al. (2007). IRAC photometry for the T3 dwarf 2MASS J12095613-1004008 is from S. Sonnett (priv. comm. 2009). Uncertainties are 1 – 4 %, except for the [5.8] and [8.0] Luhman et al. results, and the [8.0] Burningham et al. results, for which the uncertainties are 7 – 14%. To these should be added systematic uncertainties of 3%, which reflect both pipeline dependencies (Leggett et al. 2007b) and the uncertainty in the absolute calibration (Reach et al. 2005).
photometry on the UKIDSS/MKO system for ULAS 0150+13, ULAS 0857+09 and ULAS 2321+13 were taken from Burningham et al. (2010). Other MKO-system for the dwarfs with new IRAC data and for a reference sample of dwarfs both with and without IRAC data were taken from previously published datasets: Chiu et al. (2006, 2008); Delorme et al. (2008a); Geballe et al. (2001); Golimowski et al. (2004a); Knapp et al. (2004); Leggett et al (2000, 2002a, 2002b, 2009); Liu et al. (2007); Lodieu et al. (2007); Luhman et al. (2007); Pinfield et al. (2008); Strauss et al. (1999); Tsvetanov et al (2000); Warren et al. (2007). For the T9 dwarf CFBDS 0059-00 only is published, and we have calculated using the Delorme et al. spectrum ( is 0.08 magnitudes fainter than ). The uncertainty in these data is typically 3%, but for the fainter objects it is 10 – 15%. The reference sample of objects were limited to dwarfs with known spectral type, MKO-system photometry and () magnitudes.
MKO-system photometry is synthesized from photometrically flux-calibrated spectra for late-type T dwarfs that do not have these measurements and do have IRAC data: 2MASS 0050-33, 2MASS 0348-60 ( only), 2MASS J09393548–2448279, 2MASS 1114-26 and 2MASS J12373919+6526148. These spectra were taken from Burgasser et al. (2003b, 2006a) and Liebert & Burgasser (2007). The photometry for 2MASS 0348-60 was derived from the 2MASS photometry using the transformations based on type given by Stephens & Leggett (2004). Note that photometry on different systems can differ by several tenths of a magnitude for L and T spectral types (e.g. magnitudes for late-type T dwarfs, Stephens & Leggett) and that color transformations based on stars cannot be used for the T dwarfs. Synthetic photometry was also included for the L9 dwarf DENIS-P J0255-4700, calculated from the spectrum obtained by Cushing, Rayner & Vacca (2005). This dwarf has IRAC data and the photometry was calculated by Stephens et al. (2009) but not published. The uncertainty in all these synthesized is 5 – 10%, dominated by the uncertainty in the 2MASS photometry.
Although the emphasis of this paper is on longer wavelengths, we have included the synthetic -band photometry for L and T dwarfs calculated by Hewett et al. (2006), and have calculated other -band photometry where flux-calibrated spectra were available across the 0.95 – 1.11 m bandpass. These spectra were taken from Burgasser et al. (2003b, 2004b, 2006a, 2006b, 2008a), Chiu et al. (2006), Cushing et al. (2008), Knapp et al. (2004) and Liebert & Burgasser (2007). Primarily the photometry was synthesized for T dwarfs to investigate trends in this bandpass for very late-type dwarfs, as these trends may have implications for use of the UKIDSS LAS dataset. The uncertainty in these magnitudes is 10%.
We have identified known binaries in our sample by reference to the literature and known current work: Allers et al. (2010); Bouy et al. (2003); Burgasser et al. (2003a, 2005, 2006c); Freed et al. (2003); Golimowski et al. (2004b); Heintz (1972); Koerner et al. (1999); Liu & Leggett (2005); Liu et al. (2006, 2010, and in preparation); Martin, Brandner and Basri (1999a); Reid et al. (2001); Stumpf et al. (2005).
Finally, distance is a key parameter for luminosity investigations. Trigonometric parallaxes for M, L and T dwarfs in the sample were taken from: Costa et al. (2006), Dahn et al. (2002); the Hipparcos catalog (ESA 1997); Smart et al. (2010, and private communication 2009); Tinney (1996); Tinney et al. (1995, 2003); van Altena, Lee & Hoffleit (1995); Vrba et al. (2004).
The on-line version of this paper includes an Appendix with a collation of the photometry for the 225 M, L and T dwarfs in our main and reference samples. data are given for all the dwarfs, and IRAC data for 75 of the dwarfs. Distance moduli and binary status are also given where known. MKO-system photometry is included where available (although not used in this study), from Geballe et al. (2001); Golimowski et al. (2004a); Jones et al. (1996); Leggett (1992); Leggett et al. (1998, 2001, 2002b, 2007); Reid & Cruz (2002). All references are given in the on-line material; for completeness we list here the discovery and spectral classification references: Becklin & Zuckerman (1988); Bidelman (1985); Burgasser et al. (1999, 2000a, 2000b, 2002, 2003b, 2004b, 2006b); Burningham et al. (2008, 2009, 2010); Chiu et al. (2006, 2008); Cruz et al. (2003); Dahn et al. (2002); Delfosse et al. (1997); Delorme et al. (2008a); Fan et al. (2000); Geballe et al. (2002); Giclas, Burnham & Thomas (1971); Gliese & Jahreiss (1979); Golimowski et al. (2004b); Hawley et al. (2002); Irwin et al. (1991); Kirkpatrick et al. (1997, 1999, 2000); Knapp et al. (2004); Leggett (1992); Leggett et al. (2000); Lodieu et al. (2007); Luhman et al. (2007); Luyten (1944, 1979); Martin et al. (1999b); Mugrauer et al. (2006); Nakajima et al. (1995); Pinfield et al. (2008); Reid et al. (2000); Ruiz, Leggett & Allard (1997); Strauss et al. (1999); Tinney et al. (1993; 2005); Tsvetanov et al (2000); Warren et al. (2007).
4 New IRAC Photometry
Table 1 gives the new IRAC photometry obtained as part of this study. The data were obtained through our Spitzer programs GO 40449 and 60093, and DDT 527. Photometry was also extracted from IRAC images available in the archive taken as part of programs GO 20544 and 40198, and GT 35. In all cases individual frame times were 30 seconds, with multiple position dithers and in some cases frame repeats. The total integration time for each object is given in the Table. Note that [3.6], [4.5], [5.8] and [8.0] are nominal filter wavelengths and, as the photometry is not color-corrected for the dwarfs’ spectral shapes, the results cannot be translated to a flux at the nominal wavelength (e.g. Cushing et al. 2008, Reach et al. 2005).
For all but one filter for one dwarf, the post-basic-calibrated-data (pbcd) mosaics generated by the Spitzer pipeline were used to obtain aperture photometry. For Wolf 940B some of the [5.8] images were badly affected by the bright primary and the mosaic was recreated excluding these frames. The photometry was derived using a 3 or 5 1.2-arcsecond pixel aperture radius (i.e. 7.2 or 12 arcsecond diameter), depending on the crowding of the field. Generally, concentric sky annuli could be used to determine the sky levels. For ULAS 1017+01 the field was crowded enough that separate sky apertures were used, and for Wolf 940B scattered light from the primary meant that separate sky apertures were required. For these two dwarfs the uncertainty in each measurement was taken to be the larger of that implied by the uncertainty images (noise pixel maps) provided by the pipeline or the variation with sky aperture. For the other dwarfs the uncertainties were determined from the uncertainty images. The aperture correction was taken from the IRAC handbook (http://ssc.spitzer.caltech.edu/irac/dh/).
5 Observed Trends with Spectral Type
In this Section we present and discuss observed trends with spectral type. We use infrared spectral types for both the L dwarfs (as defined by Geballe et al. 2002) and the T dwarfs (Burgasser et al. 2006b). Both optical (Kirkpatrick et al. 1999) and infrared L dwarf spectral types are commonly used. Generally the difference is not significant, however for L dwarfs that are unusually blue or red in the near-infrared, indicating unusual condensate properties, there can be significant differences (e.g. Knapp et al. 2004, Stephens et al. 2009). Data sources are given in §3. Interpretion of the observational data is based on the models described in §2; while these are advanced and do reproduce the data quite well, there are known deficiencies, and the conclusions reached here may evolve as the models improve.
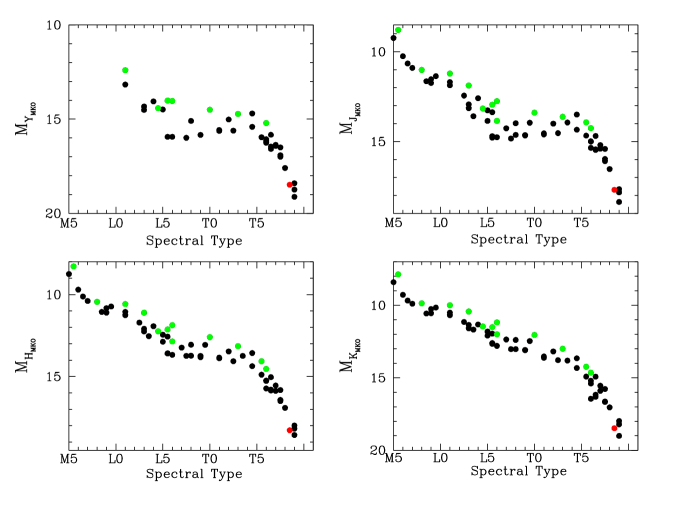
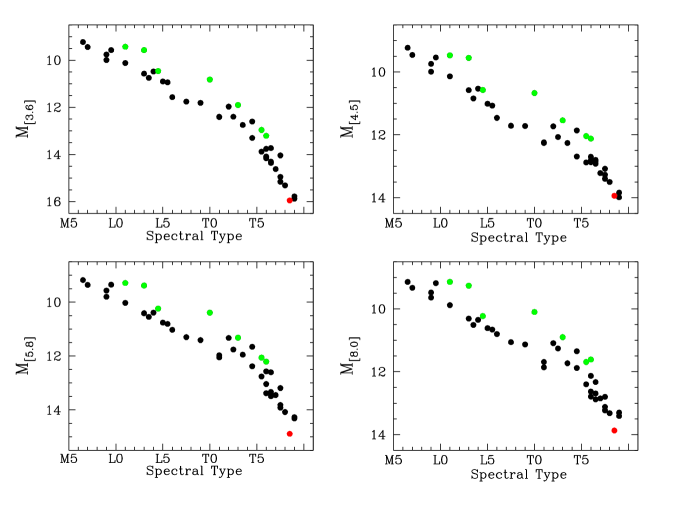
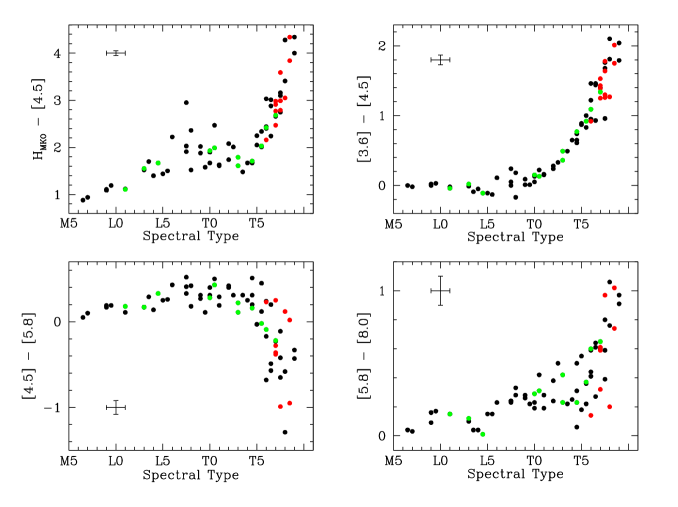
Figures 3 and 4 show absolute and absolute [3.6], [4.5], [5.8] and [8.0] magnitudes as a function of type. and brighten from late-L to early-T as the condensate cloud decks clear from the photosphere; the clouds especially impact the 1 m region (Ackerman & Marley 2001). is an intermediate case and the brightness here is approximately constant from mid-L to mid-T. These trends have been known for some time (e.g. Dahn et al. 2002) and have now been confirmed, through studies of binaries, to be an intrinsic part of brown dwarf evolution, and not due to for example differences in gravity or metallicity, or due to unresolved binarity (e.g. Liu et al. 2006, Looper et al. 2009). In the near-infrared the latest-type T dwarfs become rapidly fainter while the drop is much less pronounced in the mid-infrared, as more and more flux is distributed to the longer wavelengths at low temperatures (Figures 1 and 2 and e.g. Burrows et al. 2003, Leggett et al. 2009). There is a 4 – 5 magnitude increase in the near-infrared magnitudes between T5 and T9 types, compared to only 1.5 – 2 magnitudes at the IRAC wavelengths.
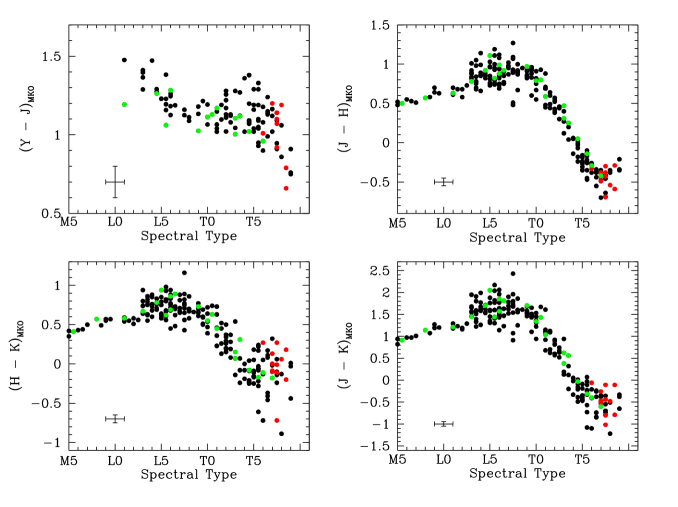
Figures 5 and 6 show various colors as a function of type, where again infrared spectral types are used for both the L and T dwarfs. The behavior of the color is difficult to interpret; for early-type L to early-type T dwarfs both bands are impacted by the cloud decks. There is an apparent bluewards trend for the latest-type T dwarfs. This may be due to the first overtone band of pressure-induced H2 becoming significant at (Borysow 2002), or to the brightening of due to the weakening of the very broad 0.77 m K I feature as K I condenses into KCl (Lodders 1999). The temperature dependence of the latter is stronger than that of the former, and so this blueward trend in is most likely due to K I condensation.
The reddening and increased dispersion in the , and colors for around L3 to T2 types demonstrates the effect of the condensate clouds, and the variability in the cloud properties. The less well-populated [4.5] plot also shows a wide dispersion for these types due to the impact of the clouds at .
T dwarfs are increasingly blue in , and , due to the loss of the cloud decks and the onset of CH4 absorption. However this blueward trend diminishes for the latest types, as very little flux remains to be absorbed by CH4 (Figure 2). For types later than T5 the and plots show more scatter — most likely this reflects variations in metallicity and gravity, as pressure-induced H2 opacity becomes important at these temperatures, which impacts the band, and which is very sensitive to metallicity and, to a lesser extent, gravity.
At the IRAC bands, T5 and later dwarfs become rapidly redder in [3.6][4.5] and [5.8][8.0], but bluer in [4.5][5.8]. As temperature decreases, more flux emerges in the relatively clear 4 – 5 m and m windows, which lie between strong H2O and CH4 bands (Figure 2 and e.g. Leggett et al. 2009). The dispersion in the IRAC colors is relatively small compared to the photometric uncertainties. As previously mentioned, variations in the condensate clouds lead to scatter in the [4.5] for L3 to T2 types. For the latest-type T dwarfs scatter is seen in [4.5] [5.8] most likely due to variations in the CO absorption which impacts the [4.5] flux and is gravity- and metallicity-sensitive (see §7).
6 Trends with Color
6.1 Trends for M, L and T Dwarfs
In this Section we show various trends with color for late-M, L and T dwarfs. We compare the observations of the late-type T dwarfs to model sequences calculated for 500 K 1000, where all models are cloud-free (as appropriate for our late-type T dwarf sample) and also include significant but typical vertical mixing, with an eddy-diffusion parameter (cm2 s-1). Colors have been calculated for surface gravity 100, 300 and 1000 m s-2, or 4.0, 4.477 and 5.0 in units, and metallicity [m/H], [m/H] and [m/H]. The evolutionary models show that for this temperature range corresponds to a 30 Jupiter-mass object aged between 1 and 10 Gyr, to a 14 Jupiter-mass object aged between 0.2 and 1.5 Gyr, and to a very low-mass and young 6 Jupiter-mass object aged between 30 and 200 Myr. A gravity as high as is not relevant for a study of the coldest T dwarfs: at K if age is 10 Gyr.
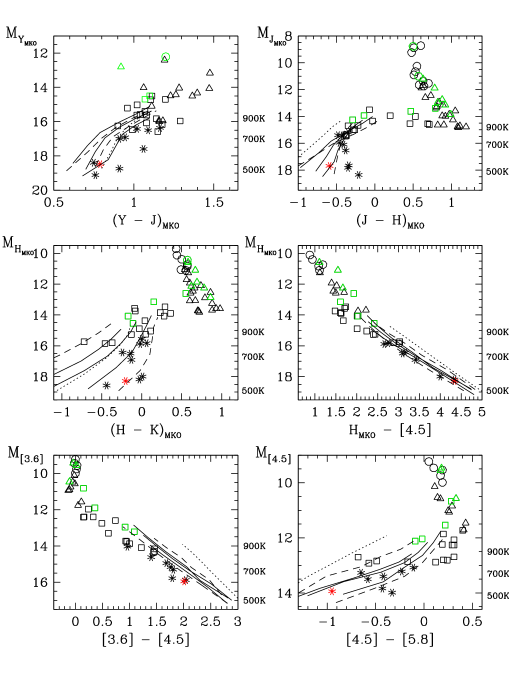
Figure 7 shows absolute magnitudes as a function of various colors for late-M, L and T dwarfs where symbols indicate spectral type. Values of from the atmospheric models are indicated along the right axes for the and [m/H] case. Note again that the coolest dwarfs drop off much more rapidly in brightness at near-infrared wavelengths than at longer wavelengths. In these plots the models sequences are used to illustrate the likely range of values only; we discuss the model implications for the atmospheric parameters of the latest-type T dwarfs in §7. The dotted sequences are calculated from a solar metallicity model that does not include vertical mixing; the discrepancies with the observations confirm the conclusions of previous analyses that vertical mixing is significant in brown dwarf atmospheres (§2).
The model sequences that include mixing effectively encompass the range of datapoints quite well. The exceptions in the near-infrared are : and : where the calculated , and for the latest-type T dwarfs , both appear to be a few tenths of a magnitude too bright (see also Figure 2). This is presumably due to the known opacity deficiencies and problems with modelling the wing of the strong K I resonance doublet in the far-red (see §2). At longer wavelengths, there appears to be a systematic offset in color for :[3.6][4.5] such that the calculated [3.6] fluxes are too faint. This is supported by the model comparisons to the observed near- through mid-infrared spectral energy distributions and IRAC magnitudes for 600 K brown dwarfs presented by Leggett et al. (2009) — the best fits all have the calculated [3.6] fluxes too low by 20–50%. It is not clear if this is related to missing opacities in the near-infrared (which may lead to too high near-infrared fluxes and too low mid-infrared fluxes), or if it is due to errors in the pressure-temperature structure of our non-equilibrium models.
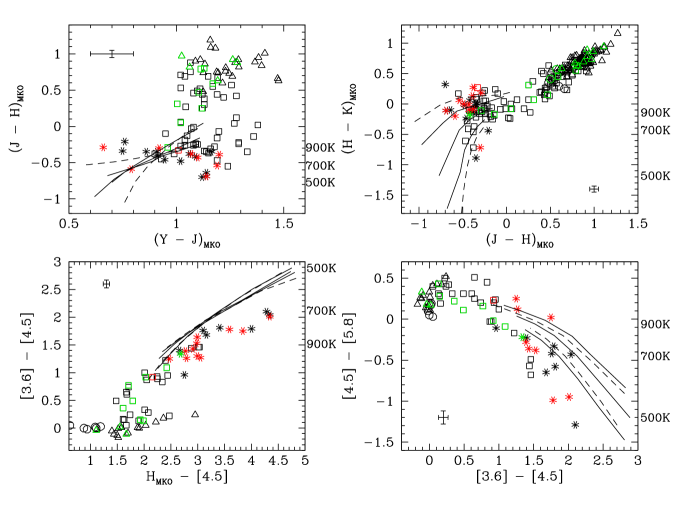
Figure 8 shows a selection of color:color plots. Sources with new IRAC photometry presented here are indicated, demonstrating that these data fill gaps in color sequences and also illustrate better the dispersion in some colors. The too-faint synthetic [3.6] magnitudes are again apparent. The use of a [4.5] color in Figures 7 and 8 is explained in .
6.2 Survey Sensitivities to 500 K Brown Dwarfs
We can use the absolute magnitudes to estimate the number of 500 K brown dwarfs (objects with masses between 7 and 30 Jupiters for an age range of 0.4 to 10 Gyr) that will be found by various sky surveys. The UKIDSS LAS is expected to cover 3800 deg2 to (Vega magnitudes, ); hence the LAS should detect 500 K brown dwarfs to 25 pc over a volume of pc3. The VISTA VIKING survey (http://www.eso.org/sci/observing/policies/PublicSurveys/sciencePublicSurveys.html) is expected to reach (Vega magnitudes, ) over 1500 deg2, implying a distance limit of 50 pc, and a volume of pc3 for detection of 500 K objects. The WISE sensitivities of 0.12, 0.16 and 0.65 mJy in bands 1, 2 and 3 respectively (2.8 – 3.8, 4.1 – 5.2 and 7.5 – 16.5 m; Mainzer et al. 2005) suggest that the mission will detect 500 K objects to 10, 15 and 10 pc in each of these bands (based on our Spitzer measurements and atmospheric models, e.g. Figure 6 of Leggett et al. 2009). Hence this all-sky mission will sample a volume of pc3 at band 2 for 500 K dwarfs, i.e. similar to the planned VISTA mission and about three times larger than the volume probed by the LAS. At K however we estimate that the WISE volume should surpass the near-infrared VISTA volume by about a factor of 6 — at this temperature VISTA should detect dwarfs out to around 17 pc and WISE out to around 10 pc. (At the faint limits these will be single-band detections and candidates will require follow up observations.)
Metchev et al. (2008) and Pinfield et al. (2008) use the number of T dwarfs found in the 2MASS, SDSS and UKIDSS surveys to determine that the T dwarf mass function is most likely flat with (or possibly declining to lower masses). The Monte Carlo simulations by Burgasser (2004a) then imply that the number of 500 K brown dwarfs is around 0.003 per 100 K per pc3. Hence VISTA and WISE should find around forty-five 500 K brown dwarfs compared to the fifteen expected in UKIDSS at the end of the LAS survey (and WISE should find around thirty cold 400 K brown dwarfs). Note that the James Webb Space Telescope will be able to obtain low-resolution spectroscopy at both near- and mid-infrared wavelengths for 500 K objects found by VISTA or WISE, given the estimated NIRSpec and MIRI sensitivities of around 25 (Vega) magnitudes at and 20 (Vega) magnitudes at 5 – 10 m (http://www.stsci.edu/jwst/science/sensitivity/, see also Marley & Leggett 2009).
7 Dwarfs Cooler than 800 K and Temperature, Metallicity and Gravity Indicators
We now examine observed and modelled trends for the coolest T dwarfs only, and identify temperature, metallicity and gravity photometric indicators. Figures 1 and 2 demonstrate the rapidly increasing ratio of the mid-infrared flux to the near-infrared flux for late-type T dwarfs. This means that a large wavelength baseline near-infrared to mid-infrared color should be a good indicator of . Warren et al. (2007), Leggett et al. (2009) and Stephens et al. (2009) show that the [4.5] color is optimum. This color is observed to be very sensitive to at temperatures cooler than 1000 K (spectral types later than around T6; Warren et al. and Stephens et al.), and this sensitivity is calculated to increase for K (spectral types later than around T7; Leggett et al.). Stephens et al. (their Figure 14) show that the :[4.5] relationship shows less scatter than colors using other near- or mid-infrared bandpasses. Figures 6, 7 and 8 demonstrate the rapid reddening of [4.5] with type or decreasing and the small dispersion in this color, for the late-type T dwarfs. [4.5] therefore shows relatively weak dependence on metallicity and gravity. Leggett et al. (2009) show that plausible variations in gravity and metallicity for a local disk sample, and variations in the chemical mixing efficiency, each impact [4.5] by 0.2 magnitudes. This is small given the large degree of sensitivity to : [4.5]) 0.7 magnitudes for K at K for example.
Hence we adopt [4.5] as our primary reference color for the very late-type T dwarfs, and investigate relationships between this color and others. We do not consider colors involving the [3.6] band, as the models systematically underestimate the flux in this band (note that as very little flux is emitted in this spectral region the problem is not expected to affect the atmospheric structure). We look in detail at the known sample of T dwarfs with IRAC photometry that have [4.5] 3.0, which the models imply have K. Including the sample of T dwarfs with new IRAC photometry presented here, twelve T dwarfs fall into this group. The dwarfs are listed in Table 2 together with some of their fundamental properties. Metallicity and age are reasonably well determined for the three objects that are companions to stars, which means temperature and gravity can be well constrained. The parameters determined by model spectral fitting are less well constrained for the other dwarfs.
Figure 6 shows that selecting [4.5] 3.0 should provide a sample with spectral types later than T7. Two earlier-type dwarfs fall into our sample: the very metal-poor dwarfs 2MASS J0937347+293142 (T6p, 2MASS 0937+29, [4.5] ) and 2MASS J12373919+6526148 (T6.5e, 2MASS 123765, [4.5] ). Their inclusion is due to the (small) dependency of [4.5] on metallicity. Four T7.5 dwarfs fall below our color cut-off. One is the metal-rich T7.5 dwarf 2MASS J1217110-031113 (2MASS 1217-03, Saumon et al. 2007, [4.5] ) whose exclusion is due to its enhanced metallicity. The three other excluded T7.5 dwarfs are objects observed as part of our warm IRAC campaign, ULAS 0139+00 ([4.5] ), ULAS 0150+13 ([4.5] ) and ULAS 2321+13 ([4.5] ). We discuss these dwarfs further below.
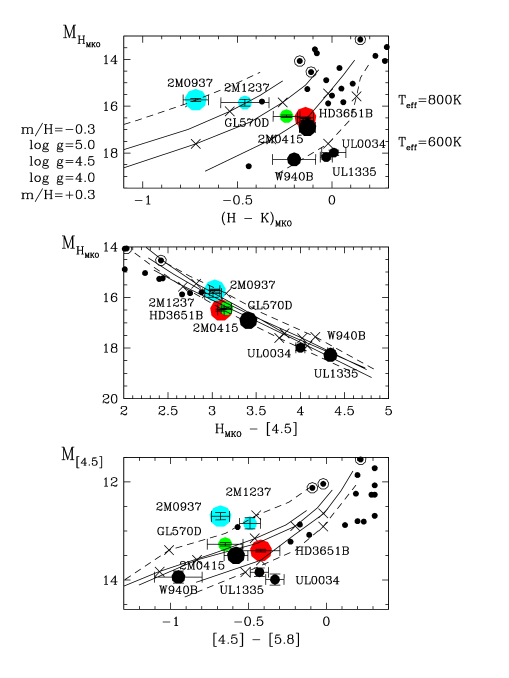
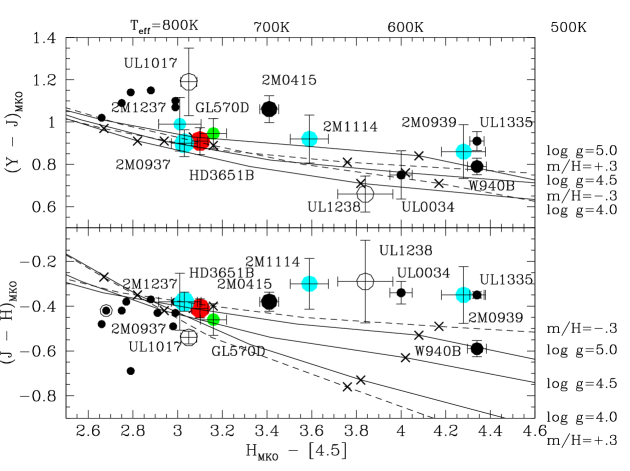
Figure 9 shows absolute magnitudes as a function of color for those dwarfs in Table 2 with measured distances; symbol type and color indicate the physical properties of each dwarf. Model sequences are also shown. We plot as a function of both and [4.5], and as a function of [4.5] [5.8]. These colors have been chosen as [4.5] has a small dependency on metallicity and gravity, while and [4.5] [5.8] have significant dependencies on metallicity and gravity. Although the agreement is not perfect, the relative location of the eight objects in the plots is in agreement with our models. The metal-poor T6 – T6.5 dwarfs 2MASS 0937+29 and 2MASS 123765 are brighter in and as predicted, and the models would imply K for these dwarfs, consistent with earlier analyses. The locations of the 800 K approximately solar metallicity T7.5 dwarfs Gl 570D and HD 3651B are consistent with the models. The T8 2MASS 0415-09 is slightly cooler than, and is probably more metal-rich, than Gl 570D, as implied from spectroscopic analyses. The T8.5 and T9 dwarfs Wolf 940B, ULAS 0034-00 and ULAS 1335+11 are still cooler, with K, and ULAS 0034-00 and ULAS 1335+11 are lower gravity or more metal-rich than than Wolf 940B, as also indicated by spectral fitting.
The metal-poor dwarf 2MASS 123765 is noteworthy as it has very strong H emission. Liebert and Burgasser (2007) explore and discount the possibility that it is young and low-gravity, which would also be inconsistent with our analysis. They suggest that instead the object may be an interacting close double system. If the companion fills the Roche lobe then they calculate that the companion must be cooler than 650 K. As no significant excess is seen at [4.5] in Figure 9, our models suggest the companion would have to be cooler than 500 K. We conclude that the red [4.5] for the dwarf is due to its low metallicity and not to the detected presence of a cool companion.
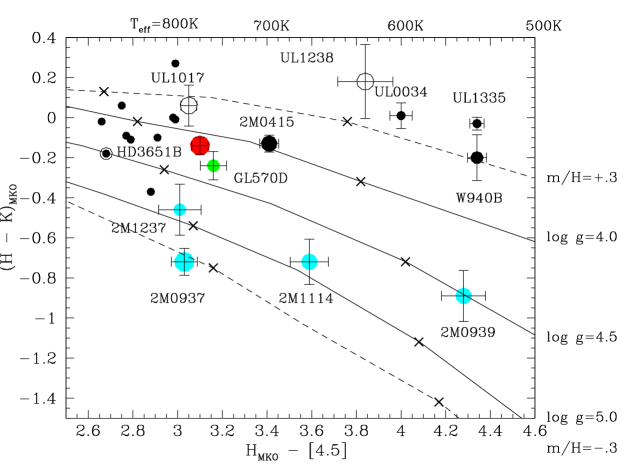
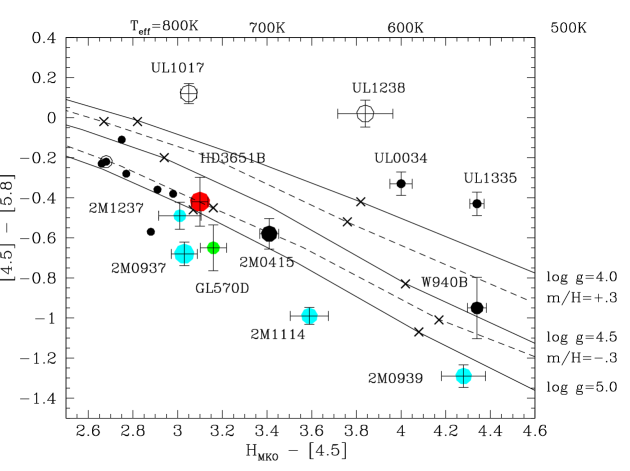
Figures 10 through 12 show [4.5] against observed and calculated colors. The observed near-infrared colors and for the sample show a small dispersion in Figure 10, and in the case of the observed dispersion is smaller than modelled (most likely due to known inadequacies in the near-infrared opacities, §2). Both Figures 11 and 12 however show a large dispersion in the observed and [4.5] [5.8] colors. The models indicate that the dispersion reflects metallicity and gravity variations in the sample, as also seen in Figure 9. These colors also show significant scatter with spectral type in Figures 5 and 6. The observed dispersion in [4.5] [5.8] is larger than calculated but the trends are in good agreement — the high-gravity and metal-poor dwarfs are bluer in both and [4.5] [5.8]. In the case of this is most likely due to the metallicity-sensitive (and to a lesser extent gravity-sensitive) pressure-induced H2 opacity in the -band. For [4.5] [5.8] an increase in gravity or decrease in metallicity leads to more flux at [4.5] as the CO absorption is weakened (see Figure 3 in Leggett et al. 2009).
Figures 11 and 12 suggest that ULAS 1017+01 and ULAS 1238+09 are low-gravity, 4.0 – 4.5, possibly metal-rich objects, similar to the other LAS very late-type T dwarfs ULAS 0034-00 and ULAS 1335+11 but not as cool. A gravity this low for ULAS 1017+01 disagrees with the value determined by Burningham et al. (2008; Table 2) based on near-infrared data only. While including mid-infrared data is expected to provide a better estimate, the temperature and gravity determined here would imply a very young age for this dwarf of 0.1 – 0.4 Gyr (see the Notes to Table 2). This dwarf is spectrally peculiar in the near-infrared and is classified as T8p. If the object is instead a binary system composed of a 900 K and 700 K pair, or a 800 K and 600 K pair, then the calculated [4.5] color is reduced, and the and [4.5] [5.8] colors increased, by 0.1 – 0.2 magnitudes, compared to the single dwarf solution. Hence the gravity could be higher ( 4.5 – 5.0) and the age more in line with what would be expected for a local disk dwarf (around 1 Gyr, see the Notes to Table 2). A parallax measurement would be helpful for pursuing this further.
Figures 9 and 11 allow us to constrain the metallicity of the Wolf 940 system: Burningham et al. (2009) give [Fe/H] based on the color of Wolf 940A but the photometric analysis presented here implies [m/H] to for the system. We can exclude the possibility that Wolf 940B is metal-poor.
Although not part of our primary sample, we can also use Figure 11 to estimate the parameters of the three T7.5 dwarfs observed as part of our warm IRAC campaign (with therefore no [5.8] photometry): ULAS 0139+00, ULAS 0150+13 and ULAS 2321+13. The {, [4.5]} colors of these objects are {, }, {, } and {, }, respectively. Their position in Figure 11 relative to the model sequences and other dwarfs suggest that: ULAS 0139+00 has , [m/H] and K; ULAS 0150+13 is a very metal-rich and/or low-gravity 750 – 800 K object; ULAS 2321+13 has , [m/H] and K. Hence the dwarfs have been excluded from the [4.5] sample due to their enhanced metallicity or, in the case of ULAS 0139+00, higher temperature.
The 2MASS-selected dwarfs in our [4.5] sample tend to be high-gravity and/or low-metallicity because they are selected for blue color. However the tendency for the LAS objects to be low-gravity (Table 2) is difficult to understand. Figure 10 shows that the colors used to select the LAS dwarfs, , should not impart any metallicity or gravity bias to the sample, as objects with a range in these parameters occupy very similar regions of the diagram. There should also be no gravity or age bias introduced by a brightness selection, as field brown dwarfs with similar temperatures but different gravities have very similar luminosity, because the radius does not change significantly after the first 100 Myr (e.g. Burrows et al. 1997 their Figure 10; Saumon & Marley 2008 their Figure 4.) The simulations of the mass function by Burgasser (2004a) does show that the median field brown dwarf mass (and hence gravity) decreases to lower temperatures, because lower mass brown dwarfs start off cooler and remain cooler than higher mass brown dwarfs. However the typical mass and hence gravity is still calculated to be higher than what we observe for the LAS dwarfs: at K Burgasser’s simulations indicate that, for a flat mass function and a constant birthrate, the median mass would be 30 – 40 MJupiter, with a median age older than 6 Gyr and . The LAS T8 – T9 dwarf on the other hand appear to be generally younger than 2 Gyr and less massive than 20 MJupiter. This puzzle will have to be re-examined when the sample of cold LAS brown dwarfs is larger and more significant conclusions can be drawn.
8 Conclusions
We have confirmed that [4.5] is a very sensitive temperature indicator for very late-T type brown dwarfs. Also and [4.5] [5.8] show significant scatter for the late-type T dwarfs which the models indicate are due to metallicity and gravity variations. Unfortunately these effects are difficult to disentangle as an increase in gravity has a similar effect to a decrease in metallicity. However the models and data suggest that is more sensitive to metallicity and [4.5] [5.8] to gravity, and so it is possible, as more cold brown dwarfs are found, and as the models continue to improve, that we can photometrically distinguish between these changes.
We provide new or improved estimates of temperature, gravity and metallicity, and hence mass and age, for the T8p ULAS 1017+01 and the T8.5 ULAS 1238+09. Both dwarfs appear to be low gravity, with 4.0 – 4.5, and possibly metal-rich. ULAS 1017+01 has 750 – 800 K, and ULAS 1238+09 is cooler with 575 – 625 K. These parameters imply low masses and young ages for the dwarfs: 8 – 12 MJupiter and 0.1 – 0.4 Gyr, and 6 – 10 MJupiter and 0.2 – 1 Gyr, for ULAS 1017+01 and ULAS 1238+09, respectively. If the spectrally peculiar dwarf ULAS 1017+01 is a (900 700) K or (800 600) K binary system, then the gravity of each component could be 4.5 – 5.0 (and mass 20 MJupiter) implying an age around 1 Gyr, more consistent with expectations for a local disk dwarf. We have also estimated the properties of three 800 K T7.5 dwarfs observed as part of our warm IRAC campaign: ULAS 0139+00, ULAS 0150+13 and ULAS 2321+13. ULAS 0150+13 and ULAS 2321+13 are metal-rich, and ULAS 0150+13 may also have low gravity (and hence mass). Finally, the analysis presented here also constrains the metallicity of the Wolf 940 M4T8.5 system, as it excludes the possibility that the system is metal-poor.
The T8 – T9 dwarfs found in the UKIDSS LAS appear to be predominantly metal-rich, low gravity and therefore young low-mass dwarfs. The T7.5 – T8 2MASS dwarfs on the other hand are mostly metal-poor and high gravity, and therefore older higher-mass dwarfs. While the 2MASS bias is understood as a color selection effect, the bias to lower gravities is not yet understood for the LAS dwarfs. The LAS sample is small, and we look forward to the discovery of more 500 – 800 K brown dwarfs, for which both near- and mid-infrared data must be obtained.
Photometric data at wavelengths longer than 3 m are both important and useful for the latest-type T dwarfs with K . It is expected to be even more so for the cooler proposed Y-type objects, which are likely to have K. It is only possible to get such ground-based data for very bright objects; the sensitivity and robust performance of the Spitzer instruments at 4 – 15 m have revolutionized the study of cool brown dwarfs. We expect that WISE will provide a similarly dramatic advancement.
Even with Spitzer warm, the short wavelength IRAC photometry provides vital information that will be impossible to get from the ground, and which may be difficult to get with WISE. We hope the warm mission will be extended so that [3.6] and [4.5] photometry can be obtained for cold brown dwarfs that will be discovered in ongoing and planned near-infrared ground-based surveys.
Also, although chemical mixing reduces the expected sensitivity of the WISE 4.1 – 5.2 m band to cold brown dwarfs, the same effect increases the sensitivity of its 7.5 – 16.5 m band. WISE should detect 500 K brown dwarfs out to 15 pc, and may find the first 400 K object. Extending the WISE mission will provide a larger sample of these rare objects, which will fill the luminosity and temperature gap between the cool brown dwarfs and the giant planets.
References
- Ackerman & Marley (2001) Ackerman A S and Marley M S 2001 ApJ 556 872
- Allers et al. (2010) Allers K N, Liu M C, Dupuy T J and Cushing M C 2010 ApJ in press
- Becklin & Zuckerman (1988) Becklin E E and Zuckerman B 1988 Nature 336 656
- Bidelman (1985) Bidelman W P 1985 ApJS 59 197
- Borysow (2002) Borysow A 2002 A&A 390 779
- Bouy et al. (2003) Bouy H, Brandner W, Martin E L, Delfosse X, Allard F and Basri G 2003 AJ 126 1525
- Burgasser et al. (1999) Burgasser A J et al. 1999 ApJ 522 L65
- Burgasser et al. (2000a) Burgasser A J et al. 2000a ApJ 531 L57
- Burgasser et al. (2000b) Burgasser A J et al. 2000b AJ 120 1100
- Burgasser et al. (2002) Burgasser A J et al. 2002 ApJ 564 421
- Burgasser et al. (2003a) Burgasser A J, Kirkpatrick J D, Reid I N, Brown M E, Miskey C L and Gizis J E 2003a ApJ 586 512
- Burgasser et al. (2003b) Burgasser A J, McElwain M W and Kirkpatrick J D 2003b AJ 126 2487
- Burgasser (2004a) Burgasser A J 2004a ApJS 155 191
- Burgasser et al. (2004b) Burgasser A J, McElwain M W, Kirkpatrick J D, Cruz K L, Tinney C G and Reid I N 2004b AJ 127 2856
- Burgasser et al. (2005) Burgasser A J, Reid I N, Leggett S K, Kirkpatrick J D, Liebert J and Burrows A 2005 ApJ 634 L177
- Burgasser et al. (2006a) Burgasser A J, Burrows A and Kirkpatrick J D 2006a ApJ 639 1095
- Burgasser et al. (2006b) Burgasser A J, Geballe T R, Leggett S K, Kirkpatrick J D and Golimowski D A 2006b ApJ 637 1067
- Burgasser et al. (2006c) Burgasser A J, Kirkpatrick J D, Cruz K L, Reid I N, Leggett S K, Liebert J, Burrows A. and Brown M E 2006c ApJS 658
- Burgasser et al. (2008a) Burgasser A J, Liu M C, Ireland M J, Cruz K L and Dupuy T J 2008a ApJ 681 579
- Burgasser et al. (2008b) Burgasser A J, Tinney C G, Cushing M C, Saumon D, Marley M S, Bennett C S and Kirkpatrick J D 2008b, ApJ 689 L53
- Burningham et al. (2008) Burningham B et al. 2008 MNRAS 391 320
- Burningham et al. (2009) Burningham B et al. 2009 MNRAS 395 1237
- Burningham et al. (2010) Burningham B et al. 2010 MNRAS submitted
- Burrows et al. (1997) Burrows A et al. 1997 ApJ 491 856
- Burrows et al. (2003) Burrows A, Sudarsky D, and Lunine J I 2003 ApJ 596 587
- Chiu et al. (2006) Chiu K, Fan X, Leggett S K, Golimowski D A, Zhen W, Geballe T R, Schneider D P and Brinkmann J 2006 AJ 131 2722
- Chiu et al. (2008) Chiu K et al. 2008 MNRAS 385 L53
- Costa et al. (2006) Costa E, Mendez R A, Jao W-C, Henry T J, Subasavage J P and Ianna P A 2006 AJ 132 1234
- Cruz et al. (2003) Cruz K L, Reid I N, Liebert J, Kirkpatrick J D and Lowrance P J 2003 AJ 126 2421
- Cushing et al. (2003) Cushing M C, Rayner J T, Davis S P and Vacca W D 2003 ApJ 582 1066
- Cushing et al. (2005) Cushing M C, Rayner J T and Vacca W D 2005 ApJ 623 1115
- Cushing et al. (2008) Cushing M C et al. 2008 ApJ 678 1372
- Delfosse et al. (1997) Delfosse X et al. 1997 A&A 327 L25
- Delorme et al. (2008a) Delorme P et al. 2008a A&A 482 961
- Delorme et al. (2008b) Delorme P et al. 2008b A&A 484 469
- Dye et al. (2006) Dye S et al. 2006 MNRAS 372 1227
- ESA (1997) ESA 1997 The Hipparcos and Tycho Catalogues (ESA SP-1200, Noordwijk : ESA)
- Dahn et al. (2002) Dahn C C et al. 2002 AJ 124 1170
- Fan et al. (2000) Fan X et al. 2000 AJ 119 928
- Fazio et al. (2004) Fazio, G. et al. 2004 ApJS 154 10
- Fegley & Lodders (1996) Fegley B and Lodders K 1996 ApJL 472 L37
- Freed et al. (2003) Freed M, Close L M and Siegler N 2003 ApJ 584 453
- Freedman et al. (2008) Freedman R S, Marley M S and Lodders K 2008 ApJS 174 504
- Geballe et al. (2001) Geballe T R, Saumon D, Leggett S K, Knapp G R, Marley M S and Lodders K 2001 ApJ 556 373
- Geballe et al. (2002) Geballe T R et al. 2002 ApJ 564 466
- Geballe et al. (2009) Geballe T R, Saumon D, Golimowski D A, Leggett S K, Marley M S and Noll K S 2009 ApJ 695 844
- Giclas et al. (1978) Giclas H L, Burnham R and Thomas N G 1978 Lowell Obs. Bull. 8 89
- Gliese & Jahreiss (1979) Gliese W and Jahreiss H 1979 A&AS 38 423
- Golimowski et al (2004a) Golimowski D A et al. 2004a AJ 127 3516
- Golimowski et al (2004b) Golimowski D A et al. 2004b AJ 128 1733
- Hawley et al. (2002) Hawley S L et al. 2002 AJ 123 3409
- Heintz (1972) Heintz W D 1972 AJ 77 160
- Hewett et al. (2006) Hewett P C, Warren S J, Leggett S K and Hodgkin S T 2006 MNRAS 367 454
- Hubeny & Burrows (2007) Hubeny I and Burrows A 2007 ApJ 669 1248
- Irwin et al. (1991) Irwin M, McMahon R G and Reid I N 1991 MNRAS 252 P61
- Jones et al. (1996) Jones H R A, Longmore A J, Allard F and Hauschildt P H 1996 MNRAS 280 77
- Kirkpatrick et al. (1997) Kirkpatrick D J, Beichman C A and Skrutskie M F 1997 ApJ 476 311
- Kirkpatrick et al. (1999) Kirkpatrick D J et al. 1999 ApJ 519 802
- Kirkpatrick et al. (2000) Kirkpatrick D J et al. 2000 AJ 120 447
- Kirkpatrick et al. (2005) Kirkpatrick D J 2005 ARA&A 43 195
- Knapp et al. (2004) Knapp G R et al. 2004 AJ 127 3553
- Koerner et al. (1999) Koerner D W, Kirkpatrick D J, McElwain M W and Bonaventura N R 1999 ApJ 526 L25
- Lawrence et al. (2007) Lawrence A et al. 2007 MNRAS 379 1599
- Leggett et al. (1992) Leggett S K 1992 ApJS 82 351
- Leggett et al. (1998) Leggett S K, Allard F and Hauschildt P H 1998 ApJ 509 836
- Leggett et al. (2000) Leggett S K et al. 2000 ApJ 536 L35
- Leggett et al. (2001) Leggett S K, Allard F, Geballe T R, Hauschildt P H and Schweitzer A 2001 ApJ 548 908
- Leggett et al. (2002a) Leggett S K et al. 2002a ApJ 564 452
- Leggett et al. (2002b) Leggett S K, Hauschildt P H, Allard F, Geballe T R and Baron E 2002b MNRAS 332 78
- Leggett et al. (2007a) Leggett S K, Marley M S, Freedman R, Saumon D, Liu M C, Geballe T R, Golimowski D A, and Stephens D 2007a ApJ 667 537
- Leggett et al. (2007b) Leggett S K, Saumon D, Marley M S, Geballe T R, Golimowski D A, Stephens D and Fan X 2007b ApJ 655 1079
- Leggett et al. (2009) Leggett S K et al. 2009 ApJ 695 1517
- Liebert & Burgasser (2007) Liebert J and Burgasser A J 2007 ApJ 655 522
- Liu & Leggett (2005) Liu M C and Leggett S K 2005 ApJ 634 616
- Liu et al. (2006) Liu M C, Leggett S K, Golimowski D A, Chiu K, Xiaohui F, Geballe T R, Schneider D P and Brinkmann J 2006 ApJ 647 1393
- Liu et al. (2007) Liu M C, Leggett S K and Chiu K 2007 ApJ 660 1507
- Liu et al. (2010) Liu M C, Leggett S K and Dupuy T J 2010 ApJ submitted
- Liu et al. (2008) Liu F et al. 2008 SPIE 7017
- Lodieu et al. (2007) Lodieu N et al. 2007 MNRAS 379 1423
- Lodders (1999) Lodders K 1999 ApJ 519 793
- Looper et al. (2008) Looper D L, Gelino C R, Burgasser A J and Kirkpatrick J D 2008 ApJ 685 1183
- Luhman et al. (2007) Luhman K L et al. 2007 ApJ 654 570
- Luyten (1944) Luyten W J 1944 Publ. Astron. Obs. Univ. Minnesota 3 53-76
- Luyten (1979) Luyten W J 1979 Publ. Astron. Obs. Univ. Minnesota A Catalogue of Stars with Proper Motions arcseconds/year
- Mainzer et al. (2005) Mainzer A K et al. 2005 SPIE 5899 262
- Marley et al. (2002) Marley M S, Seager S, Saumon D, Lodders K, Ackerman A S, Freedman R S, and Fan X 2002 ApJ 568 335
- Marley & Leggett (2009) Marley M S and Leggett S K 2009 Springer Netherlands Astrophysics in the Next Decade, Astrophysics and Space Science Proceedings 101
- Martin et al. (1999) Martin E L, Brandner W and Basri G 1999 Science 283 1718
- McPherson et al. (2006) McPherson A M et al. 2006 SPIE 6267 7
- Metchev et al. (2008) Metchev S A, Kirkpatrick J D, Berriman G B and Looper D 2008 ApJ 676 1281
- Mugrauer et al. (2006) Mugrauer M, Seifahrt A, Neuhauser R and Mazeh T 2006 MNRAS 373 L31
- Nakajima et al. (1995) Nakajima T, Oppenheimer B R, Kulkarni S R, Golimowski D A, Matthews K and Durrance S T 1995 Nature 378 463
- Patten et al. (2006) Patten B M et al. 2006 ApJ 651 502
- Pinfield et al. (2008) Pinfield D J 2008 MNRAS 390 304
- Reach et al. (2005) Reach W T et al. 2005 PASP 117 978
- Reid et al. (2000) Reid I N et al. 2000 AJ 119 369
- Reid et al. (2001) Reid I N, Gizis J E, Kirkpatrick J D and Koerner D W 2001 AJ 121 489
- Reid et al. (2002) Reid I N and Cruz K L 2002 AJ 123 466
- Ruiz et al. (1997) Ruiz M T, Leggett S K and Allard F 1997 ApJ 491 L107
- Saumon et al. (2006) Saumon D, Marley M S, Cushing M C, Leggett S K, Roellig T L, Lodders K and Freedman R S 2006 ApJ 647 552
- Saumon et al. (2007) Saumon D et al. 2007 ApJ 662 1245
- Saumon & Marley (2008) Saumon D and Marley M S 2008 ApJ 689 1327
- Skrutskie et al. (2006) Skrutskie M F et al. 2006 AJ 131 1163
- Smart et al. (2010) Smart R L et al. 2010 A & A submitted
- Stephens & Leggett (2004) Stephens D S and Leggett S K 2004 PASP 116 9
- Stephens et al. (2009) Stephens D S, Leggett S K, Cushing M C, Saumon D, Marley M S, Geballe T, Golimowski D A and Fan X 2009, ApJ 702 154
- Strauss et al. (1999) Strauss M A et al. 1999 ApJ 522 61
- Stumpf et al. (2005) Stumpf M B, Brandner W and Hening Th 2005 Proceedings Protostars and Planets V LPI Contribution 1286 8571
- Tinney et al. (1995) Tinney C G, Reid I N, Gizis J and Mould J R 1995 AJ 110 3014
- Tinney (1996) Tinney C G 1996 MNRAS 281 644
- Tinney et al. (2003) Tinney C G, Burgasser A J and Kirkpatrick J D 2003 AJ 126 975
- Tinney et al. (2005) Tinney C G, Burgasser A J, Kirkpatrick J D and McElwain M W 2005 AJ 130 2326
- Tokunaga et al. (2002) Tokunaga A T, Simons D A and Vacca W D 2002 PASP 114 180
- Tsvetanov et al. (2000) Tsvetanov Z I et al. 2000 ApJ 531 L61
- van Altena et al. (1995) van Altena W F, Lee J T and Hoffleit E D 1995 The General Catalogue of Trigonometric Stellar Parallaxes (4th ed., New Haven, Yale Univ. Obs.)
- Vrba et al. (2004) Vrba F J et al. 2004 AJ 127 2948
- Warren et al. (200) )Wa07Warren S J et al. 2007 MNRAS 381 1400
- Werner et al. (2004) Werner M W et al. 2004 ApJS 154 1
- York et al. (2000) York D G et al. 2000 AJ 120 1579
| Name | Spec. | Integ. | [3.6] mag | [4.5] mag | [5.8] mag | [8.0] mag | Prog. | Disc. |
|---|---|---|---|---|---|---|---|---|
| (RA Dec)aa2MASS names are given as HHMMSSSSDDMMSSS, SDSS and ULAS as HHMMSS.SSDDMMSS.S. | Type | min | (error mmag)bbA 30 mmag (3%) error should be added in quadrature to the quoted random errors to account for systematics. | Num. | Ref.ccDiscovery references are (1) Burningham et al. (2010) (2) Tinney et al. 2005 (3) Burgasser et al. 2003b (4) Chiu et al. 2006 (5) Chiu et al. 2008 (6) Burningham et al. 2008 (7) Burningham et al. 2009. | |||
| ULAS J085715.96+091325.3 | T6 | 96.0 | 17.65(15) | 16.73(16) | 16.50(96) | 16.36(308) | 40449 | 1 |
| 2MASS J00501994-3322402 | T7 | 5.0 | 14.82(5) | 13.57(3) | 13.32(17) | 13.00(22) | 40198 | 2 |
| 2MASS J03480772-6022270 | T7 | 2.5 | 14.04(5) | 12.51(4) | 12.89(10) | 12.28(14) | 35 | 3 |
| SDSS J150411.63+102718.4 | T7 | 7.5 | 15.44(7) | 14.01(5) | 14.37(27) | 13.76(59) | 40198 | 4 |
| SDSS J162838.77+230821.1 | T7 | 7.5 | 15.25(8) | 13.86(6) | 14.14(35) | 13.55(64) | 40198 | 4 |
| 2MASS J11145133-2618235 | T7.5 | 2.5 | 14.01(5) | 12.23(3) | 13.22(17) | 12.25(22) | 20544 | 2 |
| ULAS J013939.77+004813.8ddThis object’s {, [4.5]} implies that it has , [m/H] and K (see §7). | T7.5 | 24.0 | 17.59(23) | 16.33(12) | 60093 | 5 | ||
| ULAS J015024.37+135924.0eeThis object’s {, [4.5]} implies that it is a very metal-rich and/or low-gravity 750 – 800 K dwarf (see §7). | T7.5 | 24.0 | 16.42(8) | 15.12(4) | 60093 | 1 | ||
| ULAS J232123.79+135454.9ffThis object’s {, [4.5]} implies that it has , [m/H] and K (see §7). | T7.5 | 2.5 | 15.80(16) | 14.16(6) | 60093 | 1 | ||
| ULAS J101721.40+011817.9 | T8pggThis dwarf is spectrally a T8 in the -band, but T6 in the - and -bands. | 64.0 | 17.29(18) | 16.02(7) | 15.90(33) | 15.70(152) | 40449 | 6 |
| ULAS J123828.51+095351.3 | T8.5 | 24.0 | 17.09(17) | 15.34(8) | 15.32(51) | 14.58 (91) | 40449 | 6 |
| Wolf 940BhhAlso known as ULAS J214638.83-001038.7. | T8.5 | 18.5iiEffective integration time for [5.8] was 9.5 minutes after removal of corrupted frames. | 16.44(16) | 14.43(5) | 15.38(150) | 14.36(78) | 527 | 7 |
| Name | Spec. | Previously Determined Parameters | ReferencesaaDiscovery, trigonometric parallax and parameter references are:
(1) Burgasser et al. 2002 (2) Vrba et al. 2004 (3) Geballe et al. 2009 (4) Burgasser et al. 1999 (5) Liebert & Burgasser 2007 (6) Tinney et al. 2005 (7) Leggett et al. 2007a (8) Burgasser et al. 2000a (9) ESA 1997 (10) Saumon et al. 2006 (11) Mugrauer et al. 2006 (12) Luhman et al. 2007 (13) Liu et al. 2007 (14) Saumon et al. 2007 (15) Leggett et al. 2009 (16) Burningham et al. 2008 (17) Burningham et al. 2009 (18) Warren et al. 2007 (19) Smart et al. 2010 (20) Smart et al. private communication 2009. |
||||||
|---|---|---|---|---|---|---|---|---|---|
| Type | K | [m/H] | MJup | Age | Disc . | Param. | |||
| Gyr | |||||||||
| 2MASS J0937347+293142 | T6p | 925–975 | 5.2–5.5 | 45–69 | 3–10 | 1 | 2 | 3 | |
| 2MASS J12373919+6526148 | T6.5e | 800-850 | 5.0 | 20–40 | 1–4 | 4 | 2 | 5 | |
| 2MASS J11145133-2618235 | T7.5 | 725–775 | 5.0–5.3 | 30–50 | 3–8 | 6 | 7 | ||
| Gl 570D | T7.5 | 800–820 | 5.1 | 0.00 | 31–47 | 2–5 | 8 | 9 | 10 |
| HD 3651B | T7.5 | 780–840 | 5.3 | 40–72 | 3–12 | 11, 12 | 9 | 13 | |
| 2MASS J0415195-093506 | T8 | 725–775 | 5.0–5.4 | 0 | 33–58 | 3–10 | 1 | 2 | 14 |
| 2MASS J09393548-2448279bbProbable binary, either a pair of 600 K brown dwarfs, or a 500 K and a 700 K brown dwarf pair (Burgasser et al. 2008b, Leggett et al. 2009). | T8 | 500–700 | 5.0–5.3 | 20–40 | 2–10 | 6 | 15 | ||
| ULAS J101721.40+011817.9ccThe parameters originally derived from the near-infrared data only for this spectrally peculiar object are uncertain. The photometric analysis presented here implies 750 – 800 K, 4.0 – 4.5, [m/H] 0, mass 8 – 12 MJupiter and age 0.1 – 0.4 Gyr. If this spectrally peculiar object is a binary system then the gravity, and hence mass and age, could be larger — 4.5 – 5.0, masses 20 MJupiter and age 1 Gyr. | T8p | [750–850] | [5.0–5.5] | [0] | [33–70] | [2–10] | 16 | 16 | |
| ULAS J123828.51+095351.3ddThe photometric analysis presented here implies 575 – 625 K, 4.0 – 4.5, [m/H] 0, mass 6 – 10 MJupiter and age 0.2 – 1.0 Gyr. | T8.5 | 16 | |||||||
| Wolf 940BeeBurningham et al. (2009) give [Fe/H] based on the color of Wolf 940A; the photometric analysis presented here implies [m/H] to for the system. | T8.5 | 545–595 | 4.8–5.0 | 20–32 | 3.5–6 | 17 | 9 | 17 | |
| ULAS J003402.77-005206.7 | T9 | 550–600 | 4.5 | 0 | 13–20 | 1–2 | 18 | 19 | 19 |
| ULAS J133553.45+113005.2 | T9 | 500–550 | 4.0–4.5 | 0 | 5–20 | 0.1–2 | 15 | 20 | 15 |