Cosmic shear requirements on the wavelength-dependence of telescope point spread functions
Abstract
Cosmic shear requires high precision measurement of galaxy shapes in the presence of the observational Point Spread Function (PSF) that smears out the image. The PSF must therefore be known for each galaxy to a high accuracy. However, for several reasons, the PSF is usually wavelength dependent, therefore the differences between the spectral energy distribution of the observed objects introduces further complexity. In this paper we investigate the effect of the wavelength-dependence of the PSF, focusing on instruments in which the PSF size is dominated by the diffraction-limit of the telescope and which use broad-band filters for shape measurement.
We first calculate biases on cosmological parameter estimation from cosmic shear when the stellar PSF is used uncorrected. Using realistic galaxy and star spectral energy distributions and populations and a simple three-component circular PSF we find that the colour-dependence must be taken into account for the next generation of telescopes. We then consider two different methods for removing the effect (i) the use of stars of the same colour as the galaxies and (ii) estimation of the galaxy spectral energy distribution using multiple colours and using a telescope model for the PSF. We find that both of these methods correct the effect to levels below the tolerances required for per-cent level measurements of dark energy parameters. Comparison of the two methods favours the template-fitting method because its efficiency is less dependent on galaxy redshift than the broad-band colour method and takes full advantage of deeper photometry.
keywords:
cosmology: observations - gravitational lensing - large-scale structure1 Introduction
Measurements of the cosmic shear signal are expected to play a leading role in furthering our understanding of our Universe, in particular the nature of dark matter and dark energy or its possible alternatives such as modifications in gravity. The gravitational lensing of light from distant galaxies by intervening mass provides a powerful insight into the growth of structure and the expansion history of the universe (for recent reviews see Hoekstra & Jain, 2008; Munshi et al., 2008; Refregier, 2003).
Several planned future dark energy missions are designed with weak lensing as a primary science driver, including ground-based projects: the KIlo-Degree Survey (KIDS) 111http://www.astro-wise.org/projects/KIDS; the Panoramic Survey Telescope and Rapid Response System (Pan-STARRS) 222http://pan-starrs.ifa.hawaii.edu; the Dark Energy Survey (DES) 333http://www.darkenergysurvey.org; and the Large Synoptic Survey Telescope (LSST) 444http://www.lsst.org, and space missions Euclid 555http://www.euclid-imaging.net (Laureijs, 2009; Refregier et al., 2010) and the Joint Dark Energy Mission (JDEM) 666http://jdem.gsfc.nasa.gov. The success of the method relies on accurate measurement of galaxy shapes (e.g. Heymans et al., 2006; Massey et al., 2007; Bridle et al., 2009).
As light from galaxies passes through the atmosphere, telescope optics and measurement devices it is convolved with a kernel, referred to as the Point Spread Function (PSF). The size of the PSF is similar to the size of the galaxies used to measure cosmic shear, making accurate determination of the underlying galaxy shape a significant challenge (e.g. Lewis, 2009; Voigt & Bridle, 2009). Precise modelling of the PSF is crucial (e.g. Paulin-Henriksson et al., 2008). This can in principle be performed using accurate knowledge of the telescope optics, however in practice it is usual to make use of the point-like nature of stars by modelling the PSF based on the shapes of stellar images. The situation is complicated by (i) variations in the shape of the PSF across the detector and (ii) the wavelength-dependence of the PSF shape. In this paper we concentrate on the second of these two effects, focusing on a telescope which is nearly diffraction limited and on a instrument that uses broad-band optical filters for shape measurement.
Stars and galaxies have different spectral energy distributions (SEDs), both intrinsic and observed, specially if we consider that galaxies are observed over a broad range of redshifts (See Figure 1). Therefore the PSF shape measured from a stellar image will be different from the true PSF applied to the galaxy, leading to a bias on the measured underlying galaxy shape. The wavelength-dependence of the PSF has a greater impact if observations are performed using broad-band filters. In this paper we quantify the effect of ignoring the wavelength-dependence of the PSF in a Euclid-like space mission and show the feasibility of reducing the effect by using colour information. We determine the wavelength-dependence of the PSF shape using a simple model for the convolution kernel and applying realistic galaxy and stellar spectral energy distributions (SEDs).
For the reasons we will discuss in the following sections this paper will focus on the wavelength-dependence of the PSF size. There are several measures of this quantity, such as the 50we adopt the full width at half-maximum intensity (FWHM) as our size parameter given that this is a more familiar quantity to the astronomical community and describes well the simple PSF models we use in this paper.

The paper is organised as follows: in Section 2 we set out a formalism for propagating a mis-estimation of the PSF shape through to biases on cosmological parameters. In Section 3 we describe the separate contributions to the PSF model and in Section 4 we predict the range in PSF sizes expected for two different broad-band filters using a realistic distribution of stellar and galaxy SEDs and investigate two different methods for reducing the bias. These involve using: (i) galaxy and stellar colours to correct the PSF size and (ii) template fitting. Also we place requirements on a simple model for the wavelength dependence for a Euclid-like survey. Finally, in Section 5 we discuss our findings.
2 Implications of using an incorrect PSF
We first make a simple calculation of the shear bias induced by mis-estimating the size and ellipticity of the PSF and compare it to the general systematics limit calculated in Amara & Réfrégier (2007). We then consider the redshift dependence of the shear biases and propagate this through to biases on cosmological parameters.
The shear measurement bias caused by an incorrect PSF will depend on the shear measurement method employed. For simplicity we assume here that shears are calculated using unweighted quadrupole moments. Although this method is not feasible in practice due to the low signal-to-noise level in real images, it is related to the widely used Kaiser, Squires and Broadhurst method (Kaiser et al., 1995). It has the advantage of being extremely easy to use for shear measurement bias calculations.
Shear mis-estimates are often quantified by Taylor expanding the estimated two-component shear () in terms of the true shear as
| (1) |
where is referred to as the multiplicative bias, as the additive bias (Heymans et al., 2006) and it is often assumed and .
Amara & Réfrégier (2007) showed that, for a full-sky survey ( square degrees of extragalactic sky) with 35 galaxies per square arcminute and a median redshift of 0.9, the shear multiplicative error must be to keep systematic biases on cosmological parameters below random uncertainties, for a range of possible redshift evolution scenarios for . Using the equations in Appendix A this translates to a requirement on the PSF size mis-estimate of
| (2) |
Amara & Réfrégier (2007) also placed a requirement on the mean square error for the same survey. Interpreting this as a requirement on the square of the shear measurement additive error , and neglecting the subdominant term in Eq. 18, this places a requirement on the PSF ellipticity mis-estimate of
| (3) |
Because the observed SED of a galaxy changes with redshift, the appropriate PSF will also depend on galaxy redshift. Therefore the PSF biases and depend on redshift and so do the multiplicative and additive biases and . If, for example, the impact of the multiplicative and additive biases as a function of redshift mimics a particular cosmological parameter the requirements may be more stringent than the above more approximate calculation. We will therefore calculate PSF biases as a function of galaxy redshift and insert them into the more detailed calculation described below, which propagates the effect into biases on cosmological parameters.
Use of the wrong PSF model will cause the measured cosmic shear cross power spectra between redshift bins and , , to differ from the true cosmic shear power spectra . If a particular systematic on the cosmic shear power spectrum is ignored then the bias on cosmological parameters is given by
| (4) |
where , , , and are summed over, is the two dimensional covariance matrix between the cross-spectra and is the Fisher matrix between the cosmological parameters (Huterer et al., 2006; Amara & Réfrégier, 2007).
In the presence of a redshift dependent multiplicative bias, the measured lensing power spectrum can be given in terms of the true lensing power spectrum by
| (5) |
where is the multiplicative bias for redshift bin , averaged over all galaxies (Huterer et al., 2006, Eq. 16).
The impact of additive errors depends to first order on the spatial variation of the additive errors. For the case of a wavelength dependent PSF this will induce power on the scale of the separation between stars of a typical colour, which may be propagated into cosmology (see also Guzik & Bernstein, 2005). Here we focus on PSF size mis-estimates and therefore do not consider additive errors further.
In this paper we compare the PSF sizes for stars with those for galaxies, without considering the galaxy morphology or profile. The equations derived above and in the Appendix make it possible to draw significant conclusions about the cosmology biases independent of considerations about the galaxy light distribution, if all parts of the galaxy have the same colour. Our main metric is the difference between the FWHM of the stellar and galaxy PSFs. We average this over populations of galaxies for various different PSF correction schemes.
3 The PSF model
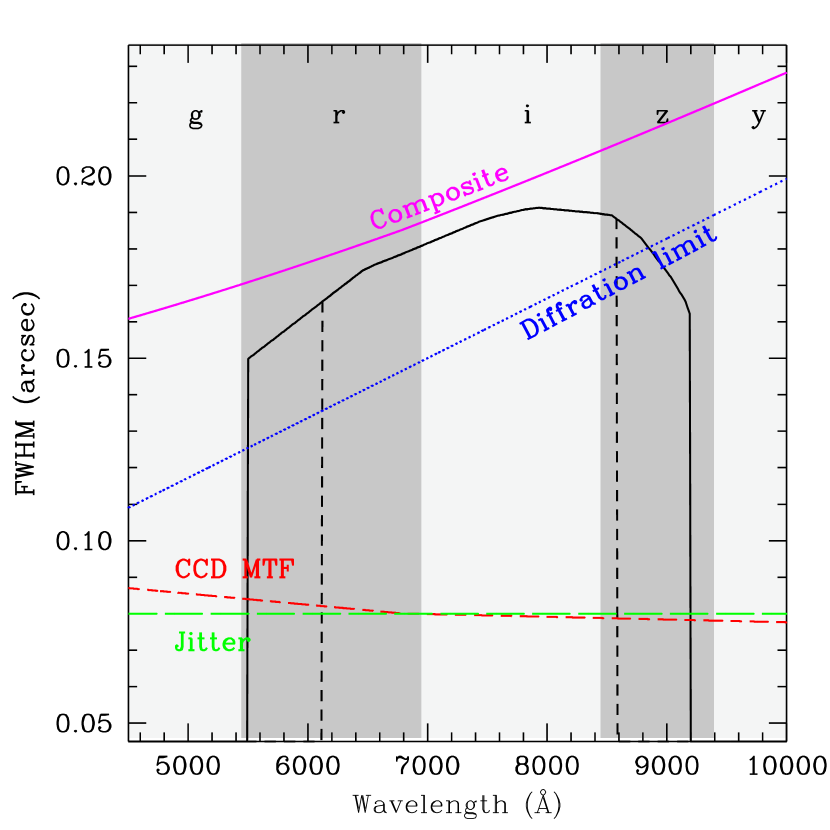
We consider a simple instrument model in which the PSF is made up of three circular components, each with a different wavelength-dependence. This is reasonable for a space-based instrument composed mainly of reflective surfaces, such as Euclid. For such an instrument the PSF ellipticity is relatively insensitive to wavelength and the three main PSF components are (i) nearly diffraction limited telescope optics giving rise to an Airy disk with size inversely proportional to the wavelength (ii) the CCD modulation transfer function (MTF) which tends to spread out higher energy photons more than lower energy photons and (iii) a wavelength independent part such as telescope jitter. We assume for simplicity that each component is Gaussian with a wavelength-dependent size.
We describe the total size of the PSF by its FWHM, , which is given by the quadratic sum of the FWHM values of the three components
| (6) |
Note that the addition in quadrature works reasonably well even if the diffraction limited component is not a Gaussian: we find adding FWHMs in quadrature works to better than 5 per cent accuracy when an Airy disk is convolved with a Gaussian of the same FWHM, and improves to better than 2 per cent accuracy if the ratio of FWHMs is changed by a factor of 4 either way.
The size of the diffraction limited image is given by
| (7) |
where is the diameter of the primary mirror. We take the contribution from the CCD MTF to be that measured empirically for an e2v CCD 231-84 (M. Cropper, priv. comm.), which is given approximately by
| (8) |
Finally, we take the contribution to the PSF size from the achromatic component to be
| (9) |
as appropriate for a Euclid-like instrument.
We plot the three contributions to the PSF image size in Fig. 2 for a 1.2 meter primary mirror. The image size is dominated by the diffraction limit of the instrument. Assuming the PSF contributions from different wavelengths all have the same centroid we can calculate the FWHM of the composite PSF from the FWHM of each component and the transmitted flux , where is the spectral energy distribution (SED) of the object and is the instrumental plus filter response, by
| (10) |
In this paper we assume is the instrumental response for the case where a wide optical F1 filter (5500–9200Å; see Fig. 2) is used for measuring the shapes of galaxies, as proposed for the Euclid satellite.
4 PSF and cosmology biases

We use realistic galaxy and stellar populations to quantify the amount by which the PSF FWHM is likely to be mis-estimated. Galaxy SEDs are generated using mock catalogues designed to simulate the distribution of redshifts, colours and magnitudes of galaxies in GOODS-N (Cowie et al., 2004; Wirth et al., 2004). Template spectra are taken from Coleman et al. (1980) and Kinney et al. (1996) and intermediate types obtained by linear interpolation of these templates (for further details see Abdalla et al., 2008). In this paper we include galaxies up to a redshift of 2. Galaxies more distant than this will have small apparent sizes and are thus unlikely to be used to measure cosmic shear. For instance, for the Cosmos survey, much less than 10% of the lensing usable galaxies have (Leauthaud et al., 2007). The PSF sizes for stars are estimated using stellar SEDs from the Bruzual-Persson-Gunn-Stryker (BPGS) Spectrophotometric Atlas777http://www.stsci.edu/hst/observatory/cdbs/ astronomical_catalogs.html#bruzual-persson-gunn-stryker.. The catalogue contains 175 different SEDs covering a broad range of spectral types. The true PSF size for each of the star and galaxy types in the mock catalogues is then estimated by inserting its SED into Eq. 10.
A histogram of the FWHM distribution for the galaxy population is shown in Fig. 3. The PSF size ranges from approximately 0.175” to 0.220”, has an average of 0.1922” and a dispersion of 0.006”, or 3% of the mean PSF size. As an example, the FWHM of a G5 sub-giant star (taken here as a typical disk star) is typically 0.1884 arcsec, whereas a K0 giant star (typical halo/bulge star) is typically 0.1897 arcsec. In a conventional analysis which ignores the wavelength-dependence of the PSF, galaxies with small angular separations from the above two example stars will often have their shears underestimated. In fact, out of all the stars in the BPGS catalogue only a quarter of them (cold K and M stars) have PSF estimated-sizes larger than the average of the galaxies. The multiplicative shear mis-estimates for the example G5 and K0 stars are of the order of relative to the average galaxy, in clear disagreement with our requirements on the PSF size error (Eq. 1) and therefore we need to explore methods for mitigating the effect. Below we describe two methods for correcting the PSF wavelength-dependence using colour information.
Fluxes are obtained for each object in the mock catalogues for the filters , , and up to the limiting magnitudes 26.25, 24.0, 24.0 and 24.0 respectively (AB magnitudes, detections). In addition, we consider different scenarios for the complementary ground based photometry. We assume here observations in the filters and with three different depths each, shallow, medium and deep (see Table 1). The fiducial optical depth used in this paper (medium) is chosen to correspond to a DES or Pan-STARRS type survey with two dedicated telescopes (PS2). Shallow and deep correspond to a Pan-STARRS type survey with one (PS1) or four (PS4) dedicated telecopes.
| Band | PS1 | PS2 | PS4 | DES |
|---|---|---|---|---|
| 24.66 | 25.53 | 26.10 | 25.35 | |
| 24.11 | 24.96 | 25.80 | 24.85 | |
| 24.00 | 24.80 | 25.60 | 25.05 | |
| 22.98 | 23.54 | 24.10 | 24.65 | |
| 21.52 | 22.01 | 22.50 | 22.15 |
 |
 |
 |
 |
4.1 Broad-band colour method
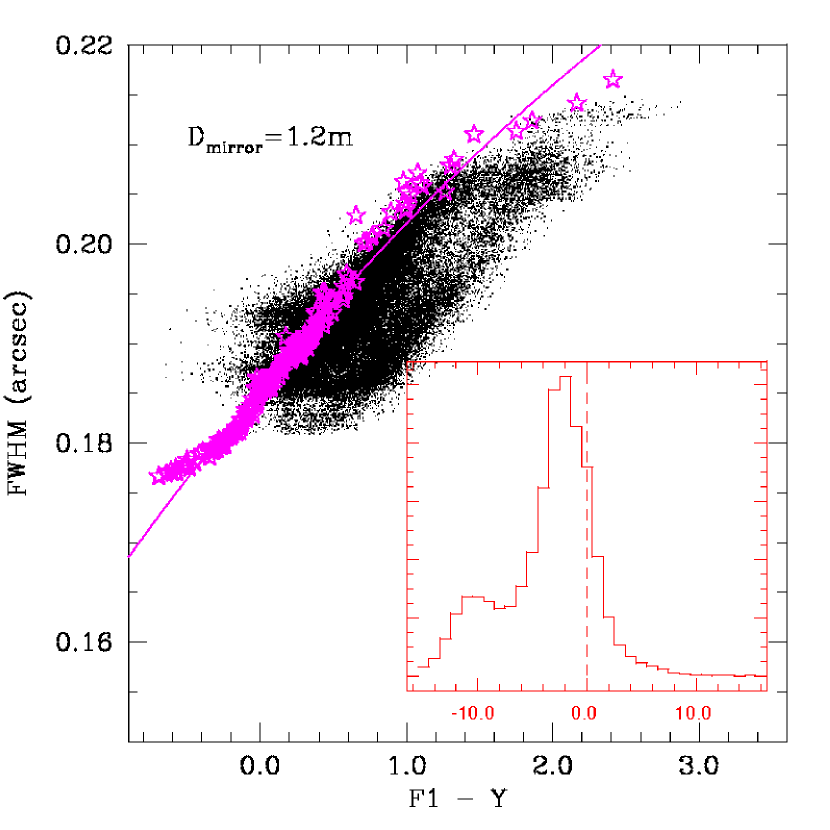
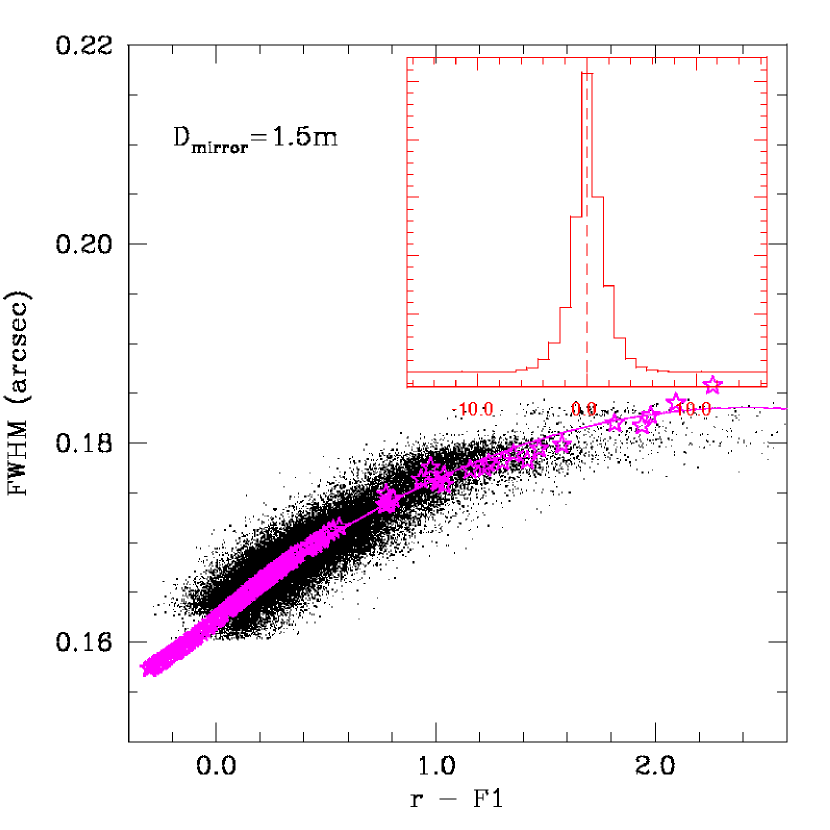
Here we investigate the possibility of estimating the galaxy PSF from stars with the same broad-band colour. For this to work well two conditions must be met () there must be a good correlation between a given broad-band colour and the PSF size and () this relation must be the same for both stars and galaxies, despite their potentially differing spectra. To assess the extent to which this applies for our fiducial instrument we have plotted the PSF sizes for the galaxy and stellar populations against two different colours: , which can be fully determined by an instrument containing a single optical filter plus the infra-red band, such as the proposed Euclid design; and , which requires -band observations which could come from the ground. The results are shown in the top two panels of Fig. 4.
It is clear from Fig. 4 that there is a positive correlation between the PSF FWHM and the colour i.e. redder objects tend to be larger than bluer ones. This is unsurprising given that the contribution to the PSF size from the diffraction limit of the telescope is the dominant component. It is also clear that the correlation between the PSF size and the colour is tighter than with the colour. We expect this to occur because the colour constrains the slope of the SED within the lensing measuring filter F1, whereas the colour constrains the SED slope at redder wavelengths, which are less relevant. This interpretation is strengthened by the fact that other colours such as , and , which are also able to constrain the slope of the SED over the shape measuring filter, produce correlations almost as tight as those for .
For the distribution of stellar SEDs used in this paper, we can see from Fig. 4 that the stars occupy a well defined locus in the FWHM versus colour space. We fit a parabola to this data and by doing so we can estimate the PSF size from a colour alone. From the figure we see that this line fits well through the stellar data points and thus we meet condition () for the stars. It is fortunate that the wavelength-dependence of the PSF tends to be, to a first approximation, relatively stable. This means that it is viable to use data from several high signal-to-noise stars from several different fields to empirically find this locus (provided that the wavelength independent effects on the PSF are properly dealt with). To test condition () we have to assess how well the PSF size-wavelength-dependence for galaxies follows that of the stars. We therefore calculate the residuals between the FWHM of the galaxies and the fit to the stellar FWHM-colour relation (shown in the insets of the figure).
The bias on the PSF size, , is reduced dramatically by including ground-based photometry, decreasing in magnitude from arcsec for to arcsec for 888Unless otherwise stated, the photometry depths are for a ‘medium-depth’ survey, corresponding to a PS2 survey (see Table 1 for depths in the and bands).. For a simple calculation in which the dependence of the multiplicative bias on redshift is not taken into account, we find from Eq. 2 that must be arcsec for a typical PSF size of arcsec. The inclusion of ground-based photometry thus allows us to meet our simple ‘back-of-the-envelope’ requirement (Eq. 2). Using a shallower -band photometry depth (PS1-like) increases the bias by a factor of 2.5 from the value with the fiducial (medium) depth. However, using a deeper ground-based photometry depth (PS4-like) has no effect on the bias. This suggests that there is an intrinsic difference between the distribution of PSF sizes for typical star and galaxy SEDs (measured in the band) with the same colour, which is not reduced by increasing the photometry depth beyond ‘medium’.
The wavelength-dependence of the PSF size can be reduced by increasing the size of the primary mirror (since the telescope is diffraction-limited). We find that the bias is reduced by a factor of 1.6 by increasing the mirror diameter from the fiducial value (1.2m) to 1.5m (Fig. 4 bottom-left panel)999For these simulations the changes in the instrumental configuration do not change the signal-to-noise of the observations, thus the same galaxies are observed in all cases.. For instance, for a space telescope, such as the HST, with a 2.4m mirror, the diffraction component will contribute the same as the CCD MTF and the jitter at Å. In this case the overall optics becomes much less chromatic, in particular for bluer wavelengths where the CCD MTF partially compensates the diffraction effect. This is directly reflected in the bias we estimate as gets to be as small as arcsec (less than 5 times the value of our default configuration). On the other hand a mirror as small as 0.6m will induce a bias in the PSF size of arcsec, or 2.5 times larger than the bias we obtained with the fiducial configuration.
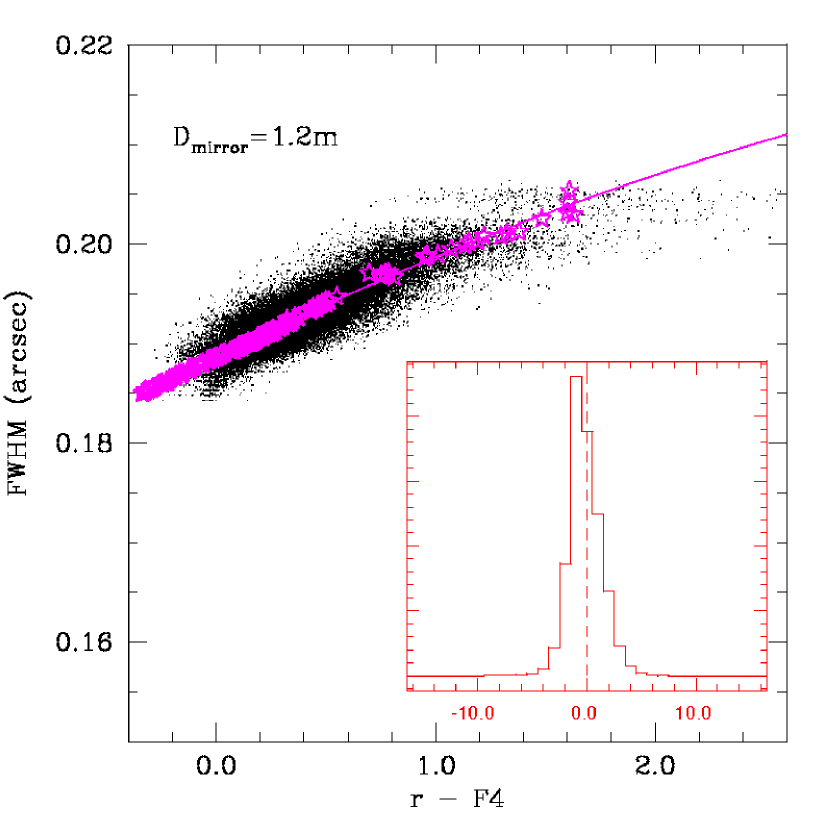
Another way to reduce the chromaticity of the system is by using a shape measurment filter F4 whose passband is 2/3 narrower than F1 (See Fig. 2).By using the narrower shape measurement filter we increased to absoute bias value from +0.16 to -0.18 miliarcsec. As we can see in Fig. 4 (bottom-right panel), this configuration indeed decreases the slope of the PSF FWHM–colour relation for stars and galaxies. However, for this particular colour of choice (), the ‘matching-up’ of stars and galaxies becomes poorer. If, for instance, we use the colour instead we get a bias of -0.11, that captures the improvement we expected by using a narrower filter.
4.1.1 Redshift dependence
Galaxies with the same intrinsic spectra will have different observed colours as a result of the range of galaxy redshifts. The bias on the PSF FWHM is thus redshift-dependent, and could potentially be very damaging to weak-lensing tomography. In the previous section we calculated the mean bias on the PSF FWHM for the galaxy SEDs averaged over all redshifts included in the catalogue (). In this section we investigate the effect of the redshift dependence of the galaxy colours.
Fig 5 shows the redshift dependence of for the fiducial scenario (dashed red line). There is a large negative bias at high redshift which will affect a small fraction of galaxies. We also see clearly the biggest limtation of our global average method, since in that method positive and negative contributions will cancel.
We propagate this through to dark energy related cosmological parameters as explained in Section 2 and divide the biases on the parameter values by the statistical errors on the parameters found using the standard Fisher matrix approach, for a 20,000 square degree survey with 35 galaxies per square arcminute and a total uncertainty on each shear component of . The results are shown in Table 2.

| Colour Information | Lensing | Photometry | ||||
|---|---|---|---|---|---|---|
| (m) | filter | depth | ||||
| Broad-band colour method | ||||||
| 1.2 | Medium | -0.05 | 0.17 | -0.47 | ||
| 1.2 | Shallow | -0.15 | 0.34 | -0.79 | ||
| 1.2 | Deep | -0.05 | 0.17 | -0.47 | ||
| 1.5 | Medium | -0.04 | 0.14 | -0.36 | ||
| 1.2 | Medium | -0.10 | 0.35 | -0.49 | ||
| Template-fitting method | ||||||
| 1.2 | Medium | 0.03 | 0.10 | -0.43 | ||
| 1.2 | Shallow | 0.12 | 0.18 | -0.72 | ||
| 1.2 | Deep | -0.02 | 0.06 | -0.24 | ||
| 1.5 | Medium | 0.02 | 0.07 | -0.31 | ||
| 1.2 | Medium | 0.01 | 0.07 | -0.15 | ||
We see that, for all configurations all the dark energy parameter biases we get are smaller that the expected statistical errors. In particular, for , the most demanding parameter those surveys are trying to determine, the bias corrected by the broad-band colour method is less than a half of the statistical error level for our fiducial survey configuration. The other trends follow those already discussed in the context of the global averaged biases discussed in the beginning of this Section.
4.2 Template-fitting method
The previous section assumes that we use a single colour to determine the correct PSF model to use for a given galaxy. In practice we will have more than two filters, which will be used to calculate photometric redshifts. We therefore also consider the use of a template fitting method to predict the PSF FWHM of a galaxy by using all the colours available. Using ANNz (Collister & Lahav, 2004) we trained and validated a neural network using approximately one third of the simulated galaxies available, to predict the redshifts, spectral types and reddening of each galaxy, given the multi-colour information. With this information we can compute the SED of each object and use a model of the PSF wavelength-dependence to predict the PSF FWHM for this galaxy.
A telescope model and stars will be used to build this model for the wavelength-dependence, and the accuracy of the model will depend on the stability of the wavelength-dependence with telescope properties, and the number of stars available to calibrate which model to use. In the case of the Hubble Space Telescope, a PSF model taken from the telescope design is routinely used in conjunction with calibration from any stars in the field to assess the telescope configuration in a given observation. Therefore in this paper we use the exact model as given in Eq. 10 and propagate the noisy and potentially biased galaxy SED estimates through to PSF biases and cosmological parameter biases.
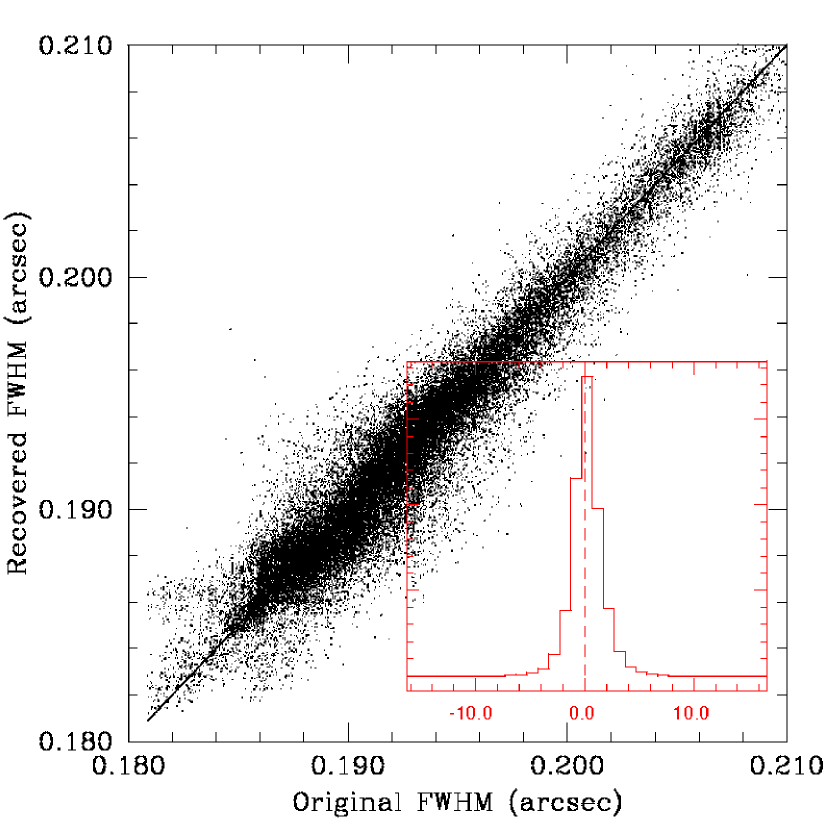
The comparison between this predicted PSF FWHM and the truth for the exact galaxy SED and redshift can be seen in Figure 6. We can also compare the global averaged bias to compare with the results we got from the broad-band method and understadn the trends. By using our standard configuration we obtain a bias of miliarcsec, which is similar from what we got by using one single colour and also met our back-of-envelope requirment (See Fig. 6). The use of deeper photometry, a larger 1.5m mirror or the narrower lensing filter F4 reduced to +0.18, +0.13 and +0.12 respectively, following the expected trends.
The redshift dependence of the PSF FWHM bias is shown for the fiducial scenario (solid black line) and for a senario with the lensing filter F4 (dot-dashed blue line) in Fig. 5. Both cases show much less redshift evolution than the broad-band colour method, in particular for .
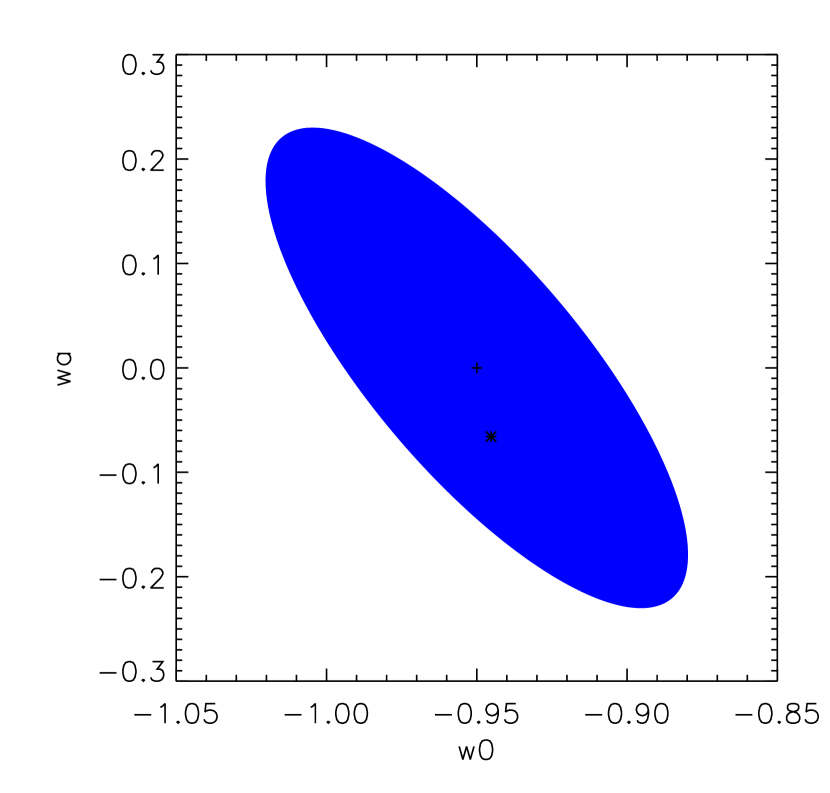
We propagate this (and all the other scenarios) through into biases on cosmological parameters and find the results given in the second line of Table 2. All the biases are smaller than the statistical errors. In Fig. 7 we show the statistical confidence level uncertainties in the space for our fiducial scenario. It can be seen in the figure that the residual bias after the correction of the wavelength-dependence is well within the 68% CL. In comparison to the broad-band colour method the template fitting method produces smaller biases on cosmological parameters and takes more advantage of the deeper photometry. In this case by using the deepest photometry (PS4-like) we could see actual improvement when compared to the default, medium depth (PS2/DES-like).
4.3 Requirements on a simple wavelength-dependence model
Now we consider requirements on the parameters of a simple model for PSF FWHM wavelength-dependence for the template fitting method. We approximate the FWHM-wavelength relation to be a simple linear function. The fiducial configuration is most closely approximated by a straight line whose slope is equal to arcsec/Å with FWHM(7350Å) = 0.192”. We consider a range of slopes, from a pure wavelength independent PSF to a relation twice as steep as the fiducial configuration. In all the cases we kept the PSF FWHM constant at Å, which are the central wavelenth of the lensing filters we are considering. In Figure 8 we show the variation of the systematic to statistical error for the dark energy parameters , and for the case where the wavelength-dependence of the PSF has been corrected using the template-fitting method.
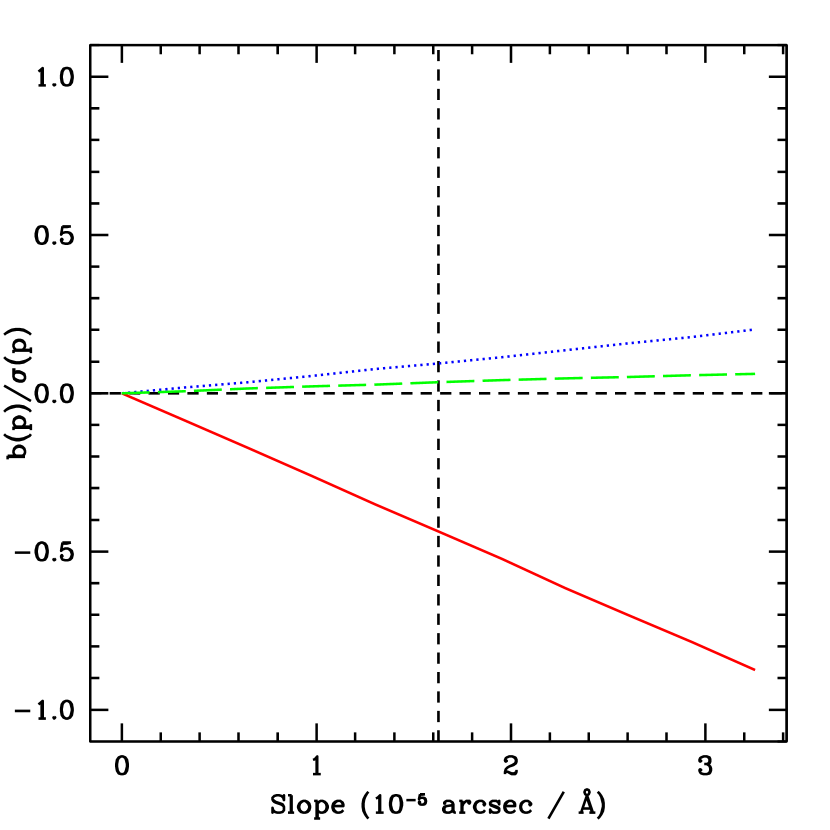
In this Figure, as expected, one can see that the bias on cosmological parameters increases as the wavelength-dependence of the PSF gets stronger. For all dak energy parameters the biases lie within the region where the statistical errors are larger than the systematic ones . For the evolution of the dark energy equation of state parameter the normalised bias approaches unity when the slope is double the value for the fiducial telescope mirror size and filter width.
5 Discussion
The wavelength-dependence of the point spread function is an effect that has to be carefully considered for the next generation of cosmic shear experiments, particularly if wide bands are used for imaging. The different spectral energy distributions of stars and galaxies means that the point spread function obtained from stars is not the same as that for the galaxies and this can lead to a non-negligible bias in shear measurements.
We have, for the first time, set out a formalism for testing the wavelength-dependence of the point spread function for diffraction limited imaging, using the parameters of a Euclid-like survey. Given these characteristics the dominant wavelength-dependence comes from the PSF size, which we parameterise by the PSF full-width at half maximum intensity. We have shown that the fractional difference in PSF FWHM between the stars and the galaxies must be smaller than . We find the same fractional requirement on the PSF ellipticity difference. We have illustrated the formalism on a fiducial Euclid-like telescope for which only the PSF size is significantly wavelength dependent.
We investigated two different methods for correcting the effect and found that although they give similar results for the average PSF error, the different dependencies of the PSF size bias on redshift leads to very different implications for biases on cosmological parameters. For this type of analysis it is therefore necessary to take into account the redshifting of galaxy spectra and the cosmological parameters of interest.
The first correction method we consider matches stars of a given colour to galaxies of the same colour. This is not expected to be a perfect correction method because the spectral energy distributions of two objects with the same colour are different. The stars and galaxies need to be matched up so they have similar SEDs within the imaging band used for cosmic shear galaxy shape measurement. This is best achieved if the colour considered matches well to the imaging band. We find that a telescope with a wide optical band plus infra-red bands cannot sufficiently self-correct for PSF wavelength-dependence using the optical minus infra-red colour (). This is expected because the difference in luminosity between bands so widely spaced is not well correlated with the variation in luminosity within the optical band itself. The PSF FWHM of the stars is on average arcsec and a fractional error of , much greater than our requirement () .
To realise the full potential of cosmic shear, all planned surveys will estimate the galaxy redshift using photometric redshifts. This places stringent requirements on having additional photometry in multiple wavebands, which may be obtained from the ground or from space. This provides the ideal input into correction for the wavelength-dependence of the PSF. We consider the colour rF1, which provides much more useful information about the spectral energy distribution in the F1 optical band. The average difference in PSF FWHM between the stars and galaxies now meets our requirement. The redshift dependence shows some evolution and tends to present larger values for redshifts larger than 1.0. However we find that the dark energy equation of state evolution parameter will not be biased by more than the statistical error if this method is used, even in the case where we use a shallow ground based photometry.
We therefore consider an additional method in which the full range of available wavebands are used, to match those used in photometric redshift estimation. We take advantage of the fact that many methods for estimating the galaxy photometric redshift also provide an estimate of the galaxy spectral energy distribution. This allows a full model of the galaxy spectrum to be used in correcting for the PSF wavelength-dependence. The extent to which this is helpful depends on how well the instrument PSF wavelength-dependence is already known. We do already have a reasonable model for the wavelength-dependence. Additionally we expect the wavelength dependence to be quite stable as a function of time, and furthermore it should be very well calibratable using stars. In this work we assume that the model for the wavelength-dependence is therefore very well known, and the limiting factor in the analysis comes from uncertainties in the galaxy photometry, which limit our knowledge of the galaxy redshift and spectral energy distribution. We find for the several cases we tested that the redshift dependence of the bias is smaller, when compared to the broad-band method and, as a consequence, the dark energy cosmological parameter biases are also smaller.
We consider the effect of a different telescope mirror size and imaging filter width. We find that the large mirror size does decrease the biases, as expected due to the smaller contribution to the wavelength-dependence from the diffraction limit. The reduction is around 20 per cent for both correction methods. Using a narrower filter reduces the scatter on the PSF FWHM but does not decrease the bias, for our particular configuration.
Finally we consider a general linear PSF wavelength-dependence which matches well to the Euclid-like fiducial configuration. This allows a requirement on the linear slope of the PSF to be obtained for a given required accuracy on cosmological parameters. We find that, by using the template fitting method, a survey in which the wavelength-dependence of the PSF is twice as strong as our fiducial Euclid-like survey just meets the requirement that .
In this work we have studied the first order effects of a wavelength dependent PSF and have shown that this effect can be mitigated with the addition of photometric data. The next step is to consider higher order effects such as colour gradients and the spatial correlation function of galaxy colours. These issues will be tackled and discussed in later work.
Acknowledgements.
We are grateful to Peter Capak for providing the code used to generate the mock photometric catalogue. We thank Mark Cropper, Jerome Amiaux, Peter Doel, Ofer Lahav, James Kingston, Steve Kent, Michelle Antonik, Stephane Paulin-Henriksson, Gary Bernstein, Tom Kitching, Alexie Leauthaud and Gary Bernstein for helpful conversations. ESC acknowledges support from FAPESP (process number 2009/07154-8). LMV acknowledges support from STFC. SLB and FBA thanks the Royal Society for support in the form of a University Research Fellowship. The research described in this paper was performed in part at the Jet Propulsion Laboratory, California Institute of Technology, under a contract with the National Aeronautics and Space Administration.
References
- Abdalla et al. (2008) Abdalla F. B., Amara A., Capak P., Cypriano E. S., Lahav O., Rhodes J., 2008, Monthly Notices of the Royal Astronomical Society, 387, 969
- Amara & Réfrégier (2007) Amara A., Réfrégier A., 2007, Monthly Notices of the Royal Astronomical Society, 381, 1018
- Bridle et al. (2009) Bridle S., et al., 2009, Annals of Applied Statistics, 3, 6
- Coleman et al. (1980) Coleman G. D., Wu C.-C., Weedman D. W., 1980, Astrophysical Journal Supplement Series, 43, 393
- Collister & Lahav (2004) Collister A. A., Lahav O., 2004, Publications of the Astronomical Society of the Pacific, 116, 345
- Cowie et al. (2004) Cowie L. L., Barger A. J., Hu E. M., Capak P., Songaila A., 2004, Astronomical Journal, 127, 3137
- Guzik & Bernstein (2005) Guzik J., Bernstein G., 2005, Physical Review D, 72, 043503
- Heymans et al. (2006) Heymans C., et al., 2006, Monthly Notices of the Royal Astronomical Society, 368, 1323
- Hoekstra & Jain (2008) Hoekstra H., Jain B., 2008, Annual Review of Nuclear and Particle Science, 58, 99
- Huterer et al. (2006) Huterer D., Takada M., Bernstein G., Jain B., 2006, Monthly Notices of the Royal Astronomical Society, 366, 101
- Kaiser et al. (1995) Kaiser N., Squires G., Broadhurst T., 1995, Astrophysical Journal, 449, 460
- Kinney et al. (1996) Kinney A. L., Calzetti D., Bohlin R. C., McQuade K., Storchi-Bergmann T., Schmitt H. R., 1996, Astrophysical Journal, 467, 38
- Laureijs (2009) Laureijs R., 2009, ArXiv e-prints 0912.0914
- Leauthaud et al. (2007) Leauthaud A., et al., 2007, Astrophysical Journal Supplement Series, 172, 219
- Lewis (2009) Lewis A., 2009, ArXiv e-prints 0901.0649
- Massey et al. (2007) Massey R., et al., 2007, Monthly Notices of the Royal Astronomical Society, 376, 13
- Munshi et al. (2008) Munshi D., Valageas P., van Waerbeke L., Heavens A., 2008, Physics Reports, 462, 67
- Paulin-Henriksson et al. (2008) Paulin-Henriksson S., Amara A., Voigt L., Refregier A., Bridle S. L., 2008, Astronomy and Astrophysics, 484, 67
- Refregier (2003) Refregier A., 2003, Ann. Rev. Astron. Astrophys., 41, 645
- Refregier et al. (2010) Refregier A., Amara A., Kitching T. D., Rassat A., Scaramella R., Weller J., Euclid Imaging Consortium f. t., 2010, ArXiv e-prints 1001.0061
- Voigt & Bridle (2009) Voigt L. M., Bridle S. L., 2009, ArXiv e-prints 0905.4801
- Wirth et al. (2004) Wirth G. D., et al., 2004, Astronomical Journal, 127, 3121
Appendix A Multiplicative and additive shear measurement errors from PSF mis-estimates
We follow Paulin-Henriksson et al. (2008), who define object size and two-component ellipticity in terms of unweighted quadrupole moments as
| (11) | |||||
| (12) | |||||
| (13) |
It is shown in Paulin-Henriksson et al. (2008) that the systematic bias on a galaxy ellipticity component can be approximated in terms of the mis-estimates of the PSF size and PSF ellipticity as
| (14) |
where are the original (pre-PSF but post shear) galaxy ellipticity components and is the galaxy size. Similar definitions apply for the PSF ellipticity and size. This assumes the PSF and galaxy size and ellipticity measurements are made using unweighted quadrupole moments. This propagates into a bias on the shear estimate as
| (15) |
where is the shear responsivity given by for simple shear measurement methods. Similarly .
In this paper we quantify object sizes in terms of the slightly more intuitive quantity, the Full-Width at Half-Maximum (FWHM), where
| (16) |
for a Gaussian profile, which we use for the PSF component in this paper. We combine Eq. 1, Eq. 16 and Eq. 15 and compare with Eq. 14 to find
| (17) | |||||
| (18) |
where the second term in dominates for typical future surveys because is small, in addition to the small value of the fractional uncertainty in the PSF FWHM. We have ignored the contribution to from intrinsic galaxy ellipticities, as appropriate for the case where the average over randomly oriented galaxy ellipticities is required. Where useful we have converted PSF sizes into FWHM values but we have left galaxy sizes written using since the conversion from to is dependent on object profile, and is far from Gaussian for galaxies. As in Paulin-Henriksson et al. (2008) we assume and thus . Thus, as expected, multiplicative errors arise from errors in the PSF size and additive errors arise from errors in the PSF ellipticity.