Inequivalent routes across the Mott transition in V2O3 explored by X-ray absorption
Abstract
The changes in the electronic structure of V2O3 across the metal-insulator transition induced by temperature, doping and pressure are identified using high resolution x-ray absorption spectroscopy at the V pre -edge. Contrary to what has been taken for granted so far, the metallic phase reached under pressure is shown to differ from the one obtained by changing doping or temperature. Using a novel computational scheme, we relate this effect to the role and occupancy of the orbitals. This finding unveils the inequivalence of different routes across the Mott transition in V2O3.
pacs:
78.70.En; 71.27.+a; 71.20.EhSome materials present metal-insulator transitions (MIT) without any changes in crystal structure or long-range magnetic order. These phenomena, known as Mott-Hubbard transitions, constitute a fundamental signature of strong electronic correlations. The physics emerging in the vicinity of these transitions is highly non-trivial and the properties of such materials depend on small changes in the electronic structure induced by external parameters Imada et al. (1998); Dagotto (2005). Several features of the MIT have been successfully clarified by resorting to realistic many-body calculations Georges et al. (1996). Yet, contrary to common assumptions, a growing number of experimental facts are revealing that this physical process is also strongly dependent on the route followed through the MIT. Here we show this to be the case for vanadium sesquioxide (V2O3). The isostructural MIT in Cr-doped V2O3 is considered as the textbook example of a Mott transition, which occurs between a paramagnetic insulator (PI) and a paramagnetic metallic (PM) phase by changing doping level (), temperature (T) or pressure (P) McWhan et al. (1973). As such V2O3 has served as a test bed for many theoretical models Castellani et al. (1978); Held et al. (2001); Elfimov et al. (2002); Keller et al. (2004); Poteryaev et al. (2007); Laad et al. (2006); Tanaka (2002) and a sustained experimental effort.
Among the different experimental methods recently employed to study the electronic properties of the Mott transition in Cr-doped V2O3 Limelette et al. (2003); Mo et al. (2003, 2006); Rodolakis et al. (2009), X-ray absorption spectroscopy (XAS) has played a crucial role. It was the detailed investigation of the V absorption edges Park et al. (2000) that demonstrated the necessity of abandoning the simple one band, , model to obtain a realistic description of the changes in the electronic structure at the phase transition. XAS can also be performed at the V -edge in the hard x-ray range: in this case, the pre-edge will carry most of the physical information we are interested in, as it is predominantly due to transitions. The excitations in this spectral region are influenced by the core hole and should be considered to be of an excitonic nature. The advantages over the edge studies are (i) a more straightforward interpretation (due to the simple symmetry of the -core hole, the multiplet structure reveals a direct view on the -states) and (ii) the possibility of applying external pressure as diamond anvil cells are compatible with hard X-rays.
We used V -edge XAS to explore extensively the MIT in V2O3 by changing temperature, doping and applying an external pressure. The pre -edges were analyzed by a novel computational scheme combining local density approximation and dynamical mean field theory (LDA+DMFT) Held (2007) with configuration interaction (CI) full multiplet ligand field calculations to interpret subtle differences at the PM-PI transition. This allowed us to: (i) observe in detail the changes in the electronic excitations, providing also a direct estimate of the Hund’s coupling ; (ii) analyze the physical properties of the PI and PM phase on both sides of the MIT, leading to the main result of our work: (iii) understand the difference between P, T or doping-induced transitions. This difference is mainly related to the occupancy of the orbitals, suggesting the existence of a new “pressure” pathway between PI and PM in the phase diagram.
The experiments were performed on the inelastic x-ray scattering (IXS) beamlines ID-26 and BM-30 at the European Synchrotron Radiation Facility (ESRF). We used high quality samples of (V1-xCrx)2O3 with various doping in the PM () and PI phases (, and 0.028) at ambient conditions. The MIT was also crossed for the 0.011 doping by changing temperature and for the 0.028 doping by pressure. To obtain the best resolution, the XAS spectra were acquired in the so-called partial fluorescence yield (PFY) mode de Groot (2001), monitoring the intensity of the V-K () line as the incident energy is swept across the absorption edge. Compared to standard XAS, the PFY mode provides better resolved absorption spectra as these are partly free from core-hole lifetime broadening effect. The gain is particularly appreciable at the transition metal pre-edges as the core-hole is extremely short lived with respect to the core-hole and the dipolar tail is strongly reduced. The V-K line was measured with the help of a IXS spectrometer equipped with a Ge(331) spherically bent analyzer. For the temperature dependence, the crystals were mounted in a cryostat installed on the spectrometer. On the other hand, measuring the PFY mode turned out to be difficult under pressure because of the weak fluorescence signal in the pressure cell and we opted for standard XAS measurements in transmission mode. To maximize the throughput, a powder sample () was loaded in a diamond anvil cell equipped with composite anvils made of a perforated diamond capped with a 500- thin diamond anvil. Pressure was measured in-situ by standard ruby fluorescence technique. We used silicon oil as a pressure transmitting medium.
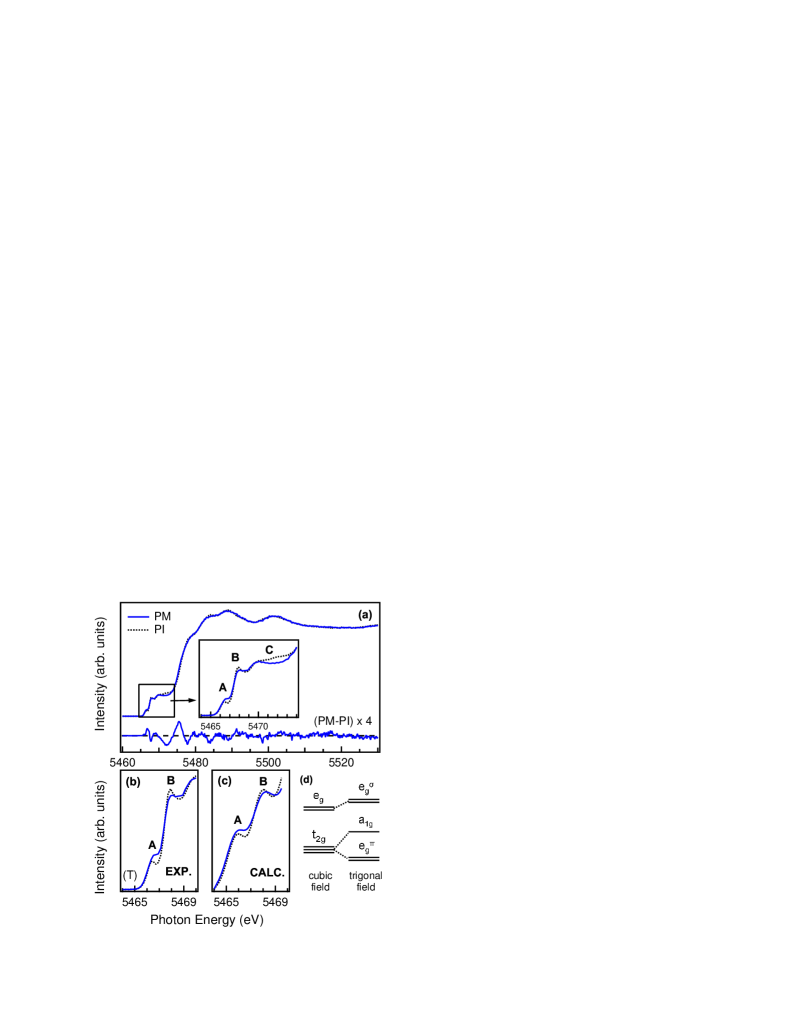
The T-dependent absorption spectra are displayed in Fig. 1(a) for both PM (200 K) and PI (300 K) phases for the , powder sample. The spectra have been normalized to an edge jump of unity. We will focus on the pre-edge region, where information about the V -states can be easier extracted. It can be decomposed into three spectral features (A,B,C) which all vary in intensity as the system is driven through the MIT whereas only C is considerably broadened (Fig. 1(a), inset). Notice that no feature is observed below peak A contrary to the early results of Ref. Bianconi and Natoli (1978) but in agreement with the more recent data of Ref. Goulon et al. (2000). Within a simplified atomic like picture, one could directly relate the intensity of features A,B and C to the unoccupied states. Starting from a V-, configuration, one can either add an electron to the subshell (split into one a1g and two e states under trigonal distortion of the V sites T. Saha-Dasgupta et al. (2007) as shown in Fig. 1(d)) yielding peaks A and B, or add an electron to the sub-shell which gives rise to the broader peak C. In this picture, one could associate peak A with a spin quartet () and peak B with a spin doublet (), split by the Hund’s rule exchange.
This picture is however oversimplified as the V electrons are strongly correlated and the spectra are still largely influenced by the core hole potential. Keeping that in mind, we have simulated the pre-edge by combining CI with LDA+DMFT calculations for which the one particle part (LDA) input corresponds to the level diagram in Fig. 1(d). We concentrate our analysis to peaks A and B, since peak C relates mainly to the unoccupied orbitals. These hybridize much stronger with the oxygen ligands and thus lack direct information on the Mott transition; peak C may also be related to non-local excitations (not included here) Gougoussis et al. (2009) which sensitively depend on the metal-ligand distance. Let us also note that the V sites in V2O3 are non centrosymmetric which leads to an on-site mixing of V- and V--orbitals and interference between dipole and quadrupole transitions Elfimov et al. (2002) which has been included in our scheme.
Our CI calculations confirm that for the ground state the occupancy ratio between the (,) and (,) states is smaller in the PI than in the PM phase Keller et al. (2004); Park et al. (2000): The isotropic CI-based calculated XAS spectra in the pre-edge region reported in Fig. 1(c) agree well with the experimental data for both the energy splitting of features A and B and the ratio of their spectral weight (SW) which increases in the PM phase.
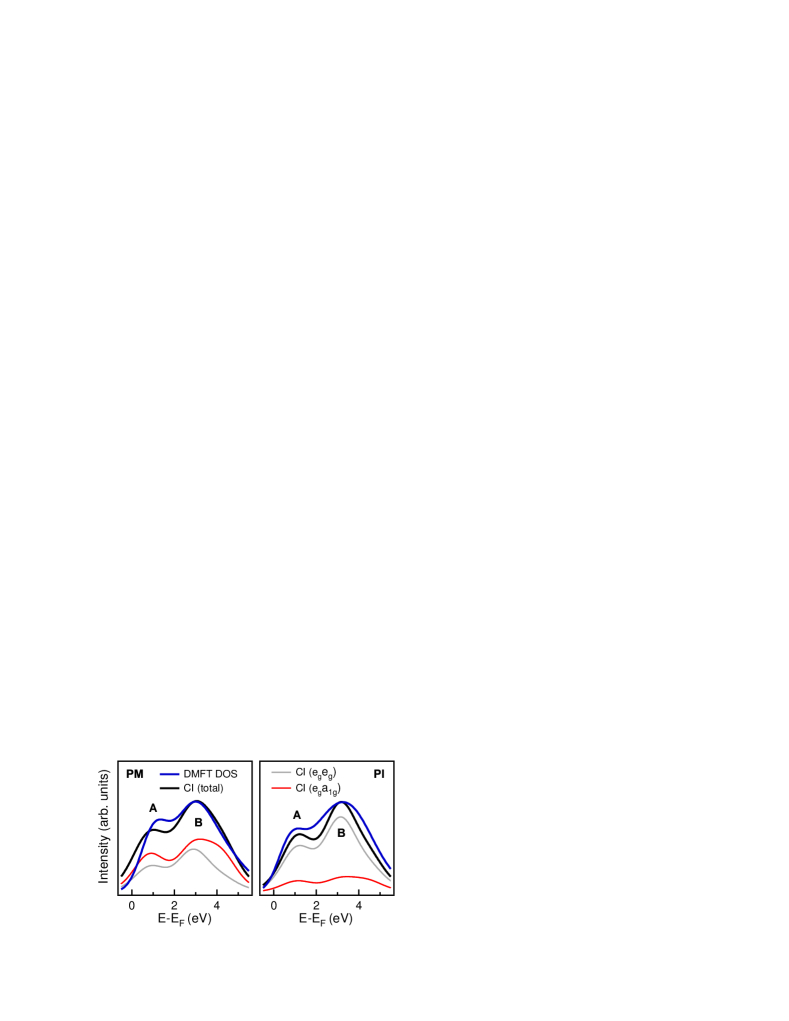
Considerable insight can be gained by comparing CI and LDA+DMFT calculations. Our LDA+DMFT calculations, performed using Nth-order muffin-tin orbital (NMTO) downfolded Hamiltonian for the 1.1% Cr-doped V2O3 and Hirsch-Fye Quantum Monte Carlo as impurity solver, confirm the above mentioned tendency (we obtain a mixing of : and : for the (,):(,) occupation in the PM and PI phases). For LDA+DMFT we have chosen the same interaction parameter eV for the PI phase as in Ref. Poteryaev et al. (2007) and followed their suggestion to slightly decrease its value in the PM phase (we assume eV)footnote . Remarkably the simple structure of the core hole potential in the -edge spectroscopy allows us to associate the pre-edge spectrum with the integrated spectral function above the Fermi energy calculated by LDA+DMFT. The electron–addition part of the spectral function shows three main features in PM phase: a coherent excitation at the Fermi level and a double peak associated to the incoherent electronic excitations i.e. the upper Hubbard band (UHB), similarly to the undoped compound. In the PI phase obviously, only the latter survives. Comparison with the experimental spectra clearly shows that the pre-edge features have to be related to the “incoherent” part of the spectral function only. The physical reason is that the core hole potential localizes the electrons destroying the coherent quasiparticle excitations and making the XAS spectrum atomic-like. All the “incoherent” LDA+DMFT, CI, and experimental spectra shown in Fig. 2 agree in many aspects, especially as for the splitting of the first two peaks by 2.0 eV (1.8 eV in experiment) which originates in LDA+DMFT from the Hund’s exchange in the Kanamori Hamiltonian. This further validates the choice of eV used in our calculations contrasting with larger values assumed in previous studies Keller et al. (2004); Laad et al. (2006); footnote , and also clarifies the mismatch between XAS and LDA+DMFT spectra reported in the undoped V2O3 compound Keller et al. (2004). Moreover, the ratio between A and B peak displays the same trend in the PM-PI transition as the CI (or experimental) data. The quantitative difference between the two calculations is attributed to the lack of matrix elements in LDA+DMFT.
The intensity ratio of the first two incoherent excitations peaks A and B (associated to the quartet and doublet states in the oversimplified picture) thus appears as the key spectral parameter to understand the differences between PM and PI. Even in a powder sample, this ratio is still sensitive to the orbital occupation of the initial state. Indeed, due to the trigonal distortion a considerable spectral weight transfer from the peak B to higher energies (corresponding to final states with two electrons in the limit of large ) can take place for the () but not for the () initial state. Therefore, the pre-edge XAS can serve as a direct probe of the orbital occupation in the ground-state. As a rule of thumb, the larger the ratio between the SW of A and B, the larger the orbital occupation.
Hard X-ray absorption also provides a unique way to explore the “pressure” pathway across the MIT, from which relevant information can be extracted by applying our interpretation scheme. Fig. 3(a) shows the XAS powder spectra of the P-induced MIT with the corresponding spectra for the T- and doping-driven transition (cf. the loci in the phase diagram, Fig. 3). To ease the comparison, the pressure dataset (P) obtained in transmission mode has been deconvolved from the Lorentzian lifetime broadening (1 eV FWHM) using the GNXAS code Filipponi (2000) to match the improved resolution of datasets () and (T) measured by PFY-XAS. Together with the PMPI differences in Fig. 3(b), Fig. 3(a) clearly evidences that, besides a rigid shift of the first two peaks of +0.13 eV and contrary to the doping- or T-driven transition, very small changes in spectral shapes and weights are observed in the P-driven MIT. In the light of the arguments discussed above, our finding proves that the metallic state reached by applying pressure is characterized by a much lower occupation of the orbitals compared to the metallic state reached just by changing temperature or doping. Importantly, the spectra measured through the doping induced MIT are identical within the experimental uncertainty to those measured through the T-driven transition. The temperature-doping equivalence is confirmed by our photoemission data displayed in Fig. 3(c,d) Rodolakis et al. (2009) and is consistent with the very similar lattice parameter changes across the transition McWhan and Remeika (1970). The and equivalence is also borne out by the observation from XAS at the -edges in doped V2O3 Park et al. (2000) that the occupation within both the PM or PI phases is mostly independent of the doping level. Hence, the local incoherent excitations probed by XAS at the V edge or pre-edge are not directly affected by disorder Frenkel et al. (2006).
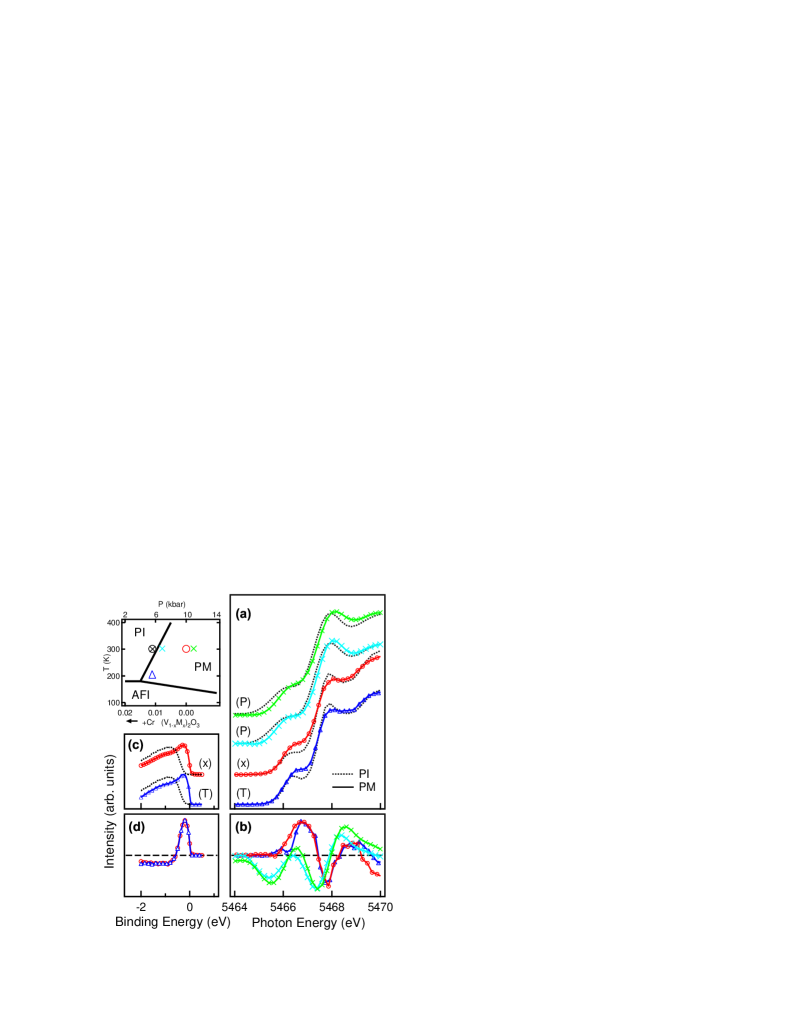
Our finding clearly shows the limits of the common assumption that temperature/doping- and pressure-driven MIT in V2O3 can be equivalently described within the same phase diagram McWhan and Remeika (1970),footnote2 . Indeed, the two different PM electronic structures that we observed reflect different mechanisms driving the MIT along different pathways. In the doping-driven MIT, the metallic phase is characterized by an increased occupation of the electrons indicating a reduced “effective crystal-field-splitting” as the main driving mechanism towards metallicity Keller et al. (2004); Poteryaev et al. (2007), related to the jump of the lattice parameter (1.4%) at the MIT McWhan and Remeika (1970). In contrast, when pressure is applied the occupation remains basically unchanged, so that this metallic phase seems to originate rather from an increased bandwidth, without any relevant changes of the orbital splitting. The smaller jump observed under pressure (0.7 %) corroborates our analysis.
In conclusion, doping, temperature and pressure are shown to act differently on the interplay between electron correlations and crystal field, so that states previously considered to be equivalent metals are actually different. We believe this finding may apply to many other strongly correlated systems presenting metal-insulator transitions, with pressure opening inequivalent pathways through their phase diagrams.
We thank E. Tosatti for stimulating discussions and acknowledge a BQR of the Université Paris-Sud, the “Triangle de la Physique”, the Austrian Science Fund (FWF, science college W004), and the EU research network RP7 MONAMI for financial support.
References
- Imada et al. (1998) M. Imada, A. Fujimori, and Y. Tokura, Rev. Mod. Phys. 70, 1039 (1998).
- Dagotto (2005) E. Dagotto, Science 309, 257 (2005).
- Georges et al. (1996) A. Georges, G. Kotliar, W. Krauth, and M. J. Rozenberg, Rev. Mod. Phys. 68, 13 (1996).
- McWhan et al. (1973) D. B. McWhan, A. Menth, J. P. Remeika, W. F. Brinkman, and T. M. Rice, Phys. Rev. B 7, 1920 (1973).
- Castellani et al. (1978) C. Castellani, C. R. Natoli, and J. Ranninger, Phys. Rev. B 18, 4945 (1978).
- Held et al. (2001) K. Held, I. Nekrasov, N. Blümer, V. Anisimov, and D. Vollhardt, Int. J. Mod. Phys. B 15, 2611 (2001).
- Elfimov et al. (2002) I. S. Elfimov, N. A. Skorikov, V. I. Anisimov, and G. A. Sawatzky, Phys. Rev. Lett. 88, 015504 (2002).
- Keller et al. (2004) G. Keller, K. Held, V. Eyert, D. Vollhardt, and V. I. Anisimov, Phys. Rev. B 70, 205116 (2004).
- Poteryaev et al. (2007) A. I. Poteryaev, J. M. Tomczak, S. Biermann, A. Georges, A. I. Lichtenstein, A. N. Rubtsov, T. Saha-Dasgupta, and O. K. Andersen, Phys. Rev. B 76, 085127 (2007).
- Laad et al. (2006) M. S. Laad, L. Craco, and E. Muller-Hartmann, Phys. Rev. B 73, 045109 (pages 15) (2006).
- Tanaka (2002) A. Tanaka, J. Phys. Soc. Jpn. 71, 1091 (2002).
- Limelette et al. (2003) P. Limelette, A. Georges, D. Jerome, P. Wzietek, P. Metcalf, and J. M. Honig, Science 302, 89 (2003).
- Mo et al. (2003) S.-K. Mo, J. D. Denlinger, H.-D. Kim, J.-H. Park, J. W. Allen, A. Sekiyama, A. Yamasaki, K. Kadono, S. Suga, Y. Saitoh, et al., Phys. Rev. Lett. 90, 186403 (2003).
- Mo et al. (2006) S.-K. Mo, H.-D. Kim, J. D. Denlinger, J. W. Allen, J.-H. Park, A. Sekiyama, A. Yamasaki, S. Suga, Y. Saitoh, T. Muro, et al., Phys. Rev. B 74, 165101 (2006).
- Rodolakis et al. (2009) F. Rodolakis, B. Mansart, E. Papalazarou, S. Gorovikov, P. Vilmercati, L. Petaccia, A. Goldoni, J.-P. Rueff, S. Lupi, P. Metcalf, and M. Marsi, Phys. Rev. Lett. 102, 066805 (2009).
- Park et al. (2000) J.-H. Park, L. H. Tjeng, A. Tanaka, J. W. Allen, C. T. Chen, P. Metcalf, J. M. Honig, F. M. F. de Groot, and G. A. Sawatzky, Phys. Rev. B 61, 11506 (2000).
- Held (2007) K. Held, Adv. in Phys. 56, 829 (2007).
- de Groot (2001) F. M. F. de Groot, Chem. Rev. 101, 1779 (2001).
- Bianconi and Natoli (1978) A. Bianconi and C. R. Natoli, Solid State Commun. 27, 1177 (1978).
- Goulon et al. (2000) J. Goulon, A. Rogalev, C. Goulon-Ginet, G. Benayoun, L. Paolasini, C. Brouder, C. Malgrange, and P. A. Metcalf, Phys. Rev. Lett. 85, 4385 (2000).
- T. Saha-Dasgupta et al. (2007) T. Saha-Dasgupta, O. K. Andersen, J. Nuss, A. I. Poteryaev, A. Georges, and A. I. Lichtenstein, arXiv:0907.2841 (preprint 2009).
- Gougoussis et al. (2009) C. Gougoussis, M. Calandra, A. Seitsonen, C. Brouder, A. Shukla, and F. Mauri, Phys. Rev. B 79, 045118 (2009).
- (23) Constrained LDA/LDA+U estimates of (0.93eV in Solovyev et al. (1996)) need to be reduced to eV to reproduce the constrained LDA energy splitting with the DMFT Hamiltonian Held (2007). Moreover, the value of U adopted for LDA+U (eV) has to be assumed smaller than that for LDA+DMFT to compensate deficiencies of LDA+U Sangiovanni et al. (2006).
- Filipponi (2000) A. Filipponi, J. Phys. B: At. Mol. Opt. Phys. 33, 2835 (2000).
- McWhan and Remeika (1970) D. B. McWhan and J. P. Remeika, Phys. Rev. B 2, 3734 (1970).
- Frenkel et al. (2006) A. I. Frenkel, D. M. Pease, J. I. Budnick, P. Metcalf, E. A. Stern, P. Shanthakumar, and T. Huang, Phys. Rev. Lett. 97, 195502 (2006).
- (27) An early version of the phase diagram (Fig. 15 in Ref. McWhan and Remeika, 1970) was drawn with a third pressure axis: due to the idea of - equivalence, this was later abandoned.
- Solovyev et al. (1996) I. Solovyev, N. Hamada, and K. Terakura, Phys. Rev. B 53, 7158 (1996).
- Sangiovanni et al. (2006) G. Sangiovanni, A. Toschi, E. Koch, K. Held, M. Capone, C. Castellani, O. Gunnarsson, S.-K. Mo, J. W. Allen, H.-D. Kim, et al., Phys. Rev. B 73, 205121 (2006).