Identifying Bright Stars in Crowded Environments Using Velocity Dispersion Measurements, and an Application to the Center of M32
Abstract
The identification of individual stars in crowded environments using photometric information alone is confounded by source confusion. However, with the addition of spectroscopic information it is possible to distinguish between blends and areas where the light is dominated by a single star using the widths of absorption features. We describe a procedure for identifying locations in kinematically hot environments where the light is dominated by a single star, and apply this method to spectra with 0.1 arcsec angular resolution covering the m interval in the central regions of M32. Targets for detailed investigation are selected as areas of localized brightness enhancement. Three locations where at least 60% of the band light comes from a single bright star, and another with light that is dominated by two stars with very different velocities, are identified. The dominant stars are evolving near the tip of the asymptotic giant branch (AGB), and have M5 III spectral type. The lack of a dispersion in spectral-type suggests that the upper AGB within the central arcsec of M32 has a dispersion in of only a few hundreths of a magnitude, in agreement with what is seen at larger radii. One star has weaker atomic absorption lines than the others, such that [M/H] is 0.2 dex lower. Such a difference in metallicity is consistent with the metallicity dispersion inferred from the width of the AGB in M32. The use of line width to distinguish between blends involving many relatively faint stars, none of which dominate the light output, and areas that are dominated by a single intrinsically bright star could be extended to crowded environments in other nearby galaxies.
1 INTRODUCTION
Stellar content studies of nearby galaxies are of fundamental importance for furthering our understanding of galaxy evolution. Unfortunately, source confusion presents a formidable obstacle for efforts to identify individual stars in even the closest galaxies. Stars that fall within a single angular resolution element will appear as a single source, with spectrophotometric properties that are a luminosity-weighted amalgam of the component stars. With the possible exception of the outermost regions of galaxies, almost all stars observed in external galaxies are blends, although in most cases these involve an intrinsically bright star and a much fainter star (or stars), such that the combined light can be considered to be that of the brighter source. A more insidious situation occurs when sources with similar properties are blended. Consider the implications on a stellar content study if two stars with the same brightness and color are blended together. The blend will be brighter than the component stars but have the same color, and such an object may be mis-interpreted as evidence for a younger and/or more metal-poor population than that of the component stars. While the incidence of blending among stars with comparable brightness drops markedly for objects that are in the most advanced stages of evolution, because such objects are relatively rare, this remains an issue for studies of the central regions of even the nearest galaxies (Renzini 1998).
There is a continuum in the severity of blending, and the key for stellar content studies is to identify locations in galaxies where the light output is dominated by one star. In this paper we discuss a technique for identifying such objects in crowded, kinematically hot environments. The core principle is that the spectra of blends in which no single star dominates the light output will have line widths that are defined by the velocities of the component stars, and hence that are comparable to the local velocity dispersion in the galaxy. Spectra of blends that are dominated by one star will have line widths that are considerably narrower. The application of the technique is demonstrated using observations of the center of the Local Group compact elliptical (cE) galaxy M32. M32 is an unsurpassed laboratory for honing techniques that are used to explore the star-forming histories of galaxies. It is at a favorable distance such that light from a representative sample of stars passes through a spectrograph slit with a width of a few arcsec, while individual stars can also be resolved throughout much of the galaxy. As a result, the stellar content of M32 can be probed by investigating the properties of both resolved stars and integrated light. In addition, the low interstellar gas content (e.g. Welch & Sage 2001) suggests that M32 is free of the dust that can complicate stellar content studies at visible wavelengths. Finally, the brightest stars in M32 have (Davidge 2000; Davidge et al. 2000; Davidge & Jensen 2007), and hence are well within the realm of being studied spectroscopically with existing telescopes.
Numerous studies have concluded that M32 is not a uniformly old stellar system, and contains a significant population of stars that formed within the past few Gyr, but not as recently as in the LMC. Indeed, the peak AGB brightness in M32 is M, which is magnitude fainter than the peak brightness seen among long period variables (LPVs) in the LMC (Fraser et al. 2005). Panoramic surveys have also found a number of AGB stars in the LMC that are at least as bright as those in M32 (Nikolaev & Weinberg 2000; Cioni et al. 2006). With M, the peak AGB brightness in M32 is comparable to that near the center of M31 (Davidge 2001), where there are spectroscopic signatures of an intermediate age population (e.g. Davidge 1997; Sil’Chenko, Burenkov, & Vlasyuk 1998). Adopting a distance modulus for the Galactic Center of 14.5, then the two brightest AGB stars in the sample of Galactic Bulge stars studied by Frogel & Whitford (1987), which are numbers 239 and 181 in their target list, have MK between –9 and –9.5. Many of the brightest AGB stars in M32 are LPVs with amplitudes of 1.0 magnitude in (Davidge & Rigaut 2004), and so the non-variable AGB-tip in M32 corresponds to M. Isochrones with solar metallicity from the compilation discussed by Girardi et al. (2002) indicate that this AGB-tip brightness is appropriate for a system with an age that is in excess of 1 Gyr, in agreement with studies of the integrated spectrum of M32 (O’Connell 1980; Davidge 1990; Bica, Alloin, & Schmidt 1990; del Burgo et al. 2001; Worthey 2004; Rose et al. 2005).
In the present study, three locations that are dominated by light from one star are identified in the central arcsec of M32, while a fourth location that is dominated by light from two stars that have very different velocities is also identified. These are the closest-in individual stars to be detected near the center of M32 at visible/near-infrared wavelengths. While five stars constitute an obviously limited sample, the data are sufficient to demonstrate the application of the technique. Even though the number of sources that are dominated by a single star and that can be identified at the diffraction limit of an 8 metre telescope near the center of nearby galaxies like M32 is modest, a 20 – 30 metre telescope that delivers moderately high Strehl ratios should be able to detect roughly an order of magnitude more resolved sources.
2 OBSERVATIONS & REDUCTIONS
The data used in this paper were discussed previously by Davidge et al. (2008) in their investigation of cE galaxies. In brief, spectra of M32 were recorded with NIFSALTAIR on Gemini North (GN) on the night of October 23, 2005 during NIFS commissioning. ALTAIR (Herriot et al. 2000) is the facility AO system at GN, while NIFS (McGregor et al. 2003) is an integral field spectrograph for use in the m wavelength interval. NIFS samples a arcsec2 area on the sky with 29 arcsec2 slitlets. A spectrum with a dispersion 5300 is recorded on the HAWAII-2RG HgCdTe detector in one of three (, or ) atmospheric windows during a single exposure.
The bright semi-stellar nucleus of M32 served as the reference source for AO correction. Six 600 sec exposures were recorded in the band, and each observation of M32 was followed by that of a blank sky field. Each M32 sky pair was differenced, and the results were divided by a flat-field frame. The flat-fielded data were wavelength calibrated using an Ar arc observation that was recorded on the same night as the M32 data. The wavelength-calibrated spectra were summed and then divided by the spectrum of a telluric standard star, which was observed immediately following the M32 observations.
There are a number of distinct sources with FWHM arcsec in the two-dimensional NIFS spectra, and these define the locations that are investigated in the remainder of the paper. The locations of these point sources are indicated in Figure 1, where (X,Y) = (0,0) is the center of M32, while the angular offsets of the sources from the center of M32 are listed in Table 1. The detection of objects along the X = 0 axis is hindered by elevated star counts along the major axis of M32, which runs close to X = 0 arcsec, and scattered light from the bright nucleus of M32.
A spectrum was extracted of each of the sources in Figure 1. The surface brightness in the central arcsec of M32 exceeds 11 mag arcsec-2 in (e.g. Jarrett et al. 2003), and thus contributes substantial noise to the extracted spectra. Indeed, the unresolved stellar background, rather than the ambient ‘sky’, is the dominant source of noise in studies of stars near the centers of most nearby galaxies. A mean background spectrum was constructed from galaxy light bracketing each source, and the result was subtracted from the extracted spectrum. The background-subtracted spectra were binned along the dispersion axis to increase the signal-to-noise ratio, and the final spectral resolution is . The continuum was also removed from the spectra in preparation for the velocity dispersion analysis.
3 VELOCITY MEASUREMENTS
With an image quality of FWHM arcsec, each angular resolution element near the center of M32 samples an area with an integrated magnitude M, which is comparable to that of a Galactic globular cluster. Consequently, all of the sources in Figure 1 are blends, in the sense that light from more than one star falls within each angular resolution element. In addition, only objects that have an intrinsic brightness that is comparable to or greater than that in each angular resolution element (i.e. M in this case) will be resolved. The AGB-tip in M32 occurs near K = 15.5, which corresponds to M (Davidge et al. 2000; Davidge & Jensen 2007), and so any sources identified here are evolving near the AGB-tip.
Are there locations in the NIFS dataset where the light is dominated by a single bright star? Line width measurements are one way to determine if such locations are present. If the light in a blend originates from a large number of stars, with no single star contributing more than a small fraction of the light, then the absorption lines in the composite spectrum will be blurred by an amount that is comparable to the local velocity dispersion, , which is km sec-1 near the edges of the NIFS field. At the other extreme, if the light comes from only one star then the absorption lines will be narrow, with the line width defined by the spectral resolution of the instrument. There are a number of techniques for measuring , and in this study the Tonry & Davis (1979) routine, as implemented in IRAF, is employed.
A key issue is translating velocity dispersion into a measure of the amount of light that a bright single source contributes to the total light from a resolution element. Consider the spectrum of a location Sloc on the sky that contains light from a star S∗, which contributes a fraction of the light, combined with that of a population of other fainter objects Sother, which together contribute a fraction of the light. The reader is reminded that Sloc, S∗, Sother, and are all functions of wavelength, but this is not indicated here in the interest of brevity. The spectrum of this location is the luminosity-weighted sum of these components:
To measure the velocity dispersion the spectrum of the target location is convolved with that of a reference star, Sref:
where convolution is indicated with the symbol . The Fourier transform of the cross-correlation function is then:
where the cross-correlation theorum has been applied, and denotes complex conjugation. This reduces to:
Applying the inverse transform then:
The cross correlation function of the composite spectrum with the reference star is thus the sum of the cross correlation functions of the components of the target spectrum with the reference star. The properties of the final cross-correlation function then depend on the properties of the various sources that contribute to the total light, their degree of similarity, not only among themselves but with the reference star, and the fractional contribution that each component makes to the total light.
In principle, a threshold value of the measured velocity dispersion that corresponds to some pre-defined value of can be determined from simulations, in which a spectrum corresponding to that of the dominant light source are added in various proportions to a spectrum representing the galaxy body that has been smeared to simulate the impact of velocity dispersion. The situation is simplified somewhat in near-infrared studies of intermediate age or older systems, as a large fraction of the band light comes from the brightest evolved stars. A consequence is that the spectra of the brightest resolved stars are similar to that of the underlying integrated light, making it is easier to match the reference star spectrum with those of the integrated galaxy light and any resolved stars.
A basic assumption is that the resolution elements that are dominated by individual stars have an underlying stellar component with a that surpasses that which can be measured from the data. Higher spectral resolutions will be required to detect single sources in fields with lower . It will thus prove more challenging to identify locations that are dominated by light from a single source in crowded enviroments where the stars have modest (at least when compared with the centers of galaxy bulges) random motions, such as globular clusters.
4 AN APPLICATION TO M32 NIFS SPECTRA
4.1 The Identification of Individual Stars
The velocity dispersions of the sources are listed in the last column of Table 1. The M0III star HR 4884, which was also observed with NIFS, was used as the reference template for these measurements. was measured in the m interval, which is where the S/N ratio is highest. The uncertainties in the measurements are km sec-1. The spectra of sources 10 and 14 were too noisey to allow velocity dispersions to be measured.
There is a broad range in velocity dispersions in Table 1, and half of the objects have km sec-1. Given that the velocity dispersion of M32 within the central 1.5 arcsec is km sec-1, then the majority of locations in the M32 NIFS spectra that contain a distinct point source are actually blends where the light originates from a mix of stars, with no single star dominating the light output. The appearance of a point source at these locations is simply the result of statistical flucuations in the stellar content.
For this study, we identify locations where at least 60% (i.e. ) of the light comes from a single star. Simulations were run in which an M5III spectrum (see below) was added in various proportions to M giant spectra that were smeared to km sec-1. An M giant spectrum was selected to represent the underlying light as this is consistent with the integrated band spectrum of M32 (Davidge 1990). These simulations indicate that locations with photometrically-distinct sources that have km sec-1 are those where at least 60% of the light comes from a single star.
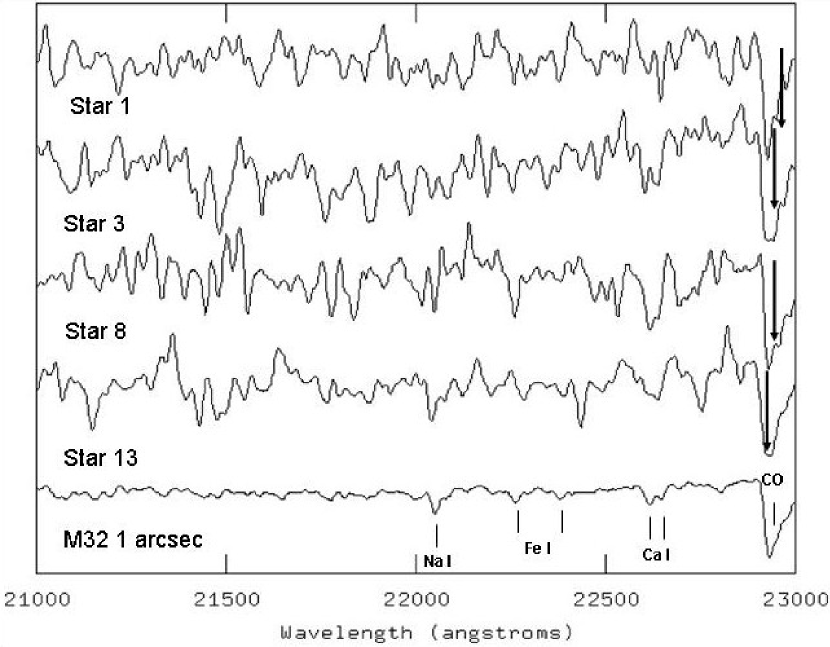
Three of the sources in Table 1 have km sec-1. A fourth source is also of interest, as the cross-correlation function with the reference star is double-peaked, suggesting that it is dominated by two stars that contribute equally to the light. The spectra of the sources with km sec-1 and of the two-star blend are shown in Figure 2. The spectra have low S/N ratios due to noise introduced by the bright unresolved body of fainter stars in M32. Still, the S/N ratio is such that the 12CO band head can be identified. As by far the most prominent feature in each spectrum, the 12CO band head dominates the velocity dispersion measurements. The depth of the 12CO band head is a measure of velocity dispersion, and this is demonstrated in Figure 2, where the mean spectrum of M32 at 1 arcsec radius from Davidge et al. (2008) is shown. The 12CO band heads in the mean M32 and Star 13 spectra have similar depths, as expected given their comparable velocity dispersions. However, the 12CO band heads in the spectra of Stars 1, 3, and 8 are much deeper, reflecting their lower velocity dispersions.
The velocity dispersions of Stars 1, 3, and 8 fall well below the range of velocity dispersions that are measured in integrated light throughout the central regions of M32. This is demonstrated in Figure 3, which shows the histogram distribution of velocity disperions measured in arcsec2 sections within the arcsec2 NIFS field of view. The arcsec2 area corresponds to that subtended by point sources in these data.
The histogram in Figure 3 contains measurements from locations that span a range of radii and position angles, and so the distribution is broader than expected from random measurement errors alone. In addition, the velocity dispersions measured for Stars 1, 3, and 8 are much smaller than what is measured in integrated light throughout the central regions of M32. Hence, the small velocity dispersions measured for these sources are not due to random flucuations in the velocity field.
4.2 Spectral Types and Line Strengths
The low S/N ratio of the extracted spectra notwithstanding, some information can be extracted by multiplexing the signal over a range of wavelengths, rather than relying on measurements made within narrow wavelength intervals, such as line index measurements. A basic piece of information that can be extracted are the spectral types of the resolved stars. This is relevant for stellar content studies because spectral-type can serve as a proxy for color, allowing comparisons to be made with photometric observations at larger radii.
Spectral types were determined by cross-correlating the M32 spectra with those of reference stars from Rayner, Cushing, & Vacca (2009), which were downloaded from the IRTF website. The IRTF spectra were re-sampled and smoothed to match the wavelength sampling and spectral resolution of the processed NIFS spectra. The height of the central peak in the cross-correlation function measures the degree of similarity between the two spectra. The amplitude of the cross-correlation peak can be biased by a single strong feature, such as the 12CO (2,0) band head. Therefore, in addition to correlations in the m wavelength interval, a second set of correlations was done in the m interval to avoid the 12CO band head and thereby base the spectral matching on the strengths of atomic and less prominent molecular features. Significantly, the cross-correlations involving the wavelength intervals with and without the 12CO band head produced consistent results, indicating that the spectral typing is not biased by a single strong feature.
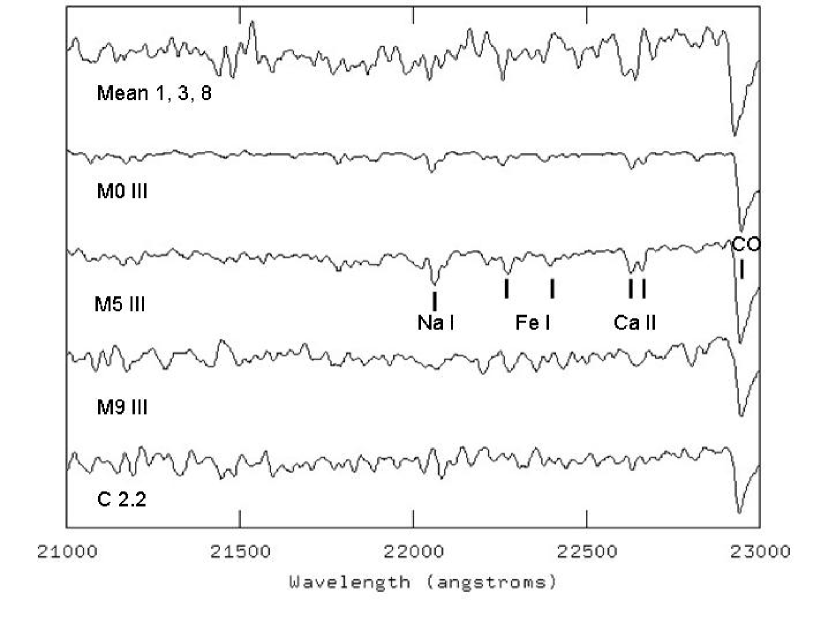
The highest degree of semblance resulted when the spectra in Figure 2 were compared with the M5III star. The next best fit was for M6III, while the peaks of the cross-correlation functions involving types M9III and C2.2 were substantially lower than those involving M0 III - M6 III stars. The degree of similarity between the near-infrared spectra of the M32 sources and the Galactic M5 III standard star is demonstrated in Figure 4, where the mean spectrum of sources 1, 3, and 8 is compared with that of selected stars from Rayner et al. (2009). The 12CO (2,0) band head and the lines of Na I, Fe I, and Ca I in the mean M32 spectrum are similar in strength to those in the M5 III spectrum.
The similarity in spectral-types is significant, as it indicates that the upper regions of the AGB in M32 are populated by stars with a narrow range in effective temperature. Adopting the relation between spectral type and from Bessell & Brett (1988) for solar neighborhood giants, then these sources have , which is consistent with the color of the upper AGB at larger radii in M32 (Davidge & Jensen 2007).
The amplitude of the cross-correlation function also contains information about the strengths of absorption features, albeit multiplexed over a range of elements. Davidge et al. (2008) found that the integrated spectrum of M32 falls near relations defined by solar neighborhood stars on the (Ca I, 12CO) and (Na I, 12CO) diagrams, suggesting that stars in M32 formed from material that experienced slow enrichment; hence, the use of solar neighborhood reference stars for abundance analysis is appropriate. The dominant features in the m wavelength interval are Ca, Na, and Fe lines, although other elements also contribute to these features (Silva, Kuntschner, & Lyubenova 2008). When cross-correlated with an M5III star in this wavelength range, the peaks measured for stars 3, 8, and 13 are very similar. However, the peak of the Star 1 cross-correlation function is those of the other stars, suggesting that Star 1 has weaker atomic absorption lines than the other sources. It should be emphasized that this measurement is not based on any one feature in the spectrum, but the depth of all of the features in the m interval, and hence is best understood as an overall metallity difference, such that the mean metallicity in Star 1 is dex lower than the other stars. This is well within the dispersion that is seen in other spheroidal systems, such as the Galactic Bulge (e.g. Zoccali et al. 2003), and falls within the metallicity dispersion that has been proposed to explain the width of the AGB at larger radii in M32 (Davidge & Jensen 2007).
5 SUMMARY & DISCUSSION
We have discussed the use of absorption line widths to identify locations in crowded fields where the light is dominated by a single object. The use of line widths to identify such objects is most effective in kinematically hot environments, where the line width contrast between obvious blends and locations where the light is dominated by a single star is greatest. We have examined m spectra with an angular resolution of arcsec in the central few arcsec of the cE galaxy M32. An initial list of potential individual stars was defined by identifying photometrically distinct sources. The majority of these are found to have line widths that are consistent with the light originating from a mix of stars with a velocity dispersion that is comparable to that of the main body of the galaxy; the extracted spectra are thus of composite systems made up of physically unrelated stars that, due to stochastic effects, appear as compact sources at this angular resolution. As for the four remaining sources, three have line widths indicating that the light is dominated by a single intrinsically luminous source, while the fourth has a double-peaked cross-correlation profile that is indicative of two objects with similar band magnitudes that are isolated in velocity space.
There are hints from other datasets that point sources with light coming largely from one star should be found in these data. Davidge et al. (2000) used images with an angular resolution of 0.12 arcsec to investigate the brightest stars near the center of M32. While their CMD of the 0 – 3 arcsec interval has a conspicuous spray of bright sources that are obvious blends, a weak concentration of AGB-tip stars can be seen at , which is the AGB-tip magnitude seen at larger radii. These are point sources close to the center of M32 where the light is probably dominated by a single bright AGB-tip star.
It can be anticipated that, when compared with blends, unblended sources (1) will be fainter, and (2) will be in areas of lower projected stellar density. The brightnesses and local background levels of all fourteen locations were measured from the images discussed by Davidge et al. (2000). The locations with broad lines tend to be almost brighter in than those with narrow lines, and are in regions where the background within 0.2 arcsec of the source is higher. With the caveat that a large fraction of the brightest stars are LPVs (Davidge & Rigaut 2004), the sources with low velocity dispersions thus tend to be fainter than the high velocity-dispersion sources and are located in areas with lower background levels, as expected if they are not blends of many objects with comparable brightness.
While the sample of single stars detected here is small, modest insights can be gained into the bright stellar content near the center of M32. The objects that are dominated by one or two bright stars are almost certainly evolving near the AGB-tip, and these all have an M5III spectral type. These spectral type measurements are not biased by a single strong feature, such as the (2,0) 12CO band head. The uniformity in spectral type is consistent with the distinct red cut-off in the CMD of the central regions of M32 found by Davidge et al. (2000). It also suggests that the color of the AGB-tip near the center of M32 is consistent with that at large radii, indicating that the homogeneous nature of the AGB sequence in M32 measured by Davidge & Jensen (2007) extends into the central arcsec of the galaxy.
The spectra also suggest that there are modest star-to-star metallicity differences among the brightest stars in M32. When the narrow-line spectra are cross-correlated with a reference spectrum in the m interval, one source – # 1 – has a significantly lower peak in the correlation function, by an amount that suggests it has a metallicity that is dex lower than the other stars. Metallicity differences of this size fall well within the spread seen in other spheroidal systems, and are consistent with the spread in color seen amongst AGB stars in the outer region of M32 (Davidge & Jensen 2007).
Many of the bright AGB stars in M32 are LPVs (Davidge & Rigaut 2004), and there is an obvious bias to detect these objects when they are brightest. Observations at future epochs may find new locations near the center of M32 that are dominated by single LPVs that are near the peak of their light variation, but were in a part of their light curve that rendered them too faint to be resolved in the present data. By the same token, the sources found here may not be detected if they are variable and in a faint phase of their light cycle at the time of future observation. This raises the possibility that the sample of spectroscopically-identified stars near the center of M32 can be increased by observing at different epochs. This will provide a larger sample of objects from which to measure, for example, a more robust metallicity dispersion.
| # | RNuc | |
| (arcsec) | (km sec-1) | |
| 1 | 1.34 | 0 |
| 2 | 1.46 | 96 |
| 3 | 1.58 | 35 |
| 4 | 1.45 | 65 |
| 5 | 1.10 | 120 |
| 6 | 0.96 | 161 |
| 7 | 0.87 | 62 |
| 8 | 1.33 | 31 |
| 9 | 1.14 | 106 |
| 10 | 0.95 | – |
| 11 | 1.15 | 114 |
| 12 | 1.27 | 80 |
| 13 | 1.52 | 96 (Bimodal) |
| 14 | 1.53 | – |
References
- (1)
- (2) Bessell, M. S., & Brett, J. M. 1988, PASP, 100, 1134
- (3)
- (4) Bica, E., Alloin, D., & Schmidt, A. A. 1990, A&A, 228, 23
- (5)
- (6) Cioni, M.-R.-L., Girardi, L., Marigo, P., & Habing, H. J. 2006, A&A, 456, 967
- (7)
- (8) Davidge, T. J. 1990, AJ, 99, 561
- (9)
- (10) Davidge, T. J. 1997, AJ, 113, 985
- (11)
- (12) Davidge, T. J. 2000, PASP, 112, 1177
- (13)
- (14) Davidge, T. J., & Jensen, J. B. 2007, AJ, 133, 576
- (15)
- (16) Davidge, T. J., & Rigaut, F. 2004, ApJ, 607, L25
- (17)
- (18) Davidge, T. J., Rigaut, F., Chun, M., Brandner, W., Potter, D., Northcott, M., & Graves, J. E. 2000, ApJ, 545, L89
- (19)
- (20) del Burgo, C., Peletier, R. F., Vazdekis, A., Arribas, S., & Mediavilla, E. 2001, MNRAS, 321, 227
- (21)
- (22) Fraser, O. J., Hawley, S. L., Cook, K. H., & Keller, S. C. 2005, AJ, 129, 768
- (23)
- (24) Frogel, J. A., & Whitford, A. E. 1987, ApJ, 320, 199
- (25)
- (26) Girardi, L., et al. 2002, A&A, 391, 195
- (27)
- (28) Herriot, G., et al. 2000, Proc. SPIE, 4007, 115
- (29)
- (30) Jarrett, T. H., Chester, T., Cutri, R., Schneider, S. E., & Huchra, J. P. 2003, AJ, 125, 525
- (31)
- (32) McGregor, P. J., et al. 2003, Proc. SPIE, 4841, 1581
- (33)
- (34) Nikolaev, S., & Weinberg, M. D. 2000, ApJ, 542, 804
- (35)
- (36) O’Connell, R. W. 1980, ApJ, 236, 430
- (37)
- (38) Rayner, J. T., Cushing, M. C., & Vacca, W. D. 2009, ApJS, accepted (astroph 0909.0818)
- (39)
- (40) Renzini, A. 1998, AJ, 115, 2459
- (41)
- (42) Rose, J. A., Arimoto, N., Caldwell, N., Schiavon, R. P., Vazdekis, A., & Yamada, Y. 2005, AJ, 129, 712
- (43)
- (44) Sil’Chenko, O. K., Burenkov, A. N., & Vlasyuk, V. V. 1998, A&A, 337, 349
- (45)
- (46) Tonry, J., & Davis, M. 1979, AJ, 84, 1511
- (47)
- (48) Welch, G. A., & Sage, L. J. 2001, ApJ, 557, 671
- (49)
- (50) Worthey, G. 2004, AJ, 128, 2826
- (51)
- (52) Zoccali, M., et al. 2003, A&A, 399, 931
- (53)