2 Faculty of Mathematics and Physics, Charles University, Ke Karlovu 3, CZ-12161 Prague, Czech Republic
3 European Space Astronomy Centre of ESA, PO Box 78, Villanueva de la Cañada, 28691 Madrid, Spain
Warm absorber and truncated accretion disc in IRAS 05078+1626
Abstract
Context. X-ray observations of unabsorbed active galactic nuclei provide an opportunity to explore the innermost regions of supermassive black hole accretion discs.
Aims. Our goal in this paper is to investigate the central environment of a Seyfert 1.5 galaxy IRAS 05078+1626.
Methods. We studied the time-averaged spectrum obtained with the EPIC and RGS instruments onboard XMM-Newton.
Results. A power law continuum (photon index ) dominates the 2–10 keV energy range. A narrow iron K spectral line is clearly seen, presumably originating in a distant torus, but no broad relativistic component was detected. However, the power law and the iron K line alone do not provide a satisfactory fit in the soft X-ray band whose spectrum can be explained by the combination of three components: a) a cold photoelectric absorber with column density cm-2. This gas could be located either in outer parts of the accretion disc, at the rim of the torus or farther out in the host galaxy; b) a warm absorber with high ionization parameter () and column density (cm-2); c) an ionised reflection where the reflecting gas could be either in the inner wall of a warm absorber cone or in an ionised accretion disc.
Conclusions. The first X-ray spectroscopic measurement of IRAS05078+1626 unveils some of the standard ingredients in Seyfert galaxies, such as a power law primary continuum, modified by reflection from the accretion disc and by the effect of complex, multi-phase obscuration. However, data constrains the accretion disc, if present, not to extend closer than to 60 gravitational radii from the black hole.
Key Words.:
Galaxies: active – Galaxies: Seyfert – Galaxies: IRAS 05078+16261 Introduction
IRAS 05078+1626 is a nearby Seyfert 1.5 galaxy. Before its identification as an infrared source it was also known as CSV 6150 (Catalogue of Suspected Variables). Its position on the sky is and in the Galactic coordinates. The cosmological redshift of this galaxy is (Takata et al. 1994). It had never been spectroscopically examined in X-ray prior to the observation discussed in this paper. However, it was detected in a number of X-ray surveys, such as the all-sky monitoring of the INTEGRAL IBIS/ISGRI instrument (Sazonov et al. 2007), the SWIFT BAT instrument (Ajello et al. 2008; Tueller et al. 2008), and the RXTE Slew Survey (XSS) (Revnivtsev et al. 2004).
The X-ray spectroscopic properties of intermediate Seyferts are rather elusive: both obscured Type 1 and unobscured Type 2 active galactic nuclei (AGN) have been reported (e.g., Cappi et al. 2006; Brightman & Nandra 2008; Bianchi et al. 2009b). It has been suggested that intermediate Seyfert galaxies are seen at intermediate inclination angles between pure “face-on” Seyfert 1s and pure “edge-on” Seyfert 2s, which follows directly from the orientation-based AGN unification scenarios (Antonucci & Miller 1985; Antonucci 1993; Urry & Padovani 1995). For this reason, X-ray spectroscopy of type 1.5 Seyferts may provide clues to the nature and geometrical distributions of optically thick gas surrounding the active nucleus, the latter being the fundamental ingredient behind the unification scenarios.
IRAS 05078+1626 is included in the FERO project (“Finding Extreme Relativistic Objects”; Longinotti et al. 2008) with the aim of establishing the fraction of a relativistically broadened K iron lines in the spectrum of a complete flux-limited sample (2–10 keV flux 1 mCrab).
This paper is organised as follows. In section 2.1 we describe new observation by XMM-Newton and the corresponding data reduction. In sections 2.2 - 2.5, we present the results derived from the X-ray spectra in – keV energy range. The results are discussed in section 3 and the conclusions are summarised in section 4.
2 Results from XMM-Newton observation in 2007
2.1 Observations and data reduction
The XMM-Newton observation of IRAS 05078+1626 was performed between 2007 August 21 UT 22:24:49 and 22 UT 15:35:43 (Obs. #0502090501). The EPN and both MOS cameras (Strüder et al. (2001) for PN; Turner et al. (2001) for MOS) were operating in the small window mode. The RGS cameras (den Herder et al. 2001) were operating in spectroscopic mode. The spectra were reduced with the SAS software version 9.0.0 (Gabriel et al. 2004). Intervals of high particle background were removed by applying count rate thresholds on the field-of-view (EPIC, single events) and CCD #9 (RGS) light curves of 0.35 cts/s for the PN, 0.5 cts/s for the MOS and 0.15 cts/s for the RGS. The exposure time after data screening is ks for MOS, ks for PN and ks for RGS, respectively. The patterns 0–12 were used for both MOS cameras, and patterns 0–4 (i.e. single and double events) for the PN camera. The source spectra were extracted from a circle of 40 arcsec in radius defined around the centroid position with the background taken from an offset position close to the source. The two MOS spectra and the related response files were joined into a single spectrum and response matrix. Finally, the PN and MOS spectra were rebinned in order to have at least 25 counts per bin and to oversample the energy resolution of the instrument maximally by a factor of three, while the RGS spectra were left unbinned. Consequently, different statistics were used in fitting the spectra – the traditional statistics to fit the PN and MOS spectra and the C-statistics (Cash 1976) for all fits including RGS data. For the spectral analysis, we used XSPEC (Arnaud 1996) version 12.5, which is part of the HEASOFT software package version 6.6.111http://heasarc.gsfc.nasa.gov
2.2 Timing properties
The PN light curve of the source is shown in Fig. 1. We have divided the energy range into two bands and checked the light curve behaviour in each of them, as well as a hardness ratio, which we defined as the ratio of the counts at 2–10 keV to the counts at 0.2–2 keV. The energy ranges were chosen for sampling different spectral components, as indicated by the energy where the continuum starts deviating from a power law model that describes the hard X-ray spectrum (see Sect. 2.3). The hardness ratio stays almost constant during the observation, suggesting that no significant spectral variations occur, although the source flux increased by around 20%.
 |

To confirm this conclusion also for narrow spectral features, such as the iron emission line, we compared the PN spectra extracted during the first and the second halves of the observation (see Fig. 2). The spectra correspond to the lower/higher source flux because the flux is increasing nearly monotonically during the observation. We calculated the ratio values of the two data sets and fit them with a simple function using the least square method. The fitting results are and with the sum of the residuals for 190 degrees of freedom. When we set , the fitting results are comparably good with and . The ratio of the spectra is plotted in the lower panel of Fig. 2. Because no significant spectral differences are evident, we analyse the time-averaged spectra hereafter.
 |
2.3 Mean spectral properties
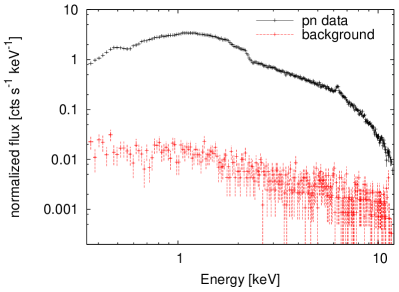
The signal-to-noise ratio is very good up to high energies (Fig. 3), so we fit the EPIC spectra spectra in the full energy range where they are well calibrated (0.35–12 keV). The X-ray continuum is described by a power law model at energies above 2 keV, although the iron line at keV is present (Fig. 4). The photon index of the power law is .222All presented errors represent 90 confidence level for a single interesting parameter, and the errors quoted in brackets are related to the last digit in the number. In this and all subsequent models we included absorption by Galactic gas matter along the line of sight with column density cm-2. This value is from the Leiden/Argentine/Bonn H I measurements (Kalberla et al. 2005). We used the tbabs model (Wilms et al. 2000) to fit the absorption produced by the Galactic interstellar matter.
We applied the simple tbabs*powerlaw model to both PN and MOS spectra. The value is 3557 with 528 degrees of freedom () in the keV energy range. The spectra differ from the power law model not only around keV but also at lower energy band keV (adding a Gaussian line model to fit the iron line improves the fit only to ). Residuals against this model are shown in Fig. 5.
The residuals at lower energies are usually attributed to a warm absorber, i.e. absorption by totally or partially ionised matter; see, e.g., Netzer et al. (2003); Blustin et al. (2005); Krongold et al. (2007) for more information about warm absorbers in Seyfert galaxies. The spectrum can be also affected by the so-called soft excess, which can be either caused by reflection by the ionised surface of the accretion disc (Crummy et al. 2006) or by partially ionised and Doppler smeared absorption (Gierliński & Done 2006).
The spectral residuals reveal certain discrepancies between the PN and MOS spectra (see Fig. 5 with the data/model ratios of both spectra, PN and MOS, with the identical model parameters of the spectra). The level of discrepancy is, however, comparable to the level of systematic uncertainties in the cross-calibration between the EPIC cameras (Stuhlinger et al. 2006). Nonetheless, we conservatively analyse the EPIC spectra separately. We use the same models for both spectra but allow the values of the model parameters to be different. The values of the photon index using the simple power law model differ from each other when fitting the spectra independently, resulting in a harder PN spectrum with compared to the MOS spectrum with , ignoring the energies below 2 keV and also between 5.5-7.5 keV. Although the absolute value of these spectral index measurements does not have a direct physical meaning, given the simplicity of the model applied on a small energy band, the comparison between them is illustrative of the quality of the cross-calibration between the EPIC cameras. Differences of the order of 0.06 in the hard X-ray band are consistent with current systematic uncertainties (Stuhlinger et al. 2006).
2.4 RGS spectrum
We jointly fit the unbinned first-order spectra of the two RGS cameras with the same model’s parameter values except the overall normalisations. The continuum is well-fitted by the simple power law model with the photon index . We searched further for narrow emission and absorption lines in the spectrum using several zgauss models with the intrinsic width set to zero. We calculated the 90 % confidence interval for a blind search, as , where and . For the RGS data , to which corresponds assuming the Student probability distribution. The only line fulfilling this criterion by improving the fit about is an emission line at the energy keV ( Å) and the equivalent width eV. We identify it with the forbidden line of the O VII triplet ( keV).
2.5 EPIC spectrum
The forbidden line of the OVII triplet is clear signature of a photoionised plasma. No significant features were detected that may be expected alongside the O VII (f) line, if it were produced in a collisionally ionised plasma, such as the resonance line in the OVII triplet or the OVIII Ly. This led us to try and explain the residuals against a power law model in the soft X-rays as effect of intervening ionised absorption gas. We used the xstar model version 2.1ln7c (Kallman & Bautista 2001)333http://heasarc.gsfc.nasa.gov/docs/software/xstar/xstar.html to calculate a grid of tabular models with the input parameters constrained from the preliminary data analysis with simple models whenever possible (photon index , density cm-3, luminosity erg s-1, column density cm cm-2, and ionization parameter ).
| Model | Model | ‘baseline’ model | ‘final’ (‘double reflection’) model | |||
| component | parameter | PN | MOS | PN | MOS | PN+MOS+RGS |
| zphabs | cm | |||||
| xstar | cm | |||||
| He/HeSolar - Ca/CaSolar | (f) | (f) | (f) | (f) | (f) | |
| FeFeSolar - NiNiSolar | ||||||
| powerlaw | ||||||
| normalisation | ….. | |||||
| reflion | (b) | (b) | (b) | (b) | (b) | |
| FeFeSolar - NiNiSolar | (b) | (b) | (b) | (b) | (b) | |
| normalisation | ….. | |||||
| reflion 2 | normalisation | - | - | ….. | ||
| zgauss | E [keV] | - | - | - | ||
| [keV] | - | - | - | |||
| z | (f) | (f) | - | - | - | |
| normalisation | - | - | - | |||
| 246/264 | 405/243 | 256/266 | 404/244 | = 1551/1347 | ||
Note: The sign (f) after a value means that the value was fixed during the fitting procedure. The sign (b) means that the parameter value was bound to the value of the corresponding parameter of the previous model component. The sign “-” means that the model component is not included in the total model, while dots in the right column only mean that there are more values related to the individual spectra which are not necessary to be all shown in the table.
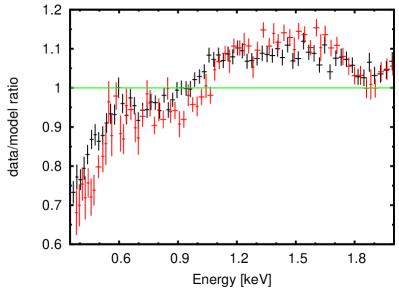
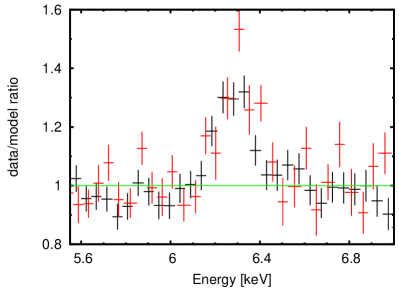
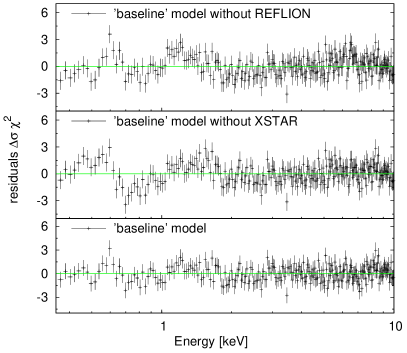
A single-zone warm absorber component modifying the power law continuum dramatically improved the fit from to for the PN spectrum. The ionization parameter converged to a very low value, and we found that this almost neutral absorption can be successfully reproduced with zphabs, which is a simpler model than xstar, so we preferred this possibility. The addition of another warm absorber zone improves the fit to for the PN spectrum, and it requires the ionization parameter . We checked that adding another warm absorber zones does not improve the fit significantly. The residuals from the model (see Fig. 6, upper panel) reveal an extra emission that remains at low energies, as well as around the iron K line band.
These features can come from reflection of the primary radiation on the surface of the accretion disc, so we added the reflion model (Ross & Fabian 2005), which calculates the ionised reflection for an optically thick atmosphere with constant density. We examined the significance of the addition of the reflection component into the complex model of the PN spectrum by the statistical F-test. The low value of the F-test probability () strongly favours this additional model component. The best fit was now for the PN spectrum. We hereafter call this model the ‘baseline’ model; in the XSPEC notation: tbabs zphabs xstar (powerlaw + reflion + zgauss).
The parameter values of the ‘baseline’ model are presented in the Table 1. The quoted errors of the parameters represent a 90 confidence level for a single interesting parameter. The measurement is obviously affected by a much larger systematic error, which, however, could be properly quantified only if we knew the “right” model. The value of the power law photon index increased to compared to the simple model applied to the data in Sect. 2.3, because we included of the additional local absorption in the model. The data residuals from the model are shown in the lower panel of Fig. 6. In the same figure, we also show residuals from best fit performed with the ‘baseline’ model, excluding the ionised absorption (middle panel) and the ionised reflection component (upper panel).
The narrow iron K line with the rest energy keV, the width keV, and the equivalent width eV evidently represents cold reflection. This suggests an origin of this spectral component in the outer part of the disc, or from the torus. The cold reflection is also supposed to contribute to the soft part of the spectrum with the individual emission lines. For this reason, we replaced the Gaussian profile in the ‘baseline’ model with another reflion component (called as reflion 2 in the Table 1) with the same values for the photon index and abundances as the reflion 1 model component. The ionization parameter was kept free during the fitting procedure, but it very quickly converged to its lowest value (). The advantage of the reflion model compared to the other available reflection models is that it also includes the soft X-ray lines, with the disadvantage in this case that the ionization parameter cannot be set to zero.
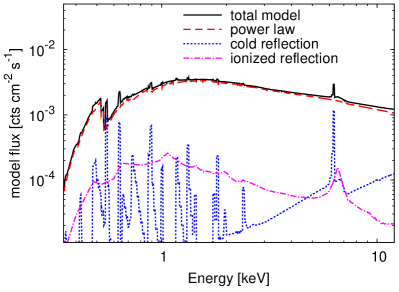
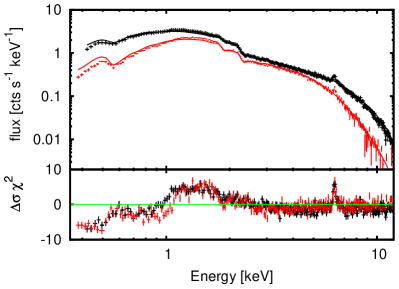
This ‘double reflection’ model, in the XSPEC notation tbabs zphabs xstar (powerlaw + reflion + reflion), does not significantly improve the fit goodness over the ‘baseline’ model (with for the PN spectrum), but it represents a more self-consistent astrophysical picture. Therefore, we call the ‘double reflection’ model as ‘final’ model. In contrast to the ‘baseline’ model, it does not require subsolar iron abundances, see the Table 1, where the parameter values for this model are presented. The ‘final’ model with each component separately drawn is shown in Fig. 7. All the plotted components are absorbed by a warm absorber surrounding the central accretion disc and two kinds of cold absorber – one from Galactic interstellar matter and one from local absorber in the host galaxy.

| Model | Flux at keV | Flux at keV | ||
|---|---|---|---|---|
| component | erg cm-2 s-1] | erg cm-2 s-1] | ||
| PN | MOS | PN | MOS | |
| total model | ||||
| unabsorbed model | ||||
| powerlaw | ||||
| reflionion | ||||
| reflioncold | ||||
| ∗ | ||||
| ∗ | ||||
∗ the ratios of the reflection component flux values to the flux value of the total unabsorbed model (sum of the primary and reflected radiation).
Some model parameters were not allowed to vary during the fitting procedure. The redshift of the ionised absorber was fixed to the source cosmological value, because leaving it free yields a negligible improvement in the quality of the fit. Second, we used the same iron abundances across all the components in the model.
In the ‘final’ model, the warm absorber ionization parameter is consistent with the ionised reflection component. This result is also presented in Fig. 8, where the contour lines related to the , , and levels of between the ionization parameters of the two model components are present.
Table 2 summarises flux values of the individual components of the ‘final’ model for both PN and MOS spectra for two energy bands, keV and keV, and also shows fractions of the reflection radiation to the total emission (sum of the primary and reprocessed radiation). The flux ratio is almost equally shared between the cold and ionised reflection components, and its value is in total . The absorption–corrected luminosity values of the source in the same energy bands are erg s-1 and erg s-1, respectively.
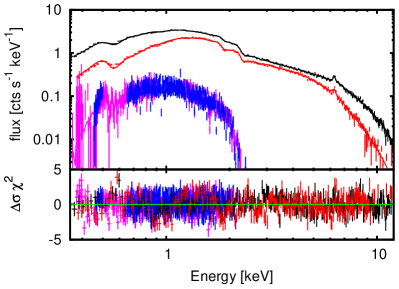
We also used the ‘final’ model for a joint fitting of all the XMM-Newton instruments (PN, MOS and both RGS spectra) together. The parameter values were bound among all the spectra, only normalisation factors were allowed to vary. The goodness of the joint fit is given in C-statistics because the RGS data are unbinned (and each individual bin contains only a few counts). The result is for a number of degrees of freedom . All the spectra, together with the residuals, are shown in Fig. 9, and the corresponding parameters in the last column of Table 1.
3 Discussion
3.1 Constraints on the location of the absorbers
In this section we discuss a possible location of the absorber’s system in the ‘final’ model. Photoelectric absorption is almost invariably observed in Type 2 Seyferts (Awaki et al. 1991; Turner et al. 1997; Risaliti et al. 2002) and generally attributed to an optically thick matter responsible for orientation-dependent classification in AGN unification scenarios (Antonucci & Miller 1985; Antonucci 1993).
Because the IRAS 05078+1626 galaxy is probably viewed under an intermediate inclination between unobscured Seyfert 1s and obscured Seyfert 2s, the torus rim may also intercept the line of sight to the AGN and absorb the radiation coming from the centre. The cold absorption can, however, also be associated with the interstellar matter of the galaxy (Lamastra et al. 2006).
Both reflection components are inside the ionised absorber in the ‘final’ model. The geometrical interpretation is that the cold reflection occurs on the outer parts of the disc or the inner wall of the torus. Reflection on the nearer part of the torus is heavily absorbed by the torus itself, so only radiation reflected on the farther peripheral part of the torus can reach the observer after passing through the warm absorber. However, an alternative scenario, in which the cold reflection is unaffected by the warm absorber, i.e., tbabs zphabs [reflioncold + xstar (powerlaw + reflion )], is also acceptable with .
The lack of constraints on the variability in the warm absorbed features (Krongold et al. 2007), caused by the moderate dynamical range of the primary continuum, as well as statistical limitations in our spectra, prevents us from precisely constraining the location of the warm absorber.

3.2 Constraints on the location of the ionised reflector
The ionised reflection might occur either at the inner wall of a warm absorber cone or on the accretion disc. Even in the latter case, the reflection cannot occur arbitrarily close to the black hole. In this section we investigate the constraints of the accretion disc location and structure, which can be drawn from the lack of the significant relativistic blurring of the disc reflection component.
We convolved the ionised reflection component with the fully relativistic kyconv model (Dovčiak et al. 2004). Two assumptions about the disc emissivity were considered. First, the radial part of the intensity decreases with the power of the disc radius (), where the value of was allowed to vary between and . Second, the angular dependence was assumed to be isotropic which seems to be appropriate approximation for our situation of an X-ray irradiated accretion disc (Svoboda et al. 2009).
We examined the expected confidence levels of the best-fit values of the disc’s inner radius by stepping this parameter in the whole range of its possible values – from the horizon to the outer disc radius, which we set to 400 gravitational radii (). The results are shown in Fig. 10. At the 90 % confidence level, the accretion disc is not allowed to extend closer to the black hole than .
The “relativistic blurring method” would be less appropriate in looking for the imprints of the innermost parts of the accretion disc if the disc were too highly ionised (log) and the narrow reflection features were not present (Ross & Fabian 2005). However, the ionization parameter value of the reflection component is not so high in the ‘final’ model and the dominant feature is the intermediately ionised iron line ( keV). If we assumed a stratified disc with the ionization state decreasing with the radius from the centre, the hydrogen-like iron line would be also expected to appear in the spectrum (as an intermediate stage between the over-ionised and mildly ionised contribution). Because it is not detected in the data, the accretion disc truncation provides a more reasonable explanation of missing signatures of the relativistic blurring.
3.3 Mass accretion rate
Disc truncation is expected in low–luminosity AGN where the inner accretion flow is advection-dominated (Narayan & Yi 1994; Esin et al. 1997; Narayan & McClintock 2008, and references therein). The transition from the outer standard accretion disc may occur, e.g., via the disc evaporation mechanism (Meyer et al. 2000; Liu & Taam 2009). The observational evidence of a truncated accretion disc in low–luminosity AGN was reported e.g. by Lasota et al. (1996); Quataert et al. (1999). However, its presence is also suggested in some observations of Seyfert galaxies (Lu & Wang 2000; Done et al. 2000; Chiang & Blaes 2003; Markowitz & Reeves 2009) and even a quasar (Matt et al. 2005) where the luminosity value is estimated as a half of the Eddington value. Generally, it is expected that the lower the luminosity, , the larger transition radius (see Yuan & Narayan 2004, and references therein). Furthermore, we investigate whether the disc truncation hypothesis is consistent with the IRAS 05078+1626 luminosity. To have these quantities in Eddington units, we first estimated the mass of the black hole.
IRAS 05078+1626 belongs to the sample of the infrared-selected Seyfert 1.5 galaxies observed by a 2.16 m optical telescope (Wang et al. 2006) where, among others, the velocity dispersion in the O III emission line was measured. The correlation between the O III line width and the mass of active galactic nucleus was discussed in Nelson (2000) and Boroson (2003). The value from the optical measurements, km s-1, corresponds to the mass using a correlation plot in Boroson (2003). The scatter of the correlation is somewhat large with the reported limit of a factor of 5 for an uncertainty in the black hole mass determination, so the value only provides an order of magnitude estimation.
The value of the Eddington luminosity is erg s erg s-1 for the given value of the mass. We used luminosity-dependent corrections by Marconi et al. (2004) to estimate the bolometric luminosity of IRAS 05078+1626 from the X-ray luminosity. Its value is erg s. Correspondingly, the mass accretion rate, , is sub-Eddington with . This value is typical of less luminous Seyfert galaxies (see for example Bianchi et al. 2009a), and is consistent with the disc truncation hypothesis.
4 Conclusions
The X-ray continuum spectrum of the Seyfert galaxy IRAS 05078+1626 is dominated by a power law with a standard value of the photon index ( in the ‘final model’). The residuals from the power law continuum can be interpreted in terms of the warm absorber surrounding the accretion disc, and the reflection of the primary radiation from the ionised matter and on the cold torus. The outgoing radiation is absorbed by cold matter ( cm-2), which can be either located in the inner side of the torus or caused by gas in the host galaxy. The type of the galaxy determined from the previous infrared and optical research is Seyfert 1.5, suggesting that the active nucleus could be seen at large inclination, consistent with either interpretation or even allowing a combination of both.
The ionised warm absorber occurs in the central part of the AGN. Its column density was found to be cm-2, which is a rather high value compared to the warm absorbers detected in the other Seyfert galaxies (Blustin et al. 2005). This may be because we are looking through a longer optical path of a conical non-relativistic outflow due to the high inclination of the system. The ionization parameter of the warm absorber is , which is comparable to the value related to the ionised reflection , suggesting a link between them.
If the ionised reflection is associated to the warm absorber (e.g. the inner walls of a conical outflow), the lack of spectral features associated with the accretion disc is a natural consequence thereof. If, instead, the ionised reflection occurs at the accretion disc, it cannot extend up to the marginally stable orbit. The lack of the significant relativistic blurring of this model component requires the disc to be truncated (inner disc radius ). This idea is also supported by the low ratio of the reflection radiation to the primary one, , and also by the relatively low mass-accretion rate determined from the source luminosity.
Acknowledgements.
The authors are grateful for useful comments and suggestions by Michal Dovčiak, René W. Goosmann, and the participants of the 3rd ‘FERO’ (Finding Extreme Relativistic Objects) workshop, held in September 2009 in Rome. JS acknowledges the support from the doctoral student programme of the Czech Science Foundation, ref. 205/09/H033, and the research grant of the Charles University in Prague, ref. 33308. VK appreciates the continued support from research grants of the Czech Science Foundation, ref. 205/07/0052, and ESA Plan for European Cooperating States, project No. 98040.References
- Ajello et al. (2008) Ajello, M., Rau, A., Greiner, J., et al. 2008, ApJ, 673, 96
- Antonucci (1993) Antonucci, R. 1993, ARA&A, 31, 473
- Antonucci & Miller (1985) Antonucci, R. R. J. & Miller, J. S. 1985, ApJ, 297, 621
- Arnaud (1996) Arnaud, K. A. 1996, in Astronomical Society of the Pacific Conference Series, Vol. 101, Astronomical Data Analysis Software and Systems V, ed. G. H. Jacoby & J. Barnes, 17
- Awaki et al. (1991) Awaki, H., Koyama, K., Kunieda, H., et al. 1991, ApJ, 366, 88
- Bianchi et al. (2009a) Bianchi, S., Guainazzi, M., Matt, G., Fonseca Bonilla, N., & Ponti, G. 2009a, A&A, 495, 421
- Bianchi et al. (2009b) Bianchi, S., Piconcelli, E., Chiaberge, M., et al. 2009b, ApJ, 695, 781
- Blustin et al. (2005) Blustin, A. J., Page, M. J., Fuerst, S. V., Branduardi-Raymont, G., & Ashton, C. E. 2005, A&A, 431, 111
- Boroson (2003) Boroson, T. A. 2003, ApJ, 585, 647
- Brightman & Nandra (2008) Brightman, M. & Nandra, K. 2008, MNRAS, 390, 1241
- Cappi et al. (2006) Cappi, M., Panessa, F., Bassani, L., et al. 2006, A&A, 446, 459
- Cash (1976) Cash, W. 1976, A&A, 52, 307
- Chiang & Blaes (2003) Chiang, J. & Blaes, O. 2003, ApJ, 586, 97
- Crummy et al. (2006) Crummy, J., Fabian, A. C., Gallo, L., & Ross, R. R. 2006, MNRAS, 365, 1067
- den Herder et al. (2001) den Herder, J. W., Brinkman, A. C., Kahn, S. M., et al. 2001, A&A, 365, L7
- Done et al. (2000) Done, C., Madejski, G. M., & Życki, P. T. 2000, ApJ, 536, 213
- Dovčiak et al. (2004) Dovčiak, M., Karas, V., & Yaqoob, T. 2004, ApJS, 153, 205
- Esin et al. (1997) Esin, A. A., McClintock, J. E., & Narayan, R. 1997, ApJ, 489, 865
- Gabriel et al. (2004) Gabriel, C., Denby, M., Fyfe, D. J., et al. 2004, in Astronomical Society of the Pacific Conference Series, Vol. 314, Astronomical Data Analysis Software and Systems (ADASS) XIII, ed. F. Ochsenbein, M. G. Allen, & D. Egret, 759
- Gierliński & Done (2006) Gierliński, M. & Done, C. 2006, MNRAS, 371, L16
- Kalberla et al. (2005) Kalberla, P. M. W., Burton, W. B., Hartmann, D., et al. 2005, A&A, 440, 775
- Kallman & Bautista (2001) Kallman, T. & Bautista, M. 2001, ApJS, 133, 221
- Krongold et al. (2007) Krongold, Y., Nicastro, F., Elvis, M., et al. 2007, ApJ, 659, 1022
- Lamastra et al. (2006) Lamastra, A., Perola, G. C., & Matt, G. 2006, A&A, 449, 551
- Lasota et al. (1996) Lasota, J., Abramowicz, M. A., Chen, X., et al. 1996, ApJ, 462, 142
- Liu & Taam (2009) Liu, B. F. & Taam, R. E. 2009, ApJ, 707, 233
- Longinotti et al. (2008) Longinotti, A. L., de La Calle, I., Bianchi, S., Guainazzi, M., & Dovčiak, M. 2008, Memorie della Societa Astronomica Italiana, 79, 259
- Lu & Wang (2000) Lu, Y. & Wang, T. 2000, ApJ, 537, L103
- Marconi et al. (2004) Marconi, A., Risaliti, G., Gilli, R., et al. 2004, MNRAS, 351, 169
- Markowitz & Reeves (2009) Markowitz, A. G. & Reeves, J. N. 2009, ApJ, 705, 496
- Matt et al. (2005) Matt, G., Porquet, D., Bianchi, S., et al. 2005, A&A, 435, 857
- Meyer et al. (2000) Meyer, F., Liu, B. F., & Meyer-Hofmeister, E. 2000, A&A, 361, 175
- Narayan & McClintock (2008) Narayan, R. & McClintock, J. E. 2008, New Astronomy Review, 51, 733
- Narayan & Yi (1994) Narayan, R. & Yi, I. 1994, ApJ, 428, L13
- Nelson (2000) Nelson, C. H. 2000, ApJ, 544, L91
- Netzer et al. (2003) Netzer, H., Kaspi, S., Behar, E., et al. 2003, ApJ, 599, 933
- Quataert et al. (1999) Quataert, E., Di Matteo, T., Narayan, R., & Ho, L. C. 1999, ApJ, 525, L89
- Revnivtsev et al. (2004) Revnivtsev, M., Sazonov, S., Jahoda, K., & Gilfanov, M. 2004, A&A, 418, 927
- Risaliti et al. (2002) Risaliti, G., Elvis, M., & Nicastro, F. 2002, ApJ, 571, 234
- Ross & Fabian (2005) Ross, R. R. & Fabian, A. C. 2005, MNRAS, 358, 211
- Sazonov et al. (2007) Sazonov, S., Revnivtsev, M., Krivonos, R., Churazov, E., & Sunyaev, R. 2007, A&A, 462, 57
- Strüder et al. (2001) Strüder, L., Briel, U., Dennerl, K., et al. 2001, A&A, 365, L18
- Stuhlinger et al. (2006) Stuhlinger, M., Altieri, B., Esquej, M. P., et al. 2006, in ESA Special Publication, Vol. 604, The X-ray Universe 2005, ed. A. Wilson, 937–+
- Svoboda et al. (2009) Svoboda, J., Dovčiak, M., Goosmann, R., & Karas, V. 2009, A&A, 507, 1
- Takata et al. (1994) Takata, T., Yamada, T., Saito, M., Chamaraux, P., & Kazes, I. 1994, A&AS, 104, 529
- Tueller et al. (2008) Tueller, J., Mushotzky, R. F., Barthelmy, S., et al. 2008, ApJ, 681, 113
- Turner et al. (2001) Turner, M. J. L., Abbey, A., Arnaud, M., et al. 2001, A&A, 365, L27
- Turner et al. (1997) Turner, T. J., George, I. M., Nandra, K., & Mushotzky, R. F. 1997, ApJS, 113, 23
- Urry & Padovani (1995) Urry, C. M. & Padovani, P. 1995, PASP, 107, 803
- Wang et al. (2006) Wang, J., Wei, J. Y., & He, X. T. 2006, ApJ, 638, 106
- Wilms et al. (2000) Wilms, J., Allen, A., & McCray, R. 2000, ApJ, 542, 914
- Yuan & Narayan (2004) Yuan, F. & Narayan, R. 2004, ApJ, 612, 724