Raman Model Predicting Hardness of Covalent Crystals
Abstract
Based on the fact that both hardness and vibrational Raman spectrum depend on the intrinsic property of chemical bonds, we propose a new theoretical model for predicting hardness of a covalent crystal. The quantitative relationship between hardness and vibrational Raman frequencies deduced from the typical zincblende covalent crystals is validated to be also applicable for the complex multicomponent crystals. This model enables us to nondestructively and indirectly characterize the hardness of novel superhard materials synthesized under ultra-high pressure condition with the in situ Raman spectrum measurement.
pacs:
62.20.Qp; 71.15.Mb; 78.30.-j; 81.05.ZxDesign and synthesis of new superhard materials are of great interest due to their numerous applications. R01 ; R02 ; R03 ; R04 ; R05 Hardness, as an important macroscopic physical property, is understood as the resistance offered by a given material to applied mechanical action. For a crystalline material, hardness is an intrinsic property. Its prediction, from the microscopic electronic structure, is a crucial issue and a powerful challenge in condensed matter physics and materials science. Recently, the microscopic model connecting hardness with the nature of chemical bond has shed light on the quantitative estimations of other macroscopic properties.R06 ; R07 ; R08 To predict hardness using the above models, the exact crystal structure must be known. Experimentally, the ultra-high-pressure technique such as diamond anvil cell (DAC) is extensively used to explore new superhard materials.R09 ; R10 ; R11 ; R12 Due to the limited size of the sample synthesized in DAC, it is often very difficult to either conclusively determine the exact atomic arrangement or the hardness for some newly synthesized samples. These quantitative models are thereby limited on some practical applications. However, the in situ measurements of Raman and infrared equipped on DAC can provide the diagnostic electronic features of the phase.
Raman spectroscopy is commonly used in chemistry, since vibrational information is specific for the chemical bonds in a crystal. It therefore provides a fingerprint for identifying the crystal. The Raman scattering process involves the change in susceptibility while the infrared absorption connects with the change in dipole moment. The Raman modes include vibrational, rotational, and librational modes, while the infrared absorption mode involves translational mode only. Furthermore, the vibrational Raman modes can also be classified into the longitudinally optical (LO) and transversely optical (TO) modes, originating from the tensing/compressing and bending of chemical bonds, respectively.R05 Based on the microscopic understanding, hardness is naturally the resistance of chemical bond per unit area to indenter.R06 In the experimental measurement by using the indenter, the hardness value is determined from the ratio of the load to the indentation area.R05 This resistance is related to the tensing/compressing and bending, but not the rotating, librating or translating of chemical bonds because the bond length will keep the same for the translation and rotation (libration) modes, it wouldn’t embody the effective bond strength if considering simulation of the indentation, the contacted bonds would be deformed or broken.
In the previous works, the resistant force of bond can be characterized by energy gap,R06 reference energy R07 and bond electronegativity.R08 In our understanding, the vibrational Raman frequency/energy can also be used to describe the resistant force, due to the reasons as mentioned above. In this work, we create a quantitative relationship between hardness and vibrational Raman modes in nonresonant first-order Stokes Raman spectrum. Raman spectra find other important application on the prediction of hardness.
Inasmuch as the vibrational Raman frequency of a chemical bond increases as the force constant of a chemical bond increases, the vibrational Raman frequency embodies is in fact the bond strength of a chemical qualitatively. The vibrational Raman frequency can be determined by the first-order response, because it lies on the frequency of the optical phonon at the Brillouin-zone center ( point).R13 ; R14 ; R15 Raman intensity of the Raman mode with the Raman frequency can be calculated under the Placzek approximation.R14 Raman spectra can be calculated by the PWSCF implementation within the density functional perturbation theory (DFPT) formalism.R14
In the previous works, twice of the band gap or band energy,R06 the reference energy,R07 and electron-holding energyR08 were used to define the resistant force of bond. We introduce the Raman frequency of a vibrational Raman active bond, , to embody the resistant force of this bond as
| (1) |
where is a constant. The suffix indicates the ordinal number of the vibrational Raman mode. Inasmuch as hardness of a material is attributed to the collective contribution of all the chemical bonds in any direction, hardness can be described by the compromise resistant force. Due to differences in the resistant force among different types of bonds, the compromise resistant force provided by all the chemical bonds with the vibrational Raman active property should be depicted by a weighted geometric average R06 of all the vibrational Raman frequencies. Thus the contributions of all the chemical bonds can be equivalent to that of a single isotropic chemical bond with an imaginary Raman frequency , here we call the diagnostic Raman frequency, which is expressed as
| (2) |
Here is the relative intensity of the th vibrational Raman mode with the Raman frequency and indicates its contribution fraction or the weighted factor. Therefore, the single equivalent isotropic chemical bond provides the resistant force should be
| (3) |
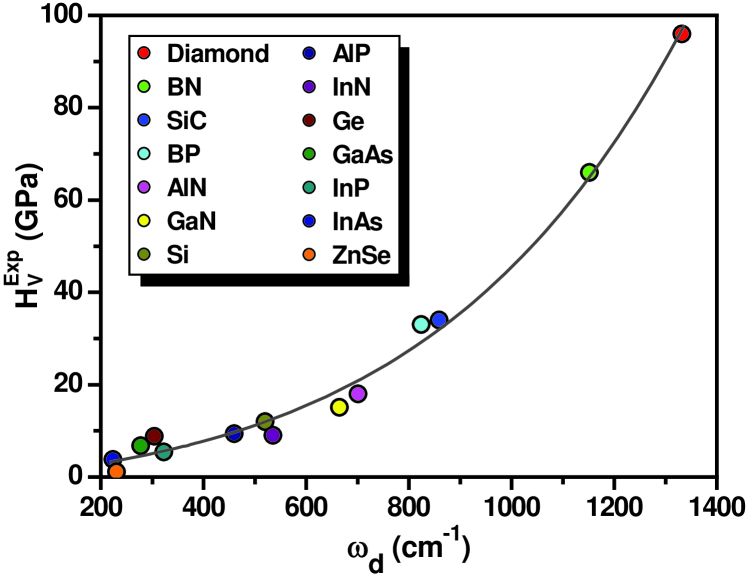
It is clear that when . Because hardness is understood as the resistance offered by a given material to applied mechanical action, the Vickers hardness can be expressed as = , where is a proportional constant. Despite the fact that we cannot give the ab initio deduction for the exact expressions of and from the theory, we can still obtain their values based on the semi-empirical method. It is well known that the zincblende crystals have the simplest Raman spectra with two Raman modes (one LO and one TO) and the zincblende diamond is the hardest material so far. Therefore, we can use the known Raman spectra and hardness for the typical zinc-blende covalent crystals, to determine the constants of and . From against for the first 14 typical zincblende covalent crystals from Table I as shown in Fig. 1, we obtain
| (4) |
where is in the unit of cm-1. For all the 22 crystals listed in Table I, the Vickers hardness values calculated by the above formula are given. Our results are in good agreement with the experimental data and the theoretical values by the other models.
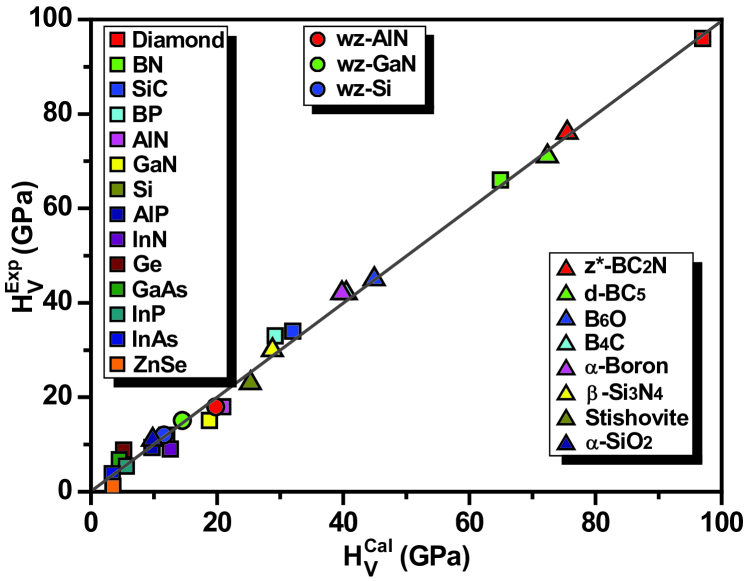
To confirm the universality of Eq. (4), we first apply it to the wurtzite crystals with two types of chemical bonds. The results validate the good agreements between the calculated and experimental values as shown by circles in Fig. 2.
Next we focus on some typical complex crystals as listed in Table II. For -Si3N4 (a fourfold coordinated Si atom is linked by four threefold coordinated N atoms), from the seven vibrational Raman modes measured in experiment,R19 we obtain cm-1 by Eq. (2) and then GPa by Eq. (4). The calculated Vickers hardness is in good agreement with the experimental value of 30 GPa and the theoretical value of 30.3 GPa.R06 For the experimental Raman spectra of -SiO2 in Ref. 14 and Stishovite in Ref. 20, the theoretical analyses reveal that the strong Raman mode at 207 cm-1 for -SiO2 and the two strong Raman modes at 589 and 231 cm-1 for Stishovite should be excluded for evaluating hardness, because they belong to the rotational Raman modes. When other very weak Raman modes are ignored simultaneously, only two relatively strong Raman modes need to be included for calculating hardness: 464 and 450 cm-1 for -SiO2 in Ref. 14 as well as 967 and 753 cm-1 for Stishovite in Ref. 20. The calculated values are 9.8 GPa for -SiO2 and 25.3 GPa for Stishovite, respectively, which are in good agreement with the experimental values of 11 GPa in Ref. 6 for -SiO2 and of 17-23 GPa in Ref. 5 (but lower than 33 GPa in Refs. 5 and 6) for Stishovite. For -SiO2, the Vickers hardness of 30.6 GPa predicted by the microscopic model is remarkably higher than the experimental value of 11 GPa in Ref. 6, whereas our predicated value of 9.8 GPa is very close to the experimental value.
We now turn to explore the boron-rich systems, including -Boron, B4C and B6O. Based on both the theoretical and experimental analyses,R21 ; R22 ; R23 ; R24 ; R25 Vast et al. have pointed out that the Raman modes of -Boron could be classified into three groups: intericosahedral modes at high frequency, intraicosahedral modes at middle frequency, and librational modes at low frequency.R22 This opinion is also feasible to B4C and B6O. Lazzari et al. have validated the two measured low-frequency Raman modes (498 and 534 cm for B4C are the rotational and librational modes, respectively. R24 For -Boron, from the experimental Raman spectrum, R21 we evaluate the Vickers hardness to be 39.8 GPa ( cm-1), which agrees with the experimental value of 42 GPa. R25 By using our present model combined with the measured Raman spectra, R21 ; R23 the calculated hardness are 40.2 GPa ( cm-1) for B4C and 44.9 GPa ( cm-1) for B6O, which are in good agreement with the experimental values of 42-49 GPa for B4C in Ref. 5 and 45 GPa for B6O in Ref. 25, respectively.
Finally, we concern the ternary superhard BC2N. Recently, we reported a new phase (-BC2N) with the P-42M space group, R36 and the simulated XRD pattern is in good agreement with the experimental data.R11 However, the first-principles calculation reveals that the non-resonant first-order Stokes Raman spectrum of -BC2N does not match to the measured Raman pattern of the synthesized BC2N sample. R12 We construct a modified structure of BC2N, named as -BC2N here, with the same space group as -BC2N. In fact, the unique difference between -BC2N and -BC2N is that only B and N atoms are interchanged each other. The simulated Raman spectrum of -BC2N is in good agreement with the experimental Raman pattern of the synthesized BC2N sample. R12 Based on the simulated Raman spectrum of -BC2N as Table II, the evaluated hardness of -BC2N is 75.5 GPa, which agrees with the experimental value of 76 GPa. R11
It should be noted that the role of valence electron in chemical bond are not considered here. This model could also be simplified for roughly estimating hardness of potential superhard materials with the Vickers hardness above 40 GPa, as follows: to avoid the procedure eliminating the translational and rotational Raman modes, we only need to select the strong Raman modes with their Raman frequencies higher than the critical frequency cm-1 ( is the diagnostic Raman frequency of GPa, when a substance with its Vickers hardness between 20 and 40 GPa is usually considered as a hard material). For example, for superhard diamond-like BC5 (-BC5),R37 there is one strongest Raman mode located at 1200 cm-1 above in the measured Raman spectrum. By using this single strongest Raman mode, we estimate its Vickers hardness to be 72.4 GPa, which is in excellent agreement with the experimental value of 71 GPa.R37 To display an intuitive comparison, Fig. 2 summaries the calculated and experimental Vickers hardness values for 25 crystals. The good agreement validates the predictive power of our model.
In conclusion, we propose a model that reveals a quantitative relationship between hardness and vibrational Raman frequencies. This model has a tremendous advantage that, to evaluate the hardness synthesized materials, we do not need to know the exact atom arrangement provided that the Raman spectrum can be measured. The present work validates a universal technique for the nondestructive and indirect hardness measurement, it also be potential used to explain enhancement of the surface or vacancy hardness because of the high sensitivity of the Raman spectra to the small change in structure. Moreover, since different Raman configurations for a single crystal will result in different Raman spectra, our model can be anticipated to explore the anisotropy of the hardness to some extent. This Raman model finds in fact a new application for the Raman spectroscopy.
This work is in part supported by the National Natural Science Foundation of China under Grants Nos. 50821001 and 50532020, by the 973 Program of China under Grant Nos. 2006CB921805 and 2005CB724400.
References
- (1) R. B. Kaner, J. J. Gilman, and S. H. Tolbert, Science 308, 1268 (2005).
- (2) J. Haines, J. M. Léger, and G. Bocquillon, Annu. Rev. Mater. Res. 31, 1 (2001).
- (3) A. L. Liu and M. L. Cohen, Science 245, 841 (1989).
- (4) D. M. Teter, Mater. Res. Bull. 23, 22 (1998).
- (5) V. V. Brazhkin, A. G. Lyapin, and R. J. Hemley, Philos. Mag. A 82, 231 (2002).
- (6) F. M. Gao, J. L. He, E. D. Wu, S. M. Liu, D. L. Yu, D. C. Li, S.Y. Zhang, and Y. J. Tian, Phys. Rev. Lett. 91, 015502 (2003) and references therein.
- (7) A. Šimnek and J. Vackář, Phys. Rev. Lett. 96, 085501 (2006) and references therein.
- (8) K. Y. Li, X. T. Wang, F. F. Zhang, and D. F. Xue, Phys. Rev. Lett. 100, 235504 (2008).
- (9) A. Zerr, G. Miehe, G. Serghiou, M. Schwarz, E. Kroke, R. Riedel, H. Fueß, P. Kroll, and R. Boehler, Nature 400, 340 (1999).
- (10) A. F. Young, C. Sanloup, E. Gregoryanz, S. Scandolo, R. J. Hemley, and H. K. Mao, Phys. Rev. Lett. 96, 155501 (2006).
- (11) V. L. Solozhenko, D. Andrault, G. Fiquet, M. Mezouar, and D. Rubie, Appl. Phys. Lett. 78, 1385 (2001).
- (12) H. W. Hubble, I. Kudryashov, V. L. Solozhenko, P. V. Zinin, S. K. Sharma, and L. C. Ming, J. Raman Spectrosc. 35, 822 (2004).
- (13) S. Baroni, S. de Gironcoli, A. D. Corso, and P. Giannozzi, Rev. Mod. Phys. 73, 515 (2001); X. Gonze and C. Lee, Phys. Rev. B 55, 10355 (1997).
- (14) M. Lazzeri and F. Mauri, Phys. Rev. Lett. 90, 036401 (2003); www.pwscf.org.
- (15) S. Baroni and R. Resta, Phys. Rev. B 33, 5969 (1986); P. Umari, X. Gonze, and A. Pasquarello, Phys. Rev. Lett. 90, 027401 (2003).
- (16) A. Kailer, K. G. Nickel, and Y. G. Gogotsi, J. Raman Spectrosc. 30, 939 (1999).
- (17) J. A. Sanjurjo, E. López-Cruz, P. Vogl, and M. Cardona, Phys. Rev. B 28, 4579 (1983).
- (18) Z. C. Feng, A. J. Mascarenhas, W. J. Choyke, and J. A. Powell, J. Appl. Phys. 64, 3176 (1988).
- (19) N. Wada, S. A. Solin, J. Wong, and S. Prochazka, J. Non-Cryst. Solids 43, 7 (1981).
- (20) R. J. Hemley, H. K. Mao, and E. C. T. Chao, Phys. Chem. Minerals. 13, 285 (1986).
- (21) D. R. Tallant, T. L. Aselage, A. N. Campbell, and D. Emin, Phys. Rev. B 40, 5649 (1989).
- (22) N. Vast, S. Baroni, G. Zerah, J. M. Besson, A. Polian, M. Grimsditch, and J. C. Chervin, Phys. Rev. Lett. 78, 693 (1997).
- (23) H. Werheit, and U. Kuhlmann, J. Solid. State. Chem. 133, 260 (1997).
- (24) R. Lazzari, N. Vast, J. M. Besson, S. Baroni, and A. D. Corso, Phys. Rev. Lett. 83, 3230 (1999).
- (25) J. L. He, E. D. Wu, H. T. Wang, R. P. Liu, and Y. J. Tian, Phys. Rev. Lett. 94, 015504 (2005) and references therein.
- (26) A. Tabata, A. P. Lima, L. K. Teles, L. M. R. Scolfaro, J. R. Leite, V. Lemos, B. Schttker, T. Frey, D. Schikora, and K. Lischka, Appl. Phys. Lett. 74, 362 (1999).
- (27) G. D. Mahan, R. Gupta, Q. Xiong, C. K. Adu, and P. C. Eklund, Phys. Rev. B 68, 073402 (2003).
- (28) A. Mooradian and G. B. Wright, Solid State Commun. 4, 431 (1966).
- (29) R. Carles, N. Saint-Cricq, J. B. Renucci, M. A. Renucci, and A. Zwick, Phys. Rev. B 22, 4804 (1980).
- (30) B. Y. Geng, Q. B. Du, X. W. Liu, J. Z. Ma, X. W. Wei, and L. D. Zhang, Appl. Phys. Lett. 89, 033115 (2006).
- (31) R. G. Greene, H. Luo, A. L. Ruoff, S. S. Trail, and F. J. DiSalvo, Jr., Phys. Rev. Lett. 73, 2476 (1994).
- (32) J. Wagner, A. Fischer, W. Braun, and K. Ploog, Phys. Rev. Lett. 49, 7295 (1994).
- (33) O. Brafman and S. S. Mitra, Phys. Rev. 171, 931 (1968).
- (34) R. Vogelgesang, A. J. Mayur, M. Dean Sciacca, E. Oh, I. Miotkowski, A. K. Ramdas, S. Rofriguez, and G. Bauer, J. Raman Spectrosc. 27, 239 (1996).
- (35) I. Yonenaga, Chemistry for Sustainable Development 9, 19 (2001).
- (36) X. F. Zhou, J. Sun, Y. X. Fan, J. Chen, H. T. Wang, X. J. Guo, J. L. He, and Y. J. Tian, Phys. Rev. B 76, 100101(R) (2007); X. F. Zhou, J. Sun, G. R. Qian, X. J. Guo, Z. Y. Liu, Y. J. Tian, and H. T. Wang, J. Appl. Phys. 105, 093521 (2009).
- (37) V. L. Solozhenko, O. O. Kurakevych, D. Andrault, Y. L. Godec, and M. Mezouar, Phys. Rev. Lett. 102, 015506 (2009).
Table I. Hardness, and (in parenthesis) of LO and TO Raman modes, for 22 kinds of diamond-like crystals. , and are the calculated Vickers hardness by our, Gao’s [6] and Šimunek’s [7] models, respectively. is the experimental Vickers hardness (unless noted, from Refs. [6,7]). Despite the fact that there are no measured Vickers hardness for 8 materials from ZnSe and below, their Knoop hardness values marked by the asterisk are listed as a reference.
| Crystals | ||||||
|---|---|---|---|---|---|---|
| Diamond | 1332 (1.0)a | 1332 (1.0)a | 97.0 | 93.6 | 95.4 | 96 |
| BN | 1305 (0.7)b | 1055 (1.0)b | 64.9 | 64.5 | 63.2 | 66 |
| SiC | 976 (0.6)c | 796 (1.0)c | 32.0 | 30.3 | 31.1 | 34 |
| BP | 829 (1.0)b | 799 (0.2)b | 29.2 | 31.2 | 26.0 | 33 |
| AlN | 893 (0.2)b | 668 (1.0)b | 20.9 | 21.7 | 17.6 | 18 |
| GaN | 741 (1.0)d | 555 (0.6)d | 18.8 | 18.1 | 18.5 | 15.1 |
| Si | 520 (1.0)a | 520 (1.0)a | 12.0 | 13.6 | 11.3 | 12 |
| AlP | 501e (0.5) | 440e (1.0) | 9.7 | 9.6 | 7.9 | 9.4 |
| InN | 588 (1.0)d | 457 (0.6)d | 12.6 | 10.4 | 8.2 | 9 |
| Ge | 304 (1.0)a | 304 (1.0)a | 5.2 | 11.7 | 9.7 | 8.8 |
| GaAs | 292 (0.6)f | 269 (1.0)f | 4.5 | 8.0 | 7.4 | 6.8m |
| InP | 345 (0.9)f | 304 (1.0)f | 5.6 | 6.0 | 5.1 | 5.4 |
| InAs | 238g (0.5) | 217g (1.0) | 3.4 | 5.7 | 4.5 | 3.8 |
| ZnSe | 252 (1.0)h | 203 (0.7)h | 3.5 | - | 2.6 | 1.1m |
| BAs | 714 (0.4)i | 695 (1.0)i | 20.8 | - | 19.9 | 19* |
| GaP | 403 (1.0)e | 367 (0.2)e | 7.7 | 8.9 | 8.7 | 9.5* |
| AlAs | 404j (0.5) | 363j (1.0) | 7.2 | 8.5 | 6.8 | 5* |
| GaSb | 237 (0.7)a | 227 (1.0)a | 3.5 | 6.0 | 5.6 | 4.5* |
| AlSb | 340 (0.3)f | 319 (1.0)f | 5.6 | 4.9 | 4.9 | 4* |
| InSb | 189 (0.7)a | 179 (1.0)a | 2.6 | 4.3 | 3.6 | 2.2* |
| ZnS | 351 (1.0)k | 276 (0.1)k | 6.2 | - | 2.7 | 1.8* |
| ZnTe | 206 (1.0)l | 177 (0.8)l | 2.8 | - | 2.3 | 1.0* |
aReference [16]. bReference [17]. cReference [18]. dReference [26]. eReference [27]. fReference [28]. gReference [29]. hReference [30]. iReference [31]. jReference [32]. kReference [33]. lReference [34]. mReference [35].
Table II. For 7 kinds of complex materials, () of vibrational Raman modes, our Vickers hardness , and the experimental Vickers hardness . The Vickers hardness predicated by the microscopic model has been also given as a comparison.
| Crystals | () | () | () | () | () | () | () | |||
|---|---|---|---|---|---|---|---|---|---|---|
| -Si3N4 | 1047(1.0)a | 939(1.0)a | 928(0.8)a | 865(0.6)a | 732(1.0)a | 619(0.4)a | 451(0.6)a | 28.8 | 30.3f | 30f |
| -SiO2 | 464(1.0)b | 450(0.1)b | 9.8 | 30.6f | 11f | |||||
| Stishovite | 967(0.1)c | 753(1.0)c | 25.3 | 30.4f | 17-23g, 33g | |||||
| -Boron | 1186(0.85)d | 1123(0.12)d | 933(0.7)d | 795(1.0)d | 776(0.15)d | 39.8 | 42h | 42h | ||
| B4C | 1085(1.0)d | 1000(0.5)d | 830(0.3)d | 720(0.4)d | 40.5 | 42h | 30g, 42-49g | |||
| B6O | 1119(0.5)e | 1034(1.0)e | 902(1.0)e | 44.9 | 44h | 38h,45h | ||||
| -BC2N | 1328(0.9) | 1326(1.0) | 1292(0.3) | 1176(0.6) | 1076(0.4) | 930(0.4) | 75.5 | 78f | 76f |
aReference [19]. bReference [14]. cReference [20]. dReference [21]. eReference [23]. fReference [6]. gReference [5]. hReference [25].
Figure Captions