Modelling the strategies for age specific vaccination scheduling during influenza pandemic outbreaks
Abstract.
Finding optimal policies to reduce the morbidity and mortality of the ongoing pandemic is a top public health priority. Using a compartmental model with age structure and vaccination status, we examined the effect of age specific scheduling of vaccination during a pandemic influenza outbreak, when there is a race between the vaccination campaign and the dynamics of the pandemic. Our results agree with some recent studies on that age specificity is paramount to vaccination planning. However, little is known about the effectiveness of such control measures when they are applied during the outbreak. Comparing five possible strategies, we found that age specific scheduling can have a huge impact on the outcome of the epidemic. For the best scheme, the attack rates were up to 10% lower than for other strategies. We demonstrate the importance of early start of the vaccination campaign, since ten days delay may increase the attack rate by up to 6. Taking into account the delay between developing immunity and vaccination is a key factor in evaluating the impact of vaccination campaigns. We provide a general framework which will be useful for the next pandemic waves as well.
Keywords: influenza outbreak, epidemiological model, age specific transmission, vaccination strategy, A(H1N1)v
Key words and phrases:
pandemic influenza, compartmental model, vaccination strategies, A(H1N1)v1991 Mathematics Subject Classification:
Primary 92D30Diána H. Knipl
Bolyai Institute, University of Szeged, Hungary, H-6720 Szeged, Aradi vértanúk tere 1.
Gergely Röst
Analysis and Stochastics Research Group, Hungarian Academy of Sciences
Bolyai Institute, University of Szeged, Hungary, H-6720 Szeged, Aradi vértanúk tere 1.
(Communicated by ….)
1. Introduction
Developing strategies for mitigating the severity of the influenza epidemics is a top public health priority. As soon as vaccine became available, vaccination campaigns started in several countries as a primary mitigation strategy against the first wave of the 2009 A(H1N1) pandemic. Mathematical models are powerful tools for evaluating intervention strategies and quantifying the potential benefits of different options (Moghadas et al. 2009). We use a compartmental system with five age groups representing the European population, that incorporates transmission dynamics based on social contact profiles from survey data (Mossong et al. 2008) and vaccination status. Vaccination has not only direct benefit to the individual, but also reduces the risk for those who have not been vaccinated. Giving priority to groups who are the most responsible for spreading the infection can be a benefit to other groups as well.
US officials have announced that over several months, vaccines for up to 20% of the population per month could be delivered (Robinson 2009), although later they were facing difficulties with providing supplies. Hungary has a similar maximal production capacity in the range of up to 5% of the population per week (Falus 2009), thus here we targeted a 60% vaccine coverage by the end of a three months campaign. Recent studies revealed the importance of age specific intervention strategies, and discussed how to distribute vaccines among age groups, assuming preseasonal vaccination (Longini & Halloran 2005; Medlock & Galvani 2009). Here we focus on a completely different aspect: how to prioritize the different groups in the timing of the schedule. Therefore for the purposes of this study, in the baseline scenario we assume that a 60% total coverage is reached within each age group by the end of the vaccination campaign, and we compare different strategies for the order and the timing of vaccinating different age groups during the campaign. Furthermore, a range of different scenarios are considered in the sensitivity analysis. The relatively low basic reproduction number of influenza (see Chowell et al. 2007 and Chowell et al. 2006 for estimations of the reproduction numbers for seasonal and pandemic influenza in temperate countries) implies that effective measures such as vaccination before the pandemic wave could be important, however little is known about the effectiveness of such measures during a pandemic wave.
As it could be observed all around the world, vaccination campaigns and A(H1N1)v outbreaks overlapped in time, thus the preseasonal vaccination assumption does not hold. There is an ongoing race between the vaccination campaign and the dynamics of the outbreak, hence it is necessary to implement a dynamic modelling of the interplay of the vaccination and the influenza transmission.
Age structured models are necessary for multiple reasons: various age groups have very different contact profiles thus playing different roles in transmitting the disease. Furthermore, age specific susceptibility, infectiousness, vaccine efficacy and mortality patterns are also important issues. We developed a compartmental model to track five age groups. We incorporated the fact that it takes about two weeks to develop antibodies and acquire immunity after vaccination, and during this intermediate period an individual might contract the disease (Nichol 1998). This time delay is shown to be a significant factor during the outbreak. To our knowledge this is the first modelling study which reckons with that.
Here we evaluate vaccination strategies for two outcome measures: overall attack rate and total deaths estimated from recent mortality data of the novel A(H1N1)v pandemic (Donaldson et al. 2009 ). Though there are several other possible interventions (antiviral treatment, social distancing, school closures etc., see Alexander et al. 2007, 2009 ; Ferguson et al. 2006; Merler et al. 2009; Moghadas et al. 2008, 2009; Gojovic et al. 2009) to mitigate the burden of the outbreak, here we focus only on vaccination. The effect of other control measures can be taken into account in a simplified way by lowering the reproduction number. To show the robustness of our results, a sensitivity analysis was performed with respect to several key model parameters, such as the basic reproduction number, vaccine efficacy, epidemiologic characteristics of the virus, moreover the duration and the intensity of the vaccination campaign.
In the following, we detail the model structure, discuss our results and their epidemiological implications, and place them in the context of the ongoing battle against the nascent A(H1N1)v pandemic. Our aim was to develop a model that can be applied to explore the effect of alternative vaccination strategies, and this model can also be used for predicting the future incidence of cases in the next wave of pandemic influenza.
2. The model
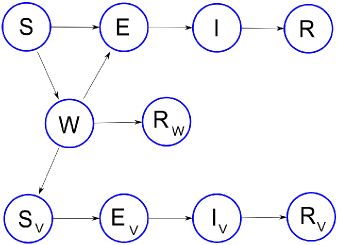
Our model is a compartmental differential system, based on the classical SEIR (usceptible, xposed, nfective, ecovered) model. We have incorporated three features to develop a more realistic model:
i) we introduced age structure with five age groups, where the contacts between age groups are derived from the European survey Mossong et al. 2008,
ii) we account for the fact that it takes up to 14 days after vaccination to produce sufficient amount of antibodies to provide immunity (CDC 2009, Nichol 1998),
iii) we did not assume vaccination before the outbreak, because we want to model the interplay between the dynamics of the epidemics and the vaccination campaign.
It is assumed that the transmission of infection occurs through close contacts between susceptibles and infected individuals, where for simplicity, mass action incidence is used (Alexander et al. 2008, 2009; Arino et al. 2006). Exposed individuals in the class cannot transmit the disease in the latent period, during which viral titres increase to detectable and transmissible levels (Baccam et al. 2006). Since the latent period is relatively short, we neglected the small probability of someone receiving the vaccine while being in the class . We assume further that infected and recovered individuals will not be vaccinated, therefore vaccination is administered only for individuals in the class until we reach the targeted 60% coverage on the population level. If the pool of susceptibles depleted before reaching that coverage, we stopped vaccination in the simulations. However, contacts of cases may have already been infected by the time that vaccine is taken up, because high proportion of infection is not laboratory confirmed, and also asymptomatic or atypical infections can also occur. The magnitude of such limitation is less of a problem when considering the first epidemic wave of pandemic influenza than for the second or third wave. The model tracks 5 age groups, distributed as the 2005 European Union population (Eurostat 2006). We considered the case when a single dose is sufficient to induce immunity. A single dose is recommended for the Hungarian vaccine (Johansen et al. 2009; Vajo et al. 2009), and according to the most up-to-date recommendation of the European Medicines Agency that can be sufficient for other vaccines as well, see also (Nishiura & Iwata 2009; Greenberg et al. 2009). The five age groups we considered are 0-9, 10-19, 20-39, 40-64 and 65+ years old. In the model equations we use the upper index to denote the corresponding age group, respectively. Based on the most recent serological data (Miller et al. 2010), we assumed no pre-existing immunity in the first four age groups, and 20 reduction in susceptibility in the elder age group.
Vaccinated individuals move into the class for an intermediate period, during that infection is still possible. After 14 days they become immune with probability , and move into the class, or if the vaccine was ineffective, then they move into , meaning that they are still susceptible to the disease despite having been vaccinated. Such individuals will not receive the vaccine again, but can come into contact with infectious individuals and contract the disease. It is assumed in the baseline scenario that the same epidemiological parameters apply to these individuals as to the non-vaccinated, i.e. and , except that we assumed a reduction of infectiousness for unsuccessfully vaccinated persons (see Table 1). This factor is set to be 0.75 in the baseline scenario, but other possibilities for the parameters of unsuccessfully vaccinated individuals are also discussed in the sensitivity analysis. The epidemiological parameters, such as the length of incubation and infectious periods, vaccine efficacy, transmission rates etc. are taken from the literature and discussed in detail in Section 3.
The transmission diagram of our model is presented in Figure 1, without the age structure.
Thus, altogether we have 50 compartments and the following non-autonomous system of 50 differential equations
where the force of infection is given by
and the upper index represents the corresponding age group. Here are the prescribed piecewise constant vaccination rate functions determined by the specific strategy. In our equations we ignored mortality, since even a 40% attack rate and 0.05% case fatality rate cause very minor changes in the demographic scale, and the number of disease induced deaths can be derived simply from the attack rate and the case fatality ratio. Nevertheless, the age specific mortality is an important issue, and such information can be obtained from the age specific attack rates calculated by the model and the mortality patterns when they are available, see Section 4 and 5. We start the model at , with time measured in days, introducing a small number of infectives into the population. The time refers to the delay in start of the vaccination campaign, thus for any , and in a case of a three months campaign, for as well.
3. Parameters
The epidemiological parameters are summarized in Table 1. So far there are no precise clinical estimates of the basic model parameters and defining the inverse average exposed and infectious time durations, hence we used plausible values from the range estimated in Balcan et al. 2009 . We used the age distribution of the European Union (Eurostat 2006) for our simulations. For vaccine efficacy we used the same parameters as in Medlock & Galvani 2009, obtained from Basta et al. 2008. In the sensitivity analysis we considered various values for the reduction of infectiousness and vaccine efficacy against infection . The value of , representing the inverse time duration needed to develop antibodies to gain immunity, is the same as US CDC 2009 uses, being in accordance with Nichol 1998.
| parameter | notation | value (range) | source |
|---|---|---|---|
| latent period | 1.25 days | Balcan et al. 2009 | |
| infectious period | 3 days | Balcan et al. 2009 | |
| vaccine efficacy for 0-65 yrs old | 0.8 (0.7-0.9) | Basta et al. 2008 | |
| vaccine efficacy for 65+ yrs old | 0.6 (0.5-0.7) | Basta et al. 2008 | |
| transmission rates | see 3.2 | Mossong et al. 2008 | |
| time to develop antibodies | 14 days | Nichol 1998 | |
| reduction in infectiousness | 0.75 (0.5-1) | ||
| vaccination coverage | 60%(30%-80%) | ||
| basic reproduction number | 1.4 (1.2-1.8) | Truite et al. 2009 |
3.1. Baseline scenario
The severity of the influenza outbreak and the initial rate of increase depends on the basic reproduction number , which is among the most urgently estimated quantities in a pandemic situation, and defined as the average number of secondary infectious cases caused by an infected individual in a population consisting of susceptibles only (Diekmann et al. 2010; Heffernan et al. 2005). In the baseline scenario we assumed that the basic reproduction number is 1.4. This value seems to be reasonable (Truite et al. 2009) and similar to mean estimates of seasonal infuenza in temperate countries , however, we considered milder and more severe cases (, , ) as well. We run computer simulations for a population of . Due to the special form of the equations, the results are scalable and the attack rates (defined as the fraction of susceptibles who do not contract the disease during the course of the outbreak) remain the same for populations of any size. In the baseline scenario, after the start of the vaccination campaign at time , vaccine is administered to 0.667% of the population per day, thus reaching a coverage of 60% at the end of the campaign at time . This is an intensive, but realizable vaccination plan (Falus 2009). The distribution of these vaccines among the age groups on any given day is determined by the specific strategy (see Section 4). Based on European Union statistics Eurostat 2006, we use the following age distribution per 100 000 citizens:
where is the total number of individuals in age group , and
3.2. The contact matrix and the basic reproduction numbers
There are practical reasons for using five age groups besides for simplicity: we think that targeting smaller groups is not feasible in a real situation, and we can not expect to have vaccination data with such details. Also, in view of the data in Mossong et al. 2008, the population can be divided into these five age groups with more or less similar contact profiles within these larger groups, which are then easier to be targeted. Following Medlock & Galvani 2009, we used the European survey data Mossong et al. 2008 to estimate the transmission rates between age groups. That survey dealt with 17 age groups (0,1-4,5-9,10-14,..,70-74 and 75+) in 8 European countries. Since we work with different age groups, after averaging the European contact matrices from the 8 countries weighted by their population size, we calculated a contact matrix , using weighted averaging based on EU age distribution (Eurostat 2006) to combine smaller age groups into the larger ones. Since contacts are assumed to be mutual, following Medlock & Galvani 2009, we performed a symmetrization procedure to ensure that the total number of contacts between two age groups are consistent: we set
Eventually, we obtained the contact matrix
where the elements represent the number of contacts an individual in age group has with individuals in age group , and satisfy
Age specific contact rates can be converted to the age specific transmission rates as follows. An infected individual in age group has contacts with individuals in age group , at some time a fraction of those contacts are with susceptibles, with vaccinated susceptibles and with recent vaccinees. Thus, we obtain that the rates of infections in age group by individuals in age group is given by
where is a transmission parameter, which involves the normalization of the contacts to unit time and the infectiousness of the virus. By defining , we obtain the model equations and force of infections described in Section 2. Using the transmission rates we can construct the next generation matrix (see Diekmann et al. 2010), and then fit numerically to ensure that the basic reproduction number, which is the dominant eigenvalue of the next generation matrix, is equal to 1.4.
Since in the early phase of the pandemic (where for and ), the number of infections generated in age group by an infected individual from age group is given by . The elements of the next generation matrix are given by this formula, i.e.
thus they can be obtained from the elements of the contact matrix.
By standard numerical procedure we find that if , then the dominant eigenvalue of , which is the basic reproduction number , equals to 1.4, thus in the baseline scenario we use this value.
Note that in this scenario , which means that there is a self sustaining outbreak in the age group of 10-19 years old individuals.
4. Strategies, simulations and results
We simulate, evaluate and compare five possible strategies for the vaccination schedule. In each of the strategies, vaccine is administered to about 0.667 of the population daily and a 60 vaccination coverage is achieved by the end of the campaign in every age groups. Each strategy determines the piecewise constant vaccination functions straightforward. The overall attack rates and the final size of the epidemic are estimated from taking the values of the non-infected classes after the pandemic wave, at .
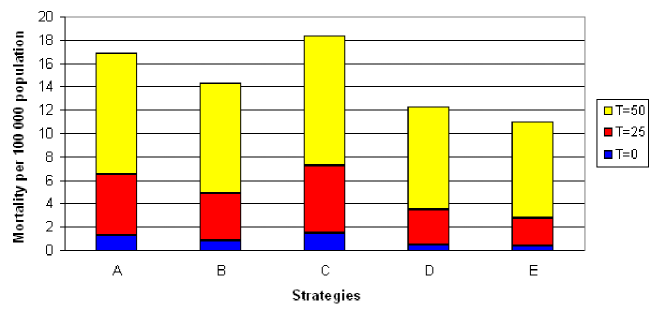
The case fatality ratio is yet to be determined for many countries, however estimated rates are coming down for industrialised countries to as low as 0.02% (ECDC 2009, Presanis et al. 2009; meaning that one in five thousand cases has a fatal outcome). Most recent risk assessments suggest that in European countries the overall fatality rate may be less or similar to a moderate influenza season. However, age specific rates are expected to show a very different picture, with higher mortality in younger age-groups. Here we used the recently published data (Donaldson et al. 2009, Vaillant et. al 2009), and calculated with the mortality rate 20:12:30:60:80 fatal outcomes per 100 000 cases in the five age groups to compare the five strategies, but other patterns are also discussed in the sensitivity analysis.
4.1. The five strategies
Here we describe the five strategies we compare. For each strategy, 60% overall vaccination coverage is reached by the end of the campaign in the baseline scenario.
A - Conventional strategy
This strategy consists of three phases and we constructed it to resemble the official strategy of Hungarian health authorities. Similar strategies have been proposed for many other countries.
Phase 1 : 42 days, vaccination of high risk groups, elder people, emergency and health care personnel, workers of critical infrastructure facilities. According to the age specific breakdown (which is described in Section 3.1), 2000, 16000, 10000 people are being vaccinated in age groups 0-19, 20-64, 65+, respectively.
Phase 2 : Vaccination campaign in schools for 18 days, 12000 children of age 19 years old.
Phase 3 : In the last 30 days, vaccination is given to the general population such that we achieve the 60 coverage in each group by the end of this phase.
B - Uniform strategy
This is the universal vaccination strategy, when there are no prioritized age groups, so we assume that vaccination is completely random and 0.667 of each age group is vaccinated daily, throughout the 90 days.
C - Elderly first strategy
Phased vaccination of elder people (age 65 years old) first up to 60 coverage before vaccine is delivered to the other part of the population (age 64 years). This two-phase strategy is similar to plans usually implemented against seasonal flu.
Phase 1 : 15 days, 65+ years old
Phase 2 : 75 days, 0-64 years old
D - Children first strategy
Phased vaccination of children (age 18 years old) first up to 70 coverage before vaccine is delivered to adults was studied in Yang et al. 2009. The only difference here in the D strategy is that coverage goes up to only 60, and our prioritized age group is the 0-19 years old. Specifically:
Phase 1 : 20 days, 0-19 years old
Phase 2 : 70 days 20+ years old
E - By contacts strategy
Here we take advantage of the full contact structure of our five age groups, and vaccinate them in five phases, according to the decreasing order of their total contact numbers.
Phase 1 : 10-19 years old, 11 days
Phase 2 : 20-39 years old, 26 days
Phase 3 : 0-9 years old, 10 days
Phase 4 : 40-64 years old, 29 days
Phase 5 : 65+ years old, 15 days
4.2. Main results
We have evaluated and compared the above described five strategies for various delays in start of the vaccination. Increasing population level immunity may slow down the spread of infection, reduce the height of the epidemic peak thus decreasing the pressure on health care facilities, and significantly reduce morbidity and mortality of pandemic infections. Thus our main outcome measures are the age specific attack rates and number of fatal cases.
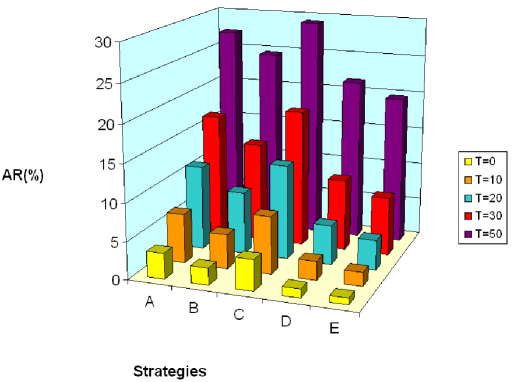
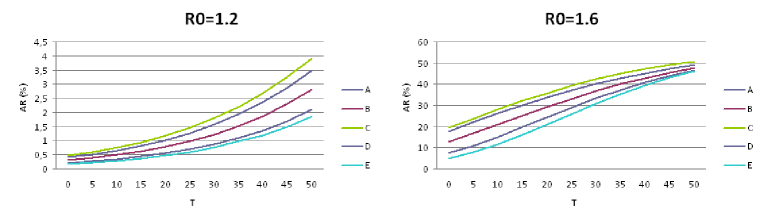
The overall attack rates are summarized in Figure 2 and Figure 3. We can see that by means of illness attack rate, the strategy gives the best result, followed by and in that order, whenever we start the vaccination campaign. In case of an early start on day 1, all of the five strategies are effective with attack rates between 1-4 . As the delay in start of vaccination increases, the significance of our choice of strategy becomes more apparent. We can advert the infection of 10 of the population by choosing strategy instead of if the campaign starts between days 30 and 45. If vaccination starts on day 50, the attack rates will be between 21-29 . For the sake of comparison we note that in the absence of a vaccination campaign, results in an a 42% attack rate.
The delay in start of vaccination is a crucial factor on the final size of the pandemics: even for the best strategy, ten days delay can increase the overall attack rate by up to 6 (see Figure 3).
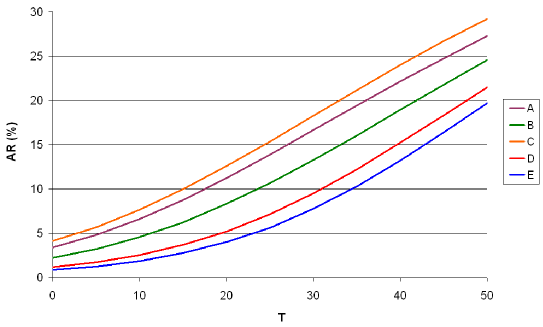
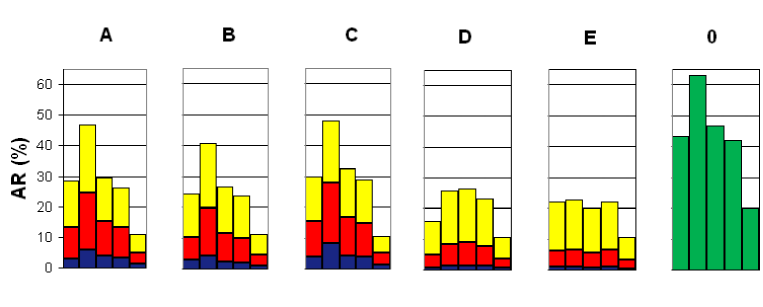
Figure 4 shows the attack rates in the five age groups for the five strategies and also for the case when there is no vaccination at all. Depending on which age group we want to protect, we can choose different strategies. Since age groups peak at different times, the delay in start of vaccination may also be a factor in choosing our strategy: for example for the strategy , which gives priority to the elder age group, protects them essentially to the same extent as any other strategy (attack rates slightly over 10%), while there are large differences in the attack rates for the age groups 0-9 and 10-19 years old. For and the strategy protects the elder better with 0.5 and 3.2 attack rates versus the 1.4 and 5.4 attack rates that correspond to the strategy among the elder age group, despite the fact that in the strategy they are the last to get the vaccine. This very interesting result may seem counterintuitive, however some similar findings have already been obtained for preseasonal vaccination in Medlock & Galvani 2009. Furthermore, the public health implication of this phenomenon is that if the actual policy is to protect a specific age group, then the best strategy depends also on the delay in start of vaccination, therefore authorities must be able to adapt their strategy as the pandemic evolves. Very high attack rates can be observed among teenagers for strategies and .
The comparison of the strategies by means of mortality is depicted in Figure 5. The relation between the strategies for this outcome measure is similar to the attack rates: strategy being the best and the worst. However, we can observe a much bigger difference between the best and the worst schedules: the overall mortality is 50 higher for the strategy than for the strategy for a late start in vaccination, and six times higher for an early start. The reason of this huge difference is partly that compared to the elderly, the recent H1N1 causes unusually high mortality among children and young adults, who has the most contacts as well and prioritized by strategy . The age specific details can be seen in Figure 6.
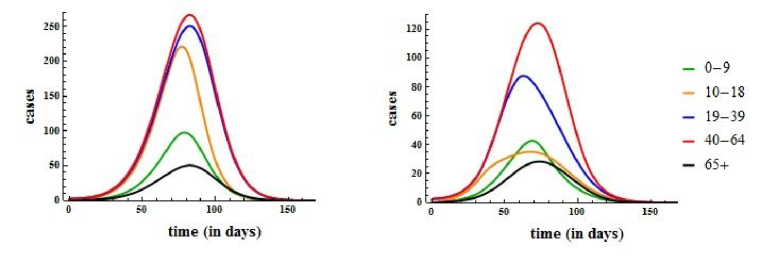
The epidemic curves in the five age groups are plotted in Figure 7 for strategies and with . Notice that age groups peak in different times, and for the strategy the teenagers are affected disproportionally by the epidemics.
5. Sensitivity analysis
We performed a systematic analysis to reveal the sensitivity to several key parameters. Our results turned out to be very robust in the sense that modifying some parameters do not change which strategy is the best if our outcome measure is the overall attack rate. However, the mortality pattern is important to select our strategy to minimize the number of fatal cases. Changing several parameters at the same time, we did not observe any unexpected behaviour.
Basic reproduction number
We consider a less () and a more severe () situation, Figure 7 shows the dependence of the attack rates on . In the milder case, we can observe that for the early start of vaccination for all five strategies the attack rates are below 1, the difference between the strategies shows only for delayed start, attack rates being between 2-4. Thus a 60 vaccination coverage is able to prevent a large outbreak even if the campaign starts relatively late. Note that without vaccination, the attack rate is 22.5. In the more severe situation in the case of late start each strategy can mitigate the pandemic only a little and there is not much difference between the attack rates: about 50 for all strategies. In the absence of vaccination, the attack rate is 55, thus in this situation the vaccination campaigns are not effective. There is a significant difference between the strategies if we start the campaign early, in this case with strategy we have only 5 attack rate, while for the worst strategy the attack rate is as high as 19 if . In the even more severe case , for the early start the attack rates vary between 18 and 36, strategy being far the best. However, for the late start the difference between the strategies mostly vanishes and the attack rates exceed 60, being very close to the 64 attack rate of the no vaccination case.
Vaccine efficacy
Monitoring the serological responses to influenza vaccines alone is not sufficient to establish evidence that a vaccine is effective, because there has been no clear relationship shown between serological response to influenza vaccination and subsequent morbidity and mortality. Vaccine effectiveness measures with clinical outcomes may provide better estimate for the evaluation of how much protection the vaccine may provide, however such estimates are not readily available at this stage of the vaccination campaign against pandemic influenza. Considering less effective ( for and ), or more effective vaccine ( for and ) against infection (see Basta et al. 2008, CDC 2008) resulted in slightly lower and higher attack rates, respectively, typically by 0.5-1.5.
Reduction of infectiousness
Different scenarios were considered regarding the infectiousness of vaccinees. Taking (no reduction in infectiousness) or (more significant reduction in infectiousness) did not change much in the outcomes, the differences in the attack rates were less than 1, compared to the baseline scenario . Assuming that unsuccessful vaccination shortens the infectious period by one day in case of infection, i.e. , the attack rates are decreased by less than 1.
Intensity of vaccination campaign
For the purposes of this study we assumed that 60% coverage can be reached in 90 days in the baseline scenario. In the sensitivity analysis, we compared the strategies and with respect to the intensity and the length of the vaccination campaign, adjusting the phases accordingly. Assuming that we complete the vaccination of 60 of the population in 120 days (i.e. vaccine is administered to 0.5 of the population daily), then the attack rates were at most 4 higher for the strategy , and 6 higher for the strategy , depending on the delay in start of the campaign. A less intensive campaign enlarged the differences between the strategies, which implies that choosing the best strategy is even more important if the vaccine availability or the capacity of the health care system is limited.
We found another counterintuitive result regarding the strategy : vaccinating 60 in 120 days gives a worse outcome than vaccinating 45 in 90 days. The reason behind this phenomenon is that if we adjust our phases to the given time intervals, than in the first case the phases will be longer and the most important age groups in the second phase receive the vaccine in such a delay that outweighs the benefits of vaccinating more people, and vaccinations after day 90 has very limited effect on the outcome.
A much less intensive campaign, vaccination of only 30 in 90 days resulted in drastically higher overall attack rates, up to 12, depending on the strategy and the delay in start of the campaign. Strategy is consistently the best option for a less intensive campaign, having 5-6 smaller attack rate than strategy for both early and late start of the campaign.
For a very intensive campaign, when 80% coverage is reached within 90 days, the attack rates are lower, for example for strategy it is 17% for , 4% for and below 2% for .
Mortality patterns
For the sake of comparison, we examined the outcomes of the strategies for a mortality pattern which is somewhat different from what we see for A(H1N1)v, namely the 1957 pandemic. Suggested by Serfling et al. 1967, we assumed that the fatality rates for the five age groups per 100 000 cases have the proportions 0.1:0:0.1:1:4, meaning that mortality is four times higher in the elderly, than in the age group 40-64 years old etc. We observed that in this case there is no significant difference in the mortalities between the five strategies, since the vast majority of fatal cases occurs in the elder age groups, where the five strategies resulted in similar attack rates.
It is important to notice that in Figure 5 we overestimated the number of fatal cases for strategy , since then the high risk groups are vaccinated first in each age group thus proportionally less high risk people will be infected than in the other strategies, reducing the mortality. This factor of reduction is hard to determine (see Fleming & Elliott 2006 ), since we need to estimate the fraction of high risk individuals in each age group, and also their relative risk for a fatal outcome. Nevertheless, we can see that the ratio of the attack rates for strategy and strategy is 0.3 for the case of an early start, and 0.65 for a late start, thus to fully compensate the higher attack rate, prioritizing high risk groups in strategy must result in a significantly lower mortality.
Time duration to develop immunity after vaccination
Ignoring the time duration needed to develop immunity decreased the attack rates significantly, in some cases by 8 even for the best strategy. This shows the importance of incorporating this time period into our model, otherwise the attack rates are seriously underestimated.
Applicability of the model
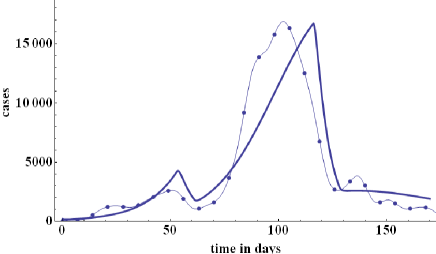
To illustrate the applicability of our approach, we fitted the model to the Hungarian data of the first wave of A(H1N1)v. The epidemic curve was reconstructed using the public reports of the National Center for Epidemiology (www.oek.hu). For the simulation, we fixed the epidemiological parameters as in Table 1, employed publicly available vaccination data (www.jarvany.hu) and performed a grid search with respect to the basic reproduction number and the reduction of contacts during holidays to find the best fit by means of ordinary least square method. The result can be seen on Figure 8, where day 1 corresponds to September 1 and . The immunizations started on day 29, but with very low intensity first. The intensity increased only in a later phase of the outbreak. In Hungary, roughly 30 of the population received the vaccine in a three months period. The decrease in cases after day 50 is due to a one week national school holiday. Note that we included this very preliminary figure solely for the sake of illustration, to demonstrate the applicability of our model in a real life situation, a more comprehensive and thorough epidemiological analysis of the Hungarian data is in progress, which is beyond the scope of this study.
6. Conclusions
We have extended an established age structured mathematical population model of influenza transmission, incorporating the interplay between the vaccination campaign and the dynamics of the outbreak. The model has allowed us to compare various age specific scheduling strategies for the overall attack rate, age specific attack rates and number of fatal cases. We found that if 60% coverage is targeted within each age group, the best scheduling scheme (i.e. prioritizing age groups according to the number of social contacts) can reduce the overall attack rate by 5-10 % and mortality by up to 30 relative to the worst strategy, depending on the delay in start of vaccination. Previous studies suggest that this can be further optimized by allocating more vaccines to young age groups, however the scope of our study was to examine the significance of the age specific timing in the schedule, without changing the overall coverage for the age groups. Our results clearly demonstrate that consideration of age specific transmission is paramount to vaccination schedule planning.
Several mathematical models have been developed to evaluate age specific vaccination strategies and the impact of timing for influenza outbreaks (Matrajt & Longini 2010, Medlock et al. 2010, Mylius et al. 2008, Sypsa et al. 2009, Tuite et al. 2010). They mostly focused on vaccine allocation (for example in Mylius et al. 2008 and Matrajt & Longini 2010, all vaccines are administered at once), while our main purpose was to explore the effect of temporal order of prioritizations. Generally, recommendations depend on the progress of the epidemic. Mylius et al. 2008 and Matrajt & Longini 2010 suggested prioritizing high risk groups if vaccine becomes available in a later phase of the epidemic, while if available early, they suggested to protect high-transmission groups. We have consistently found that the attack rates are the lowest when high-transmission groups are prioritized. However, this is most important when we start the vaccination early. For a late start and higher reproduction numbers, the differences between attack rates are much smaller. Thus, if the attack rates are similar, protecting the most vulnerable first can be a better strategy resulting lower mortality. Medlock et al. 2010 was led to a similar conclusion, hence our findings are in accordance with previous results in the literature. However, our conclusions can be viewed as a refinement of earlier results in the sense that in our model vaccines are administered continuously, and using our methodology we can easily compare the attack rates of various scheduling schemes for any delay in start of the campaign and any daily vaccine uptake. We demonstrated that, besides allocation, the scheduling of age groups itself can have a huge impact on the outcome of the epidemic, especially when vaccine is available early and the reproduction number is relatively low.
Since optimizing public health responses to this new pathogen requires difficult decisions over short timelines, a significant advantage of our approach compared to some other (stochastic, or agent based network) models in the literature is its relative simplicity. It can be easily reproduced by other researchers and adapted to the situations of various countries where the availability of vaccine will be delayed, to identify better strategies to mitigate the burden of the pandemic. Also, such strategies can be translated into a realizable public health policy. Other real life concerns, such as to protect the most vulnerable by early vaccination of high risk groups, or vaccinating health care and emergency personnel, and constraints in vaccine availability or the capacity of the health care system can be readily incorporated. Furthermore, the uncertainties involved in the parameters were assessed through a sensitivity analysis to examine whether such variation results in markedly different outcomes. The sensitivity analysis showed the robustness of our results. However, the strategy of public health authorities must be adaptive (see Chowell et al. 2009 for a Mexican case study), especially when there is a race between the spread of the infection and the vaccination campaign, and certain parameters are clarified only during the outbreak. As the mortality pattern becomes clear as the pandemic progresses, it might be necessary to switch to a different strategy to minimize the number of fatal cases.
Finally, we wish to emphasize the utmost importance of the early start of the vaccination campaign: ten days delay may cause a significant, up to 6 % increase in the overall attack rate.
Acknowledgements:
DK was supported by the Hungary-Serbia IPA Cross-border Co-operation programme, HU-SRB/0901/221/088. GR was supported by the Hungarian Research Fund grant OTKA K75517, the
Bolyai Research Scholarship of the Hungarian Academy of Sciences, and the TÁMOP-4.2.2/08/1/2008-0008 program of the Hungarian National
Development Agency. The authors are grateful for the valuable comments of the
referees, and Beatrix Oroszi for helpful discussions.
References
Alexander ME, Bowman CS, Feng Zh, Gardam M, Moghadas SM, Röst G, Wu J, Yan P 2007 Emergence of drug-resistance: implications for antiviral control of influenza pandemic P Roy Soc B - Biol Sci 274:(1619) 1675-1684
Alexander ME, Moghadas SM, Röst G, Wu J 2008 A delay differential model for pandemic influenza with antiviral treatment, Bulletin of Mathematical Biology 70(2), 382-397
Arino J, Brauer F, van den Driessche P, Watmough J, Wu, J 2006 Simple models for containment of a pandemic J R Soc Interface 3(8) 453-457
Baccam P, Beauchemin C, Macken CA, Hayden FG, Perelson AS. 2006 Kinetics of influenza A virus infection in humans J Virol 80(15):7590-9.
Balcan D et al. 2009 Seasonal transmission potential and activity peaks of the new influenza A(H1N1): a Monte Carlo likelihood analysis based on human mobility BMC Medicine 7(45) doi:10.1186/1741-7015-7-45
Basta NE, Halloran EM, Matrajt L, Longini IM Jr. 2008 Estimating Influenza Vaccine Efficacy From Challenge and Community-based Study Data, Am J Epidemiol 168(12), 1343-52
Chowell G, Ammon CE, Hengartner NW, Hyman JM 2006 Transmission dynamics of the great influenza pandemic of 1918 in Geneva, Switzerland: Assessing the effects of hypothetical interventions. J Theor Biol 241(2), 193-204
Chowell G, Miller MA, Viboud C 2007 Seasonal influenza in the United States, France and Australia: Transmission and prospects for control. Epidemiol Infect 136(06) 852–864
Chowell G, Viboud C, Wang X, Bertozzi S, Miller M, 2009, Adaptive vaccination strategies to mitigate pandemic influenza - Mexico as a case study, PLoS ONE 4(12): e8164
CDC 2009, Key Facts About Seasonal Flu Vaccine,
http://www.cdc.gov/Flu/protect/keyfacts.htm
CDC 2008, Prevention and Control of Influenza: Recommendations of the Advisory Committee on Immunization Practices (ACIP), July 17, 2008 / 57 (Early Release);1-60
Diekmann O, Heesterbeek JAP, Roberts MG, The construction of next-generation matrices for compartmental epidemic models, J R Soc Interface 7(47) 873-885
Donaldson LJ, Rutter PD, Ellis BM, Greaves FEC, Mytton OT, Pebody RG, Yardley IE, Mortality from pandemic A/H1N1 2009 influenza in England: public health surveillance study, British Medical Journal, 339, b5213, 2009.
European CDC Risk Assessment 2009, Pandemic H1N1, Version 6, 6 November 2009
Eurostat 2006, Population Statistics 2006 edition, Official Publications of the European Communities (Luxembourg)
Falus F, Oroszi B, 2009, National Chief Medical Officer’s Office, Hungary, personal communication
Ferguson NM, Cummings DA, Fraser C, Cajka JC, Cooley PC: Strategies for mitigating an influenza pandemic. 2006 Nature 442(7101):448-452.
Fleming DM, Elliot AJ 2006 Estimating the risk population in relation to influenza vaccination policy, Vaccine 24(20), 4378–4385,
Gojovic MZ, Sander B, Fisman D, Krahn MD, Bauch CT 2009 Modelling mitigation strategies for pandemic (H1N1) 2009, Can. Med. Assoc. J., 181(10):673 10.1503/cmaj.091641
Goldstein E, Apolloni A, Lewis B, Miller JC, Macauley M, Eubank S, Lipsitch M, Wallinga J 2009 Distribution of vaccine/antivirals and the least spread line in a stratified population, J R Soc Interface 7(46) 755-764
Greenberg ME, Lai MH, Hartel GF, Wichems CH, Gittleson C, Bennet J, Dawson G, Hu W, Leggio C, Washington D, Basser RL 2009 Response to a Monovalent Influenza A (H1N1) 2009 Vaccine, N Eng J Med 361(25):2405-2413
Hancock K, Veguilla V, Lu X, et al. Cross-reactive antibody responses to the 2009 pandemic H1N1 influenza virus. N Engl J Med 361(20):1945-52.
Heffernan JM, Smith RJ, Wahl LM 2005 Perspectives on the basic reproductive ratio. J R Soc Interface 2(4):281-93
Johansen K, Nicoll A, Ciancio BC, Kramarz P 2009 Pandemic influenza A(A(H1N1)v) 2009 vaccines in the European Union. Euro Surveill 14(41): pii=19361
Longini IM Jr, Halloran ME 2005 Strategy for distribution of influenza vaccine to high-risk groups and children, Am J Epidemiol 161(4), 303
Matrajt L, Longini IM 2010 Optimizing Vaccine Allocation at Different Points in Time During an Epidemic, UW Biostatistics Working Paper Series 363
Medlock J, Galvani AP 2009 Optimizing influenza vaccine distribution, Science 325(5948), 1705 - 1708
Medlock J, Meyers LA, Galvani AP 2010 Optimizing Allocation for a Delayed Influenza Vaccine Campaign, PLOS Curr Influenza, RRN1134
Merler S, Ajelli M, Rizzo C 2009 Age-prioritized use of antivirals during an influenza pandemic BMC Infectious Diseases 9:117
Miller E, Hoschler K, Hardelid P, Stanford E, Andrews N, Zambon M 2010 Incidence of 2009 pandemic influenza A H1N1 infection in England: a cross-sectional serological study, The Lancet 375(9720):1100-1108
Moghadas SM, Bowman CS, Röst G, Wu J 2008 Population-wide emergence of antiviral resistance during pandemic influenza, PLOS ONE 3(3) e1839
Moghadas SM, Bowman CS, Röst G, Fisman D, Wu J 2009 Post-exposure prophylaxis during pandemic outbreaks, BMC Medicine, 3(73)
Moghadas S, Day T, Bauch C, Driedger SM, Brauer F, Greer AL, Yan P, Wu J, Pizzi N, Fisman DN 2009 Modelling an influenza pandemic: a guide for the perplexed, Can. Med. Assoc. J., August 4, 2009; 181 (3-4), 171-3
Mossong J, Hens N, Nit M et al. 2008 Social contacts and mixing patterns relevant to the spread of infectious diseases, PLOS Medicine, 5(3):e74
Mylius SD, Hagenaars TJ, Lugnér AK, Wallinga J 2008 Optimal Allocation of Pandemic Influenza Vaccine Depends on Age, Risk and Timing, Vaccine, 26, 3742-3749
Nichol KL, Efficacy/clinical effectiveness of inactivated influenza virus vaccines in adults 1998, In: Nicholson KG, Webster RG, Hay AJ, editors. Textbook of influenza. Malden, MA: Blackwell Science Ltd., 1998:358 -72
Nishiura H, Iwata K 2009 A simple mathematical approach to deciding the dosage of vaccine against pandemic H1N1 influenza. Euro Surveill 14(45) pii=19396
Presanis AM, De Angelis D, Hagy A, Reed C, Riley S, et al. 2009 The Severity of Pandemic H1N1 Influenza in the United States, from April to July 2009: A Bayesian Analysis. PLoS Med 6(12): e1000207
Robinson R, A(H1N1)v vaccine products and production, ACIP July 2009 meeting, www.cdc.gov/vaccines/recs/acip/downloads/mtg-slides-jul09-flu/05-Flu-Robinson.pdf
Serfling RE, Sherman IL, Houseworth WJ 1967 Excess pneumonia-influenza mortality by age and sex in three major influenza A2 epidemics, United States, 1957-58, 1960 and 1963. Am J Epidemiol 86(2):433-41.
Sypsa V, Pavlopoulou I, Hatzakis A 2009 Use of an Inactivated Vaccine in Mitigating Pandemic Influenza A(H1N1) Spread: A Modelling Study to Assess the Impact of Vaccination Timing and Prioritisation Strategies, Euro Surveill, 2009:14(41):pii=19356
Tuite AR, Fisman DN, Kwong JC, Greer AL 2010 Optimal Pandemic Influenza Vaccine Allocation Strategies for the Canadian Population, PLOS ONE, 5(5):e10520.
Tuite AR, Greer AL, Whelan M, Winter AL, Lee B, Yan P, Wu J, Moghadas SM, Buckeridge D, Pourbohloul B, Fisman DN 2009 Estimated epidemiologic parameters and morbidity associated with pandemic H1N1 influenza, Can Med Assoc J 182(2):131
Vaillant L, La Ruche G, Barboza P, for the epidemic intelligence team at InVS. Epidemiology of fatal cases associated with pandemic H1N1 influenza 2009. Euro Surveill 14(33):pii=19309
Vajo Z, Wood J, Kosa, Szilvasy I, Paragh Gy, Pauliny Zs, Bartha K, Visontay I, Kis A, Jankovics I 2009 A single-dose influenza A (H5N1) vaccine safe and immunogenic in adult and elderly patients - an approach to pandemic vaccine development J Virol 84(3):1237-1242
Yang Y, Sugimoto JD, Halloran ME, Basta NE, Chao DL, Matrajt L, Potter G, Kenah E, Longini Jr IM 2009 The transmissibility and control of pandemic influenza A (H1N1) virus, 2009 Science, 326(5953):729-33