11email: {jbj|oby}@cs.tu-berlin.de
Elkan’s k-Means for Graphs
Abstract
This paper extends k-means algorithms from the Euclidean domain to the domain of graphs. To recompute the centroids, we apply subgradient methods for solving the optimization-based formulation of the sample mean of graphs. To accelerate the k-means algorithm for graphs without trading computational time against solution quality, we avoid unnecessary graph distance calculations by exploiting the triangle inequality of the underlying distance metric following Elkan’s k-means algorithm proposed in [5]. In experiments we show that the accelerated k-means algorithm are faster than the standard k-means algorithm for graphs provided there is a cluster structure in the data.
1 Introduction
The k-means algorithm is a popular clustering method because of its simplicity and speed. The algorithmic formulation of k-means as well as the solutions of its cluster objective presuppose the existence of a sample mean. Since the concept of sample mean is well-defined for vector spaces only, application of the k-means algorithm has been limited to patterns represented by feature vectors. But often, the objects we want to cluster have no natural representation as feature vectors and are more naturally represented by finite combinatorial structures such as, for example, point patterns, strings, trees, and graphs arising from diverse application areas like proteomics, chemoinformatics, and computer vision.
For combinatorial structures, pairwise clustering algorithms are one of the most widely used methods to partition a given sample of patterns, because they can be applied to patterns from any distance space without any additional mathematical structure. Related to k-means, the k-medoids algorithm is a well-known alternative that can also be applied to patterns from an arbitrary distance space. The k-medoids algorithm operates like k-means, but replaces the concept of mean by the set median of a cluster [23]. With the emergence of the generalized median [18, 6] and sample mean of graphs [13, 14], variants of the k-means algorithm have been extended to the domain of graphs [13, 6, 14].
In an unmodified form, however, pairwise clustering, k-medoids as well as the extended k-means algorithm are slow in practice for large datasets of graphs. The main obstacle is that determining a graph distance is well known to be a graph matching problem of exponential complexity. But even if we resort to graph matching algorithms that approximate graph distances in polynomial time, application of clustering algorithms for large datasets of graphs is still hindered by their prohibitive computational time.
For pairwise clustering, the number of NP-hard graph distance calculations depends quadratically on the number of the input patterns. In the worst-case, when almost all patterns are in one cluster, k-medoids also has quadratic complexity in the number of distance calculations. If the graph patterns are uniformly distributed in clusters, k-medoids requires graph distance calculations, where is the number of iterations required. For k-means, we require graph distance calculations at each iteration in order to assign pattern graphs to their closest centroids. Recomputing the centroids requires additional graph distance calculations. In the best case, when using the incremental arithmetic mean method [15] for approximating a sample mean, graph distance calculations at each iteration are necessary to recompute the centroids. This gives a total of graph distance calculations, where is the number of iterations required. In view of the exponential complexity of the graph matching problem, reducing the number of distance calculations in order to make k-means for graphs applicable is imperative.
In this contribution, we propose an accelerated version of k-means for graphs by extending Elkan’s method [5] from vector to graphs. For this we assume that the underlying graph distance is a metric. To avoid computationally expensive graph distance calculations, we exploit the triangle inequality by keeping track of upper and lower bounds between input graphs and centroids.
The k-means algorithm for graphs generalizes the standard k-means algorithm for vectors. Regarding feature vectors as graphs consisting of a single attributed node, k-means for graphs coincides with k-means for vectors. The proposed accelerated version of k-means for graphs has the following properties: First, based on the -space framework, accelerated k-means can be applied to finite combinatorial structures other than graphs like, for example, point patterns, sequences, trees, and hypergraphs. For sake of concreteness, we restrict our attention exclusively to the domain of graphs. Second, any initialization method that can be used for k-means for graphs can also be used for the Elkan’s k-means for graphs. Third, k-means for graphs and its accelerated version perform comparable with respect to solution quality. Different solutions are due to the approximation errors of the graph matching algorithm and the non-uniqueness of the sample mean of graphs but are not caused by the mechanisms to accelerate the clustering algorithm.
The paper is organizes as follows. Section 2 briefly describes the standard k-Means algorithm for vectors. Section 3 extends the standard k-means from vectors to graphs. Section 4 introduces Elkan’s k-means algorithm for graphs. Experimental results are presented and discussed in Section 5. Finally, Section 6 concludes with a summary of the main results and future work.
2 The k-Means Algorithm for Euclidean Spaces
This section describes k-means for vectors [24] in order to point out commonalities and differences with k-means for graphs.
Suppose that we are given a training sample of vectors drawn from the Euclidean space . A partition of into disjoint subsets (clusters) is determined by a -membership matrix satisfying the constraints
The standard k-means clustering algorithm aims at finding centroids and a partition of the set such that the cluster objective
is minimized.
Suppose that we fix an arbitrary membership matrix . Then the cluster objective given and is differentiable as a function of the centroids . The centroids that minimize are the sample means
of the clusters consisting of data points assigned to centroid . Since the sample mean centroids together with the given membership matrix yields a local minimum of the cluster objective only, the challenging task of minimizing consists in finding an optimal membership matrix. Since this problem is NP-complete [7], several heuristic algorithms have been devised. A standard clustering heuristic that minimizes is the k-means algorithm as outlined in Algorithm 2. The notation used in Algorithm 2 denotes the cluster associated with centroid .
Algorithm 1 (K-Means Algorithm for Euclidean Spaces)
01 choose initial centroids
02 repeat
03 assign each to its closest centroid
04 recompute each centroid as the mean of all vectors from
05 until some termination criterion is satisfied
3 The k-Means Algorithm for Graphs
To extend k-means from the domain of feature vectors to the domain of graphs, two modifications are necessary [13, 14]: First, we replace the Euclidean metric by a graph metric. Second, we replace the sample mean of vectors by a related concept for graphs.
3.1 Metric Graph Spaces
In principle, we can substitute any graph metric into the standard k-means algorithm in order to obtain its structural counterpart. Here, we focus on geometric graph distances that are related to the Euclidean metric, because the Euclidean metric is the underlying metric of the vectorial mean. The vectorial mean in turn provides a link to deep results in probability theory and is the foundation for a rich repository of analytical tools in pattern recognition. To access at least parts of these results, it seems to be reasonable to relate graph metrics to the Euclidean metric. This restriction is acceptable from an application point of view, because geometric distance functions on graphs and their related similarity functions are a common choice of proximity measure [1, 3, 8, 10, 25, 27].
Though it is straightforward to define a graph metric, which is related to the Euclidean metric of vectors, we first make a detour via the concept of -space in order to approach the sample mean of graphs in a principled way.
Let be a -dimensional Euclidean vector space. An (attributed) graph is a triple consisting of a finite nonempty set of vertices, a set of edges, and an attribute function , such that for each edge and for each non-edge. Attributes of vertices may take any value from .
For simplifying the mathematical treatment, we assume that all graphs are of order , where is chosen to be sufficiently large. Graphs of order less than , say , can be extended to order by including isolated vertices with attribute zero. For practical issues, it is important to note that limiting the maximum order to some arbitrarily large number and extending smaller graphs to graphs of order are purely technical assumptions to simplify mathematics. For machine learning problems, these limitations should have no practical impact, because neither the bound needs to be specified explicitly nor an extension of all graphs to an identical order needs to be performed. When applying the theory, all we actually require is that the graphs are finite.
A graph is completely specified by its matrix representation with elements for all . By concatenating the columns of , we obtain a vector representation of .
Let be the Euclidean space of all ()-matrices and let denote a subset of the set of all -permutation matrices. Two matrices and are said to be equivalent, if there is a permutation matrix such that . The quotient set
is the -space over the representation space . A -space is a relaxation of the set of all abstract graphs , where is a matrix representation of graph .
In the remainder of this contribution, we identify with () and consider vector- rather than matrix representations of abstract graphs. By abuse of notation, we sometimes identify with and write instead of .
Finally, we equip a -space with a metric related to the Euclidean metric. Suppose that is an Euclidean metric on induced by some inner product. Then the distance function
is a metric with the same geometric properties as . A pair of vector representations is called optimal alignment if .
Calculating a Graph Metric.
Here, we assume that is equal to the set of all of all -permutation matrices. Determining a graph distance and finding an optimal alignment of and are equivalent problems that are more generally referred to as a graph matching problem. In contrast to calculating the Euclidean distance between vectors, computing is a NP-complete problem [8]. Devising graph matching algorithms for computing has become a mature field in structural pattern recognition that has produced various powerful and efficient solutions to the graph matching problem [2]. To extend k-means to the graph domain any of those algorithms can be used.
3.2 The Sample Mean of Graphs
Given the metric space , we introduce the sample mean of graphs and provide some results proved in [14].
Suppose that is a sample of abstract graphs from . A sample mean of is any solution of the optimization problem
The cost function is the sum of squared distances (SSD) to the sample graphs. Here, the problem is to find a solution from an uncountable infinite set . A simpler problem is to restrict the set of feasible solutions to the finite sample . A set mean graph of is defined by
We summarize the most important results from [14] for deriving subgradient-based algorithms for solving problem ().
Theorem 3.1
Let be a sample of abstract graphs.
-
1.
Problem () has a solution. The solutions are abstract graphs from .
-
2.
The SSD function is locally Lipschitz.
-
3.
A vector representation of a sample mean of is of the form
where for all . We call the vector representations an optimal multiple alignment of .
-
4.
Let be an optimal multiple alignment of . Then
for all vector representations .
The first statement ensures that problem () can be solved and has feasible solutions. Since the SSD satisfies the locally Lipschitz condition according to the second statement, we can apply generalized gradient techniques from nonsmooth optimization for minimizing the SSD [19]. The third statement shows that a vector representation of a structural sample mean is the standard sample mean of certain vector representations of the sample graphs. In addition, we see that problem () is a discrete rather than a continuous optimization problem, where a solution can be chosen from the finite set . The latter property combined with the fourth statement can be exploited for constructing search algorithms or meta-heuristics like genetic algorithms. The fourth statement asks for maximizing the sum of pairwise similarities (SPS). The standard sample mean of a vector representation maximizing the SPS is a vector representation of a structural sample mean. Apart from this, the fourth property provides a geometric characterization stating that an optimal multiple alignment has minimal volume within the subspace spanned by the vector representations. In the case that is derived from the maximum common subgraph problem, the fourth property says that an optimal multiple alignment maximizes the sum of common edges of the sample graphs. This in turn indicates that computation of the sample mean has potential applications in frequent substructure mining.
A Subgradient Method for Approximating a Sample Mean.
So far, we have defined a concept of sample mean for graphs. For practical applications, we need an efficient procedure to minimize problem () in order to recompute the centroids of the k-means algorithm for graphs. For this, we assume that is a sample of graphs.
Generic Subgradient Method.
Suppose that we want to minimize a locally Lipschitz function on . Then admits a generalized gradient at each point. The generalized gradient coincides with the gradient at differentiable points and is a convex set of points, called subgradients, at non-differentiable points. The basic idea of subgradient methods is to generalize the methods for smooth problems by replacing the gradient by an arbitrary subgradient. Algorithm 1 outlines the basic procedure of a generic subgradient method.
At differentiable points, direction finding generates a descent direction by exploiting the fact that the direction opposite to the gradient of is locally the steepest descent direction. At non-differentiable points, direction finding amounts in generating an arbitrary subgradient. The problem is that a subgradient at a non-differentiable point is not necessarily a direction of descent. But according to Rademacher’s Theorem, the set of non-differentiable points is a set of Lebesgue measure zero. Line search determines a step size with which the current solution is moved along direction in the updating step. Subgradient methods use predetermined step sizes , instead of some efficient univariate smooth optimization method or polynomial interpolation as in gradient descent methods. One reason for this is that a subgradient determined in the direction finding step is not necessarily a direction of descent. Thus, the viability of subgradient methods depend critically on the sequence of step sizes. Updating moves the current solution to the next solution . Since the subgradient method is not a descent method, it is common to keep track of the best point found so far, i.e., the one with smallest function value. For more details on subgradient methods and more advanced techniques to minimize locally Lipschitz functions, we refer to [19].
Algorithm 2 (Generic Subgradient Method)
01 set and choose starting point
02 repeat
03 Direction finding:
04 determine and such that
05 Line search:
06 find step size such that
07 Updating:
08 set
09 set
10 until some termination criterion is satisfied
Several different subgradient methods for approximating a sample mean have been suggested [15]. For extending k-means to the domain of graphs, we have chosen the incremental arithmetic mean (IAM) method. In an empirical comparison of different subgradient methods [15], IAM performed best with respect to computation time and was ranked third with respect to solution quality. In addition, IAM best trades computation time and solution quality. For this reason, we consider IAM as a good candidate for recomputing the centroids of the k-means clusters.
IAM – Incremental Arithmetic Mean.
The elementary incremental subgradient method randomly chooses a sample graph from at each iteration and updates the estimates of the vector representations of a sample mean according to the formula
where is the step size and is an optimal alignment.
As a special case of the incremental subgradient algorithm, the incremental arithmetic mean method emulates the incremental calculation of the standard sample mean. First the order of the sample graphs from is randomly permuted. Then a sample mean is estimates according to the formula
where are optimal alignments for all . The graph represented by the vector is an approximation of a sample mean of . In general, is not an optimal solution of problem . This procedure is inspired by Theorem 1.3 and requires only one iteration through the sample. The IAM method requires distance calculations for approximating a sample mean. The solution quality depends on the order of selecting the sample graphs from .
3.3 The k-Means Algorithm for Graphs
Having a graph metric and a concept of sample mean, we are now in the position, to extend the k-means algorithm to structure spaces over some Euclidean space . We assume that is a distance metric induced by an Euclidean metric on . Now suppose that is a training sample of graphs drawn from . We replace the standard cluster objective by
where is a set of centroids from and is a membership matrix defining a partition of the set .
Given a membership matrix , the cluster objective is no longer differentiable as a function of the centroids . But as shown in [14, 15], the objective is locally Lipschitz and therefore differentiable as a function of for almost all graphs. The centroids that minimize the cluster objective are the structural versions of the sample mean
Hence, we can easily extend Algorithm 2 to minimize the cluster objective . Algorithm 3.3 describes the basic procedure of the k-means algorithm for structure spaces independent of the particular choice of method to minimize the objective of a sample mean. Similarly as for vectors, denotes the cluster associated with centroid .
Algorithm 3 (K-Means Algorithm for Structure Spaces)
01 choose initial centroids
02 repeat
03 assign each to its closest centroid
04 recompute each as a sample mean of all graphs from
05 until some termination criterion is satisfied
In each iteration of the structural version of k-means requires distance calculations to assign each pattern graph to a centroid and at least additional distance calculations for recomputing the centroids using the incremental arithmetic mean subgradient method. This gives a total of at least distance calculations in each iteration of Algorithm 3.3.
4 Elkan’s k-Means for Graphs
In this section we extend Elkan’s k-means [5] from vectors to graphs.
Algorithm 4 (Elkan’s k-Means Algorithm for Structure Spaces)
01 choose set of initial centroids
02 set for all and for all
03 set for all
04 randomly assign each to a centroid
05 repeat
06 compute for all centroids
07 for each and do
08 if is a candidate centroid for
09 if is out-of-date
10 update
11 update
12 if is a candidate centroid for
13 update
14 if
15 update
16 replace
17 recompute mean of cluster for all
18 compute for all
19 set for all
20 set for all and for all
21 replace by for all
22 until some termination criterion is satisfied.
Remark:
-
1.
Setting the value a variable such as and implicitly declares the value of that variable as out-of-date. Updating those variables declares the value as up-to-date.
-
2.
The condition in line 08 and 12 is only redundant if the upper bound is up-to-date.
Frequent evaluation of NP-hard graph distances dominates the computational cost of k-means for graphs. Accelerating k-means therefore aims at reducing the number of graph distance calculations. In [5], Elkan suggested an accelerated formulation of the standard k-means algorithm for vectors exploiting the triangle inequality of the underlying distance metric. Since the distance function on induced by an Euclidean metric is also a metric [16], we can transfer Elkan’s k-Means acceleration from Euclidean spaces to -spaces.
To extend Elkan’s k-Means acceleration to -spaces, we assume that is a pattern graph and are centroids. As before, by we denote the centroid the pattern graph is assigned to. Elkan’s acceleration is based on two observations:
-
1.
From the triangle inequality of a metric follows
(1) where denotes an upper bound of the distance .
-
2.
We have
(2) where denotes a lower bound of the distance .
As an immediate consequence, we safely can avoid to calculate a distance between a pattern graph and an arbitrary centroid if at least one of the following conditions is satisfied
We say, is a candidate centroid for if all conditions - are violated. Conversely, if is not a candidate centroid for , then either condition or condition is satisfied. From the inequalities (1) and (1) follows that can not be a centroid closest to . Therefore, it is not necessary to calculate the distance . In the case that is the onliest candidate centroid for all distance calculations with can be skipped and must remain assigned to .
Now suppose that is a candidate centroid for . Then we apply the technique of "delayed (distance) evaluation". We first test whether the upper bound is out-of-date, i.e. if . If is out-of-date we improve the upper bound by setting . Since improving might eliminate as being a candidate centroid for , we again check conditions and . If both conditions are still violated despite the updated upper bound , we have the following situation
Since the distances on the left and right hand side of the inequality of condition are known, we may conclude that the situation for condition can not be altered. Therefore, we re-examine condition by calculating the distance and updating the lower bound . If condition is still violated, we have
This implies that is closer to centroid than to and therefore has to be assigned to centroid .
Crucial for avoiding distance calculations are good estimates of the lower and upper bounds and in each iteration. For this, we compute the change of each centroid by the distance
where is the recomputed centroid of cluster . Based on the triangle inequality, we set the bounds according to the following rules
| (3) | ||||
| (4) |
In addition, is then declared as out-of-date.111In the original formulation of Elkan’s algorithm for feature vectors, the upper bounds are declared as out-of-date regardless of the value . Both rules guarantee that is always a lower bound of and is always an upper bound of .
Algorithm 4 presents a detailed description of Elkan’s k-means algorithm for graphs. During each iteration, pairwise distances between all centers must be recomputed (Algorithm 4, line 07). Recomputing the centroids using incremental arithmetic mean (see Section 3.2) requires additional distance calculations (Algorithm 4, line 19-20). To update the lower and upper bounds, distances between the current and the new centroids must be calculated (Algorithm 4, line 21-25). This gives a minimum of distance calculations at each iteration ignoring the delayed distance evaluations in line 09-18 of Algorithm 4. As the centroids converge, one would expect that the partition of the training sample becomes more and more stable, which results in a decreasing number of delayed distance evaluations.
5 Experiments
| data set | #(graphs) | #(classes) | avg(nodes) | max(nodes) | avg(edges) | max(edges) |
|---|---|---|---|---|---|---|
| letter | 750 | 15 | 4.7 | 8 | 3.1 | 6 |
| grec | 528 | 22 | 11.5 | 24 | 11.9 | 29 |
| fingerprint | 900 | 3 | 8.3 | 26 | 14.1 | 48 |
| molecules | 100 | 2 | 24.6 | 40 | 25.2 | 44 |
This section reports the results of running k-means and Elkan’s k-means on four graph data sets.
5.1 Data.
We selected four data sets described in [22]. The data sets are publicly available at [11]. Each data set is divided into a training, validation, and a test set. In all four cases, we considered data from the test set only. The description of the data sets are mainly excerpts from [22]. Table 1 provides a summary of the main characteristics of the data sets.
Letter Graphs.
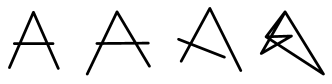
We consider all graphs from the test data set representing distorted letter drawings from the Roman alphabet that consist of straight lines only (A, E, F, H, I, K, L, M, N, T, V, W, X, Y, Z). The graphs are uniformly distributed over the classes (letters). The letter drawings are obtained by distorting prototype letters at low distortion level. Lines of a letter are represented by edges and ending points of lines by vertices. Each vertex is labeled with a two-dimensional vector giving the position of its end point relative to a reference coordinate system. Edges are labeled with weight . Figure 1 shows a prototype letter and distorted version at various distortion levels.
GREC Graphs.
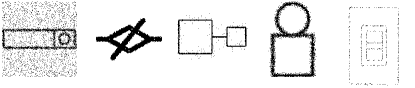
The GREC data set [4] consists of graphs representing symbols from architectural and electronic drawings. We use all graphs from the test data set uniformly distributed over classes. The images occur at five different distortion levels. In Figure 2 for each distortion level one example of a drawing is given. Depending on the distortion level, either erosion, dilation, or other morphological operations are applied. The result is thinned to obtain lines of one pixel width. Finally, graphs are extracted from the resulting denoised images by tracing the lines from end to end and detecting intersections as well as corners. Ending points, corners, intersections and circles are represented by vertices and labeled with a two-dimensional attribute giving their position. The vertices are connected by undirected edges which are labeled as line or arc. An additional attribute specifies the angle with respect to the horizontal direction or the diameter in case of arcs.
Fingerprint Graphs.
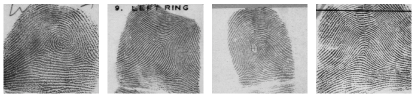
We consider a subset of graphs from the test data set representing fingerprint images of the NIST-4 database [26]. The graphs are uniformly distributed over three classes left, right, and whorl. A fourth class (arch) is excluded in order to keep the data set balanced. Fingerprint images are converted into graphs by filtering the images and extracting regions that are relevant [21]. Relevant regions are binarized and a noise removal and thinning procedure is applied. This results in a skeletonized representation of the extracted regions. Ending points and bifurcation points of the skeletonized regions are represented by vertices. Additional vertices are inserted in regular intervals between ending points and bifurcation points. Finally, undirected edges are inserted to link vertices that are directly connected through a ridge in the skeleton. Each vertex is labeled with a two-dimensional attribute giving its position. Edges are attributed with an angle denoting the orientation of the edge with respect to the horizontal direction. Figure 3 shows fingerprints of each class.
Molecules.
The mutagenicity data set consists of chemical molecules from two classes (mutagen, non-mutagen). The data set was originally compiled by [17] and reprocessed by [22]. We consider a subset of molecules from the test data set uniformly distributed over both classes. We describe molecules by graphs in the usual way: atoms are represented by vertices labeled with the atom type of the corresponding atom and bonds between atoms are represented by edges labeled with the valence of the corresponding bonds. We used a -to- binary encoding for representing atom types and valence of bonds, respectively.
5.2 General Experimental Setup
In all experiments, we applied standard k-means for graphs (std) and Elkan’s k-means for graphs (elk) to the aforementioned data sets using the following experimental setup:
Setting of k-means algorithms.
To initialize the k-means algorithms, we used a modified version of the "furthest first" heuristic [9]. For each data set , the first centroid is initialized to be a graph closest to the sample mean of . Subsequent centroids are initialized according to
where is the set of the first centroids chosen so far. We terminated each k-means algorithm after iterations without improvement of the cluster objective .
Graph distance calculations and optimal alignment.
For graph distance calculations and finding optimal alignments, we applied a depth first search algorithm on the letter data set and the graduated assignment [8] on the grec, fingerprint, and molecule data set. The depth first search method guarantees to return optimal solutions and therefore can be applied to small graphs only. Graduated assignment returns approximate solutions.
Performance measures.
We used the following measures to assess the performance of an algorithm on a dataset: (1) error (value of the cluster objective ), (2) classification accuracy, (3) silhouette index, and (4) number of graph distance calculations.
The silhouette index is a cluster validation index taking values from . Higher values indicate a more compact and well separated cluster structure. For more details we refer to Appendix 0.A and [24]. Elkan’s k-means and graph-vector reduction k-means incur computational overhead to create and update auxiliary data structures and to compute Euclidean distances. This overhead is negligible compared to the time spent on graph distance calculations. Therefore, we report number of graph distance calculations rather than clock times as a performance measure for speed.
5.3 Performance Comparison
| data set | k | measure | std | elk |
|---|---|---|---|---|
| letter | 30 | |||
| error | 11.6 | 11.5 | ||
| accuracy | 0.86 | 0.86 | ||
| silhouette | 0.38 | 0.39 | ||
| iterations | 21 | 13 | ||
| matchings | ||||
| per iteration | 23.2 | 3.3 | ||
| total | 488.4 | 42.5 | ||
| speedup | ||||
| per iteration | 1.0 | 7.1 | ||
| total | 1.0 | 11.5 | ||
| grec | 33 | |||
| error | 32.7 | 32.2 | ||
| accuracy | 0.84 | 0.83 | ||
| silhouette | 0.40 | 0.44 | ||
| iterations | 11 | 11 | ||
| matchings | ||||
| per iteration | 18.0 | 5.7 | ||
| total | 197.5 | 63.1 | ||
| speedup | ||||
| per iteration | 1.0 | 3.1 | ||
| total | 1.0 | 3.1 | ||
| fingerprint | 60 | |||
| error | 1.88 | 1.70 | ||
| accuracy | 0.81 | 0.82 | ||
| silhouette | 0.32 | 0.31 | ||
| iterations | 10 | 11 | ||
| matchings | ||||
| per iteration | 54.9 | 4.8 | ||
| total | 549 | 52.4 | ||
| speedup | ||||
| per iteration | 1.0 | 11.5 | ||
| total | 1.0 | 10.5 | ||
| molecules | 10 | |||
| error | 27.6 | 27.2 | ||
| accuracy | 0.69 | 0.70 | ||
| silhouette | 0.03 | 0.04 | ||
| iterations | 13 | 13 | ||
| matchings | ||||
| per iteration | 1.1 | 1.1 | ||
| total | 14.3 | 14.5 | ||
| speedup | ||||
| per iteration | 1.0 | 0.94 | ||
| total | 1.0 | 0.94 |
We applied standard k-means (std) and Elkan’s k-means (elk) to all four data sets in order to assess and compare their performance. The number of centroids as shown in Table 2 was chosen by compromising a satisfactory classification accuracy against the silhouette index. For each data set runs of each algorithm were performed and the best cluster result selected.
Table 2 summarizes the results. The first observation to be made is that the solution quality of std and elk is comparable with respect to error, classification accuracy, and silhouette index. Deviations are due to the non-uniqueness of the sample mean and the approximation errors of the graduated assignment algorithm. The second observation to be made from Table 2 is that elk outperforms std with respect to computation time on the letter, grec, and fingerprint data set. On the molecule data set, std and elk have comparable speed performance. Remarkably, elk requires slightly more distance calculations than std.
Contrasting the silhouette index and the dimensionality of the data to the speedup factor gained by elk, we make the following observation: First, the silhouette index for the letter, grec, and fingerprint data set are roughly comparable and indicate a cluster structure in the data, whereas the silhouette index for the molecule data set indicates almost no compact and homogeneous cluster structure. Second, the dimensionality of the vector representations is largest for molecule graphs, moderate for grec graphs, and relatively low for letter and fingerprint graphs. Thus, the speedup factor of elk and gvr apparently decreases with increasing dimensionality and decreasing cluster structure. This behavior is in line with findings in high-dimensional vector spaces [5]. According to [20], there will be little or no acceleration in high dimensions if there is no underlying structure in the data. This view is also supported by theoretical results from computational geometry [12].
5.4 Speedup vs. Number of Centroids
| data set | k | measure | std | elk |
|---|---|---|---|---|
| letter | 4 | |||
| (A, E, F, H) | error | 6.9 | 7.0 | |
| accuracy | 0.61 | 0.60 | ||
| silhouette | 0.26 | 0.25 | ||
| iterations | 14 | 15 | ||
| matchings | ||||
| per iteration | 10.0 | 4.4 | ||
| total | 140.0 | 65.5 | ||
| speedup | ||||
| per iteration | 1.0 | 2.3 | ||
| total | 1.0 | 2.1 | ||
| letter | 8 | |||
| (A, E, F, H) | error | 4.2 | 4.2 | |
| accuracy | 0.82 | 0.82 | ||
| silhouette | 0.30 | 0.30 | ||
| iterations | 13 | 14 | ||
| matchings | ||||
| per iteration | 18.0 | 5.1 | ||
| total | 234.0 | 71.3 | ||
| speedup | ||||
| per iteration | 1.0 | 3.5 | ||
| total | 1.0 | 3.3 | ||
| letter | 12 | |||
| (A, E, F, H) | error | 2.7 | 2.7 | |
| accuracy | 0.94 | 0.94 | ||
| silhouette | 0.31 | 0.30 | ||
| iterations | 16 | 18 | ||
| matchings | ||||
| per iteration | 26.0 | 5.5 | ||
| total | 416 | 98.7 | ||
| speedup | ||||
| per iteration | 1.0 | 4.2 | ||
| total | 1.0 | 4.7 | ||
| letter | 16 | |||
| (A, E, F, H) | error | 2.4 | 2.4 | |
| accuracy | 0.94 | 0.94 | ||
| silhouette | 0.22 | 0.23 | ||
| iterations | 16 | 16 | ||
| matchings | ||||
| per iteration | 34.0 | 6.7 | ||
| total | 544.0 | 107.8 | ||
| speedup | ||||
| per iteration | 1.0 | 5.0 | ||
| total | 1.0 | 6.1 |
| data set | k | measure | std | elk |
|---|---|---|---|---|
| fingerprints | 3 | |||
| error | 41.3 | 41.5 | ||
| accuracy | 0.59 | 0.59 | ||
| silhouette | 0.20 | 0.21 | ||
| iterations | 7 | 7 | ||
| matchings | ||||
| per iteration | 12.0 | 9.5 | ||
| total | 84.0 | 66.8 | ||
| speedup | ||||
| per iteration | 1.0 | 1.3 | ||
| total | 1.0 | 1.3 | ||
| fingerprints | 15 | |||
| error | 8.1 | 6.8 | ||
| accuracy | 0.64 | 0.64 | ||
| silhouette | 0.32 | 0.33 | ||
| iterations | 10 | 9 | ||
| matchings | ||||
| per iteration | 48.0 | 15.4 | ||
| total | 480.0 | 138.4 | ||
| speedup | ||||
| per iteration | 1.0 | 3.1 | ||
| total | 1.0 | 3.5 |
In this experiment we investigate how the speedup factor of elk depends on the number of centroids. For this, we restricted to subsets of the letter and fingerprint data sets. We selected graphs uniformly distributed over the four classes A, E, F, and H. From the fingerprint data set we compiled a subset of graphs uniformly distributed over all three classes. For each chosen number of centroids runs of each algorithm were conducted and the average of all performance measures was taken. The number is shown in Table 3 for letter graphs and Table 4 for fingerprints graphs.
From the results shown in Table 3 and 4, we see that the speedup factor slowly increases with increasing number of centroids. The results confirm that std and elk perform comparable with respect to solution quality for varying . As an aside, all k-means algorithms for graphs exhibit a well-behaved performance in the sense that subgradient methods applied to the nonsmooth cluster objective indeed minimize in a reasonable way as shown by the decreasing error for increasing .
6 Conclusion
We extended Elkan’s k-means from vectors to graphs. Elkan’s k-means exploits the triangle inequality to avoid graph distance calculations. Experimental results show that standard and Elkan’s k-means for graphs perform equally with respect to solution quality, but Elkan’s k-means outperforms standard k-means with respect to speed if there is a cluster structure in the data. The speedup factor of both accelerations increases slightly with the number of centroids. This contribution is a first step in accelerating clustering algorithms that directly operate in the domain of graphs. Future work aims at accelerating incremental clustering methods.
Appendix 0.A The Silhouette Index
Suppose that is a sample of patterns. Let be a partition of consisting of disjoint clusters with
We assume that is the underlying distance function defined on . The distance between two subsets is defined by
If consists of a singleton, we simply write instead of .
Let
denote the average distance between pattern and subset . Suppose that pattern is a member of cluster . By we denote the set . For each pattern let
be the average distance between pattern and subset . By
we denote the minimum average distance between pattern and all clusters from not containing . The silhouette width of is defined as
The silhouette of cluster is given by
The silhouette index is then defined as the average of all cluster silhouettes
References
- [1] H. Almohamad and S. Duffuaa, "A linear programming approach for the weighted graph matching problem", IEEE Transactions on Pattern Analysis and Machine Intelligence, 15(5)522–525, 1993.
- [2] D. Conte, P. Foggia, C. Sansone, and M. Vento, "hirty years of graph matching in pattern recognition", International Journal of Pattern Recognition and Artificial Intelligence, 18(3):265–298, 2004.
- [3] T. Cour, P. Srinivasan, and J. Shi, "Balanced graph matching", NIPS 2006 Conference Proceedings, 2006.
- [4] P. Dosch and E. Valveny, "Report on the second symbol recognition contest", GREC 2005 Conference Proceedings, p. 381- 397, 2006.
- [5] C. Elkan, "Using the triangle inequality to accelerate k-means", ICML 2003 Conference Proceedings, p. 147–153, 2003.
- [6] M. Ferrer, Theory and algorithms on the median graph. application to graph-based classification and clustering, PhD Thesis, Univ. Aut‘onoma de Barcelona, 2007.
- [7] M. Garey, D. Johnson, and H. Witsenhausen, "The complexity of the generalized Lloyd-Max problem", IEEE Trans. Inform. Theory, 28, p. 255–256, 1982.
- [8] S. Gold and A. Rangarajan, "Graduated Assignment Algorithm for Graph Matching", IEEE Trans. Pattern Analysis and Machine Intelligence, 18:377–388, 1996.
- [9] D. Hochbaum and D. Shmoys, "A best possible heuristic for the k-center problem", Mathematics of Operations Research, 10(2):180-184, 1985.
- [10] L. Holm and C. Sander, "Protein structure comparison by alignment of distance matrices", Journal of Molecular Biology, 233(1):123–38, 1993.
-
[11]
IAM Graph Database Repository of the Computer Vision and
Artificial Intelligence Research Group, University Bern, Switzerland
(accessed 2009).
URL: http://www.iam.unibe.ch/fki/databases/iam-graph-database - [12] P. Indyk, A. Amir, A. Efrat, and H. Samet, "Efficient algorithms and regular data structures for dilation, location and proximity problems", Proceedings of the Annual Symposium on Foundations of Computer Science, p. 160- 170, 1999.
- [13] B. Jain and F. Wysotzki, "Central Clustering of Attributed Graphs", Machine Learning, 56, 169–207, 2004.
- [14] B. Jain and K. Obermayer, "On the sample mean of graphs", IJCNN 2008 Conference Proceedings, p. 993-1000, 2008.
- [15] B. Jain and K. Obermayer, "Algorithms for the Sample Mean of Graphs", CAIP 2009 Conference Proceedings, 2009.
- [16] B. Jain and K. Obermayer, "Structure Spaces", Journal of Machine Learning Research, 10, 2009.
- [17] J. Kazius, R. McGuire, and R. Bursi, "Derivation and validation of toxicophores for mutagenicity prediction", Journal of Medicinal Chemistry 48(1):312- 320, 2005.
- [18] X. Jiang, X., A. Munger, and H. Bunke, "On Median Graphs: Properties, Algorithms, and Applications", IEEE Trans. PAMI, 23(10):1144–1151, 2001.
- [19] M. Mäkelä and P. Neittaanmäki, Nonsmooth Optimization: Analysis and Algorithms with Applications to Optimal Control. World Scientific, 1992.
- [20] A. Moore, "he anchors hierarchy: Using the triangle inequality to survive high dimensional data", Proceedings of the Twelfth Conference on Uncertainty in Artificial Intelligence, p. 397 -405, 2000.
- [21] M. Neuhaus and H. Bunke, "A graph matching based approach to fingerprint classification using directional variance", AVBPA 2005 Conference Proceedings, p. 191 -200, 2005.
- [22] K. Riesen and H. Bunke, "IAM Graph Database Repository for Graph Based Pattern Recognition and Machine Learning", SSPR 2008 Conference Proceedings, p. 287-297, 2008.
- [23] A. Schenker, M. Last, H. Bunke, and A. Kandel, "Clustering of web documents using a graph model", Web Document Analysis: Challenges and Opportunities, p. 1–16, 2003.
- [24] S. Theodoridis and K. Koutroumbas, Pattern Recognition, Elsevier, 4th edition, 2009.
- [25] S. Umeyama, "An eigendecomposition approach to weighted graph matching problems", IEEE Transactions on Pattern Analysis and Machine Intelligence, 10(5):695–703, 1988.
- [26] C. Watson and C. Wilson, NIST Special Database 4, Fingerprint Database, National Institute of Standards and Technology, 1992.
- [27] M. Van Wyk, M. Durrani, and B. Van Wyk, "A RKHS interpolator-based graph matching algorithm", IEEE Transactions on Pattern Analysis and Machine Intelligence, 24(7):988–995, 2002.