11email: bianchi@pha.jhu.edu, amarino@pha.jhu.edu 22institutetext: INAF Osservatorio Astronomico di Padova, vicolo dell’Osservatorio 5, I-35122 Padova, Italy
22email: daniela.bettoni@oapd.inaf.it, lucio.buson@oapd.inaf.it, roberto.rampazzo@oapd.inaf.it
Galaxy Evolution in Local Group Analogs. I.
A GALEX study of nearby groups
dominated by late-type galaxies††thanks: Based on GALEX observations (GI2-121 PI L.M. Buson)
Abstract
Context. Understanding the astrophysical processes acting within galaxy groups and their effects on the evolution of the galaxy population is one of the crucial topic of modern cosmology, as almost 60% of galaxies in the Local Universe are found in groups.
Aims. We aim at learning about galaxy evolution within nearby groups dominated by late-type galaxies, specifically by studying their ultraviolet-emitting stellar population.
Methods. We imaged in the far (FUV, = 1539 Å) and near ultraviolet (NUV, = 2316 Å) with the Galaxy Evolution Explorer (GALEX) three nearby groups, namely LGG 93, LGG 127 and LGG 225. We obtained the UV galaxy surface photometry and, for LGG 225, the only group covered by the SDSS, the photometry in u, g, r, i, z bands. We discuss galaxy morphologies looking for interaction signatures and we analyze the spectral energy distribution of galaxies to infer their luminosity–weighted ages. The UV and optical photometry was also used to perform a luminosity-weighted kinematical and dynamical analysis of each group and to evaluate the stellar mass.
Results. A few member galaxies in LGG 225 show a distorted UV morphology due to ongoing interactions. (FUV-NUV) colors suggest that spirals in LGG 93 and LGG 225 host stellar populations in their outskirts younger than that of M31 and M33 in the Local Group or with less extinction. The irregular interacting galaxy NGC 3447A has a significantly younger stellar population (few Myr old) than the average of the other irregular galaxies in LGG 225 suggesting that the encounter triggered star formation. The early-type members of LGG 225, NGC 3457 and NGC 3522, have masses of the order of a few 109 M⊙, comparable to the Local Group ellipticals. For the most massive spiral in LGG 225, we estimate a stellar mass of 4 1010 M⊙, comparable to M33 in the Local Group. Ages of stellar populations range from a few to 7 Gyr for the galaxies in LGG 225. The kinematical and dynamical analysis indicates that LGG 127 and LGG 225 are in a pre-virial collapse phase, i.e. still undergoing dynamical relaxation, while LGG 93 is likely virialized. Both the photometric and the dynamical analysis suggest that LGG 225 group is in a more active evolution phase than both LGG 93 and LGG 127.
Conclusions.
Key Words.:
Galaxies: formation – Galaxies: evolution – Galaxies: interactions – Galaxies: spiral – Ultraviolet: galaxies1 Introduction
Although the majority of galaxies ( 60%) in the local universe resides in groups (e.g. Huchra & Geller 1982; Tully 1987; Giuricin et al. 2000; Ramella et al. 2002; Eke et al. 2004; Tago et al. 2008), our knowledge of galaxy evolution in low density environments, of which groups are the defining galaxy association, is still scanty. In particular, whether a link between the elliptical-galaxy dominated and late-type galaxy dominated groups exists, i.e. whether they represent two evolutionary stages in a hierarchical cosmological framework, is still unclear.
Some important physical parameters mark the difference between the possible evolution within groups and clusters. Among them, the galaxy velocity dispersion in groups is comparable to the inner velocity dispersion of individual galaxies. Processes such as galaxy merging, and accretion e.g. of HI-rich high-velocity clouds (Zabludoff & Mulchaey 1998; Blitz et al. 1999), are much more effective in groups than in clusters. Conversely, mechanisms regulating galaxy evolution in the cluster environment, such as ram-pressure stripping (see e.g. Vollmer et al. 2002) and galaxy harassment (Moore et al. 1999), are less relevant in groups. In the group environment, galaxy encounters may then completely reshape the member’s morphology and trigger secondary star formation episodes even in early-type galaxies (see e.g. Annibali et al. 2007, and references therein) .
| Group | RA | Dec. | Morph. | RC3 | E(B-V)d | Incl. | Semi-major and | P.A.c | Mean Hel. | BT |
| Galaxies | (J2000) | (J2000) | type | type | minor axisb | Vel | ||||
| (h:m:s) | (d:m:s) | [deg] | [arcmin] | [deg] | [km/s] | (AB mag) | ||||
| LGG 93 | ||||||||||
| NGC 1249 | 03:10:01.2 | -53:20:09 | SBc | 6.0 0.3 | 0.017 | 69.0 | 2.45 1.15 | 86 | 1072 14 | 12.03 0.19 |
| NGC 1311 | 03:20:06.9 | -52:11:08 | SBm | 8.8 0.9 | 0.021 | 90.0 | 1.50 0.40 | 40 | 571 5 | 13.24 0.20 |
| IC 1933 | 03:25:39.9 | -52:47:08 | Sc | 6.1 0.7 | 0.017 | 59.4 | 1.10 0.60 | 55 | 1063 5 | 12.77 0.13 |
| IC 1954 | 03:31:31.4 | -51:54:17 | SBb | 3.2 0.8 | 0.016 | 58.0 | 1.60 0.75 | 66 | 1062 4 | 11.97 0.08 |
| IC 1959 | 03:33:12.6 | -50:24:51 | SBd | 8.4 1.5 | 0.011 | 90.0 | 1.40 0.35 | 147 | 641 5 | 13.04 0.13 |
| LGG 127 | ||||||||||
| NGC 1744 | 04:59:57.8 | -26:01:20 | SBcd | 6.7 1.4 | 0.041 | 69.9 | 4.05 2.20 | 168 | 740 6 | 11.55 0.19 |
| NGC 1792 | 05:05:14.4 | -37:58:51 | SBbc | 4.0 0.2 | 0.023 | 62.8 | 2.60 1.30 | 137 | 1207 4 | 10.60 0.13 |
| NGC 1800 | 05:06:25.7 | -31:57:15 | Sd | 8.2 3.9 | 0.014 | 47.0 | 1.00 0.55 | 113 | 806 5 | 12.96 0.05 |
| NGC 1808 | 05:07:42.3 | -37:30:47 | SABa | 1.2 0.5 | 0.030 | 83.9 | 3.25 1.95 | 133 | 1001 5 | 10.66 0.06 |
| NGC 1827 | 05:10:04.6 | -36:57:37 | SABc | 5.9 0.5 | 0.028 | 84.9 | 1.50 0.35 | 120 | 1041 7 | 13.08 0.20 |
| ESO305-009 | 05:08:07.6 | -38:18:33 | SBd | 8.0 0.4 | 0.027 | 53.0 | 1.75 1.40 | 63 | 1022 5 | 13.23 0.77 |
| ESO305-017 | 05:15:00.6 | -41:23:33 | IB | 9.9 0.5 | 0.030 | 86.0 | 0.90 0.35 | 64 | 1071 11 | 14.51 0.23 |
| ESO362-011 | 05:16:38.8 | -37:06:09 | Sbc | 4.2 0.6 | 0.048 | 90.0 | 2.25 0.35 | 76 | 1345 6 | 12.85 0.23 |
| ESO362-019 | 05:21:04.2 | -36:57:25 | SBm | 8.9 0.6 | 0.043 | 90.0 | 1.10 0.35 | 3 | 1282 8 | 13.90 0.28 |
| LGG 225 | ||||||||||
| NGC 3370 | 10:47:04.0 | +17:16:25 | Sc | 5.1 1.1 | 0.031 | 56.2 | 1.60 0.90 | 148 | 1281 3 | 12.03 0.27 |
| NGC 3443 | 10:53:00.1 | +17:34:25 | Scd | 6.6 0.8 | 0.036 | 61.2 | 1.40 0.70 | 145 | 1132 8 | 14.62 0.44 |
| NGC 3447 | 10:53:23.99 | +16:46:21 | Sm | 8.8 0.7 | 0.030 | 64.1 | 1.85 1.05 | 26 | 1069 3 | 14.28 0.68 |
| NGC 3447A | 10:53:29.69 | +16:47:9.9 | IB | 9.9 0.4 | 0.030 | 69.3 | 0.88 0.55 | 106 | 1094 7 | 15.97 0.50 |
| NGC 3454 | 10:54:29.4 | +17:20:38 | SBc | 5.5 0.9 | 0.034 | 83.7 | 1.40 0.18 | 116 | 1114 10 | 13.53 0.08 |
| NGC 3455 | 10:54:31.1 | +17:17:05 | SABb | 3.1 0.8 | 0.033 | 53.6 | 1.25 0.75 | 80 | 1107 5 | 14.15 0.25 |
| NGC 3457 | 10:54:48.6 | +17:37:16 | E | -5.0 1.2 | 0.031 | 23.7 | 0.45 0.45 | 1158 6 | 12.77 0.41 | |
| NGC 3501 | 11:02:47.3 | +17:59:22 | Sc | 5.9 0.5 | 0.023 | 90.0 | 2.38 0.27 | 27 | 1131 7 | 13.41 0.22 |
| NGC 3507 | 11:03:25.4 | +18:08:07 | SBb | 3.1 0.4 | 0.024 | 31.9 | 1.70 1.45 | 110 | 975 9 | 11.93 0.51 |
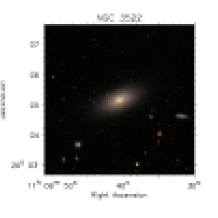
| NGC 3522 | 11:06:40.4 | +20:05:08 | E | -4.9 0.4 | 0.023 | 90.0 | 0.60 0.35 | 117 | 1225 11 | 13.72 0.41 |
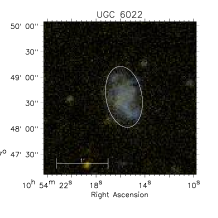
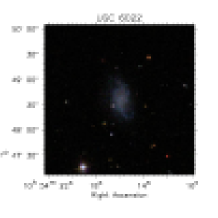
| UGC 6022 | 10:54:15.38 | +17:48:34.4 | I | 9.9 0.5 | 0.032 | 63.9 | 0.60 0.35 | 10 | 973 6 | |
| UGC 6035 | 10:55:28.7 | +17:08:33 | IB | 9.9 0.4 | 0.031 | 57.2 | 0.70 0.65 | 177 | 1072 3 | 15.28 0.50 |
| UGC 6083 | 11:00:23.8 | +16:41:32 | Sbc | 4.1 0.5 | 0.020 | 90.0 | 0.78 0.09 | 143 | 938 3 | 14.96 0.32 |
| UGC 6112 | 11:02:35.3 | +16:44:05 | Scd | 7.4 0.8 | 0.020 | 90.0 | 1.25 0.40 | 123 | 1038 6 | 14.56 0.53 |
| UGC 6171 | 11:07:10.0 | +18:34:10 | IB | 9.9 0.4 | 0.022 | 90.0 | 1.25 0.30 | 68 | 1199 9 | 14.97 0.39 |
 |
 |
| LGG | RA | Dec | Observing | FUV | NUV | Observing |
| [deg] | [deg] | Date | Exp. Time [sec] | Exp. Time [sec] | program | |
| LGG 93 P1 | 47.5050 | -53.3358 | 2006-12-02 | 1172 | 1172 | GI1 047 |
| LGG 93 P2 | 50.1375 | -52.63825 | 2006-10-10 | 1860 | 1860 | MIS |
| LGG 93 P3 | 51.7627 | -52.87209 | 2006-10-10 | 1516 | 1517 | MIS |
| LGG 93 P4 | 52.9283 | -51.9025 | 2004-12-09 | 1614 | 1614 | GI1 009 |
| LGG 93 P5 | 53.3025 | -50.41417 | 2004-12-08 | 1513 | 1513 | GI1 047 |
| LGG 127 P1 | 77.2175 | -37.2449 | 2005-12-05 | 2155 | 2155 | GI2 121 |
| LGG 127 P2 | 74.9908 | -26.0222 | 2004-12-11 | 1905 | 3907 | GI1 047 |
| LGG 127 P3 | 76.3163 | -37.9719 | 2004-12-10 | 1957 | 3954 | GI1 009 |
| LGG 127 P4 | 76.6115 | -31.9493 | 2003-11-27 | 1698 | 1698 | NGA |
| LGG 127 P5 | 77.0408 | -38.3053 | 2004-12-10 | 2835 | 2835. | GI1 009 |
| LGG 127 P6 | 78.7604 | -41.3572 | 2004-11-12/11 | 2719 | 4060 | GI1 009 |
| LGG 127 P7 | 79.1738 | -37.0953 | 2004-11-12/2005-01-29 | 1490 | 8006 | GI1 009 |
| LGG 127 P8 | 80.7694 | -37.1592 | 2005-10-31 | 116 | 116 | AIS |
| LGG 225 P1 | 163.3617 | 16.77889 | 2006-03-22 | 4160 | 4651 | GI2 121 |
| LGG 225 P2 | 163.7025 | 17.6212 | 2006-03-23 | 1609 | 1609 | GI2 121 |
| LGG 225 P3 | 161.9588 | 17.6503 | 2005-02-28 | 104 | 104 | AIS |
| LGG 225 P4 | 165.0826 | 16.25137 | 2005-02-28 | 108 | 108 | AIS |
| LGG 225 P5 | 165.5296 | 17.20472 | 2005-02-28 | 109 | 109 | AIS |
| LGG 225 P6 | 165.9695 | 18.14557 | 2005-02-28 | 107 | 107 | AIS |
| LGG 225 P7 | 166.6684 | 20.0865 | 2008-02-14 | 1706 | 1706 | GI3 046 |
| LGG 225 P8 | 167.0216 | 18.2238 | 2005-02-28 | 107 | 107 | AIS |
In the context of group evolution, the Local Group (LG hereafter) offers clear examples of ongoing interactions and/or merging episodes. Both observations and models suggest that the life in the LG is highly dynamic. Although the Milky Way, M31 and M33 do not appear severely distorted by the mutual gravitational interaction, except for the outermost regions (McConnachie et al. 2009), the disruption and accretion of small galaxies by the spiral members seems very frequent. These accretions give rise to gaseous and stellar tidal streams that continue to orbit the accreting galaxy as fossil relics of the mass transfer activity. Ongoing accretion events have been detected around the Milky Way. We quote some cases discovered in the recent years: the Pal 5 stream (e.g. Odenkirchen et al. 2001), the Sagittarius stream (e.g. Ibata et al. 2001), the Monoceros stream (e.g. Yanny et al. 2003), the orphan stream (Belokurov et al. 2006) and the anticenter stream (Grillmair 2006). The most prominent and the earliest discovered is the Magellanic stream (Brüns et al. 2005) that dynamical models suggest to be about 1.7 Gyr old (e.g. Nidever et al. 2008).
In order to place the observed properties of the LG in the general evolutionary framework of loose groups dominated by late-type galaxies, we need to compare its basic parameters (e.g presence of tidal phenomena, star formation activity) with nearby, very similar systems, possibly so similar to be considered basically analogs of the galaxy system we inhabit. In this context, we started a study of a sample of late-type galaxy dominated groups with GALEX. Our sample includes three nearby groups at approximately the same distance, namely LGG 93, LGG 127 and LGG 225. LGG 93 and LGG 127 are completely dominated by spiral galaxies while LGG 225 contains two early-type galaxies. This study, through a detailed analysis of each member galaxy in the UV and, where possible, in the optical, combined with a luminosity-weighted dynamical study of each group as a whole, provides new elements to infer the evolutionary state of the group in a hierarchical evolutionary scenario. GALEX’s wide field of view allowed us to obtain a snapshot of the entire groups, of tidal features and to map the recent star formation (SF) in late-type galaxies.
The paper is arranged as follows. Section 2 describes the sample and its properties, as compiled from the current literature. Sections 3 presents the UV observations and, for LGG 225, the SDSS observations. The UV morphology and the optical and UV photometry are presented in Section 4. In Section 5 we use synthetic galaxy populations models to interpret the energy distribution, estimate ages and masses of group galaxies and compare them to the groups dynamical properties. Discussion and conclusions are given in Section 6. H0=75 km s-1Mpc-1 is used throughout the paper.
2 The sample
Table 1 compiles the main characteristics of the galaxies members of LGG 93, LGG 127 and LGG 225 analyzed in the present study. It includes for each galaxy the J2000 coordinates, the morphological type, the foreground galactic extinction from NED, the inclination, the semi-major and semi minor axis length, the position angle (P.A.), the heliocentric systemic velocity and the B-band total apparent magnitude.
LGG 93 and LGG 127 are located in the southern hemisphere. The three groups have a similar average recession velocity of 1000 km s-1. The galaxy group membership list is obtained from HYPERLEDA on the ground of the redshift analysis performed by Huchra & Geller (1982) and Garcia (1993). For LGG 225, we integrated the HYPERLEDA member list with Giuricin et al. (2000) catalog.
LGG 93 is composed of 5 identified members (=501 km s-1), all spirals of similar apparent magnitude (=12.610.58). Four of them are classified as barred spiral. LGG 127 is composed of 9 identified members (=605 km s-1). The faintest member, ESO305-017, is the only irregular galaxy identified in this group composed of spirals, most of which of late morphological types. The spread in luminosity (=12.591.37) is larger than in LGG 93. LGG 225 is the richest group, composed of 15 identified members with a spread of =343 km s-1. Together with a large number of spirals and five irregulars it contains also two elliptical galaxies. The group is also characterized by a large spread in the galaxy apparent magnitude (=14.011.19).
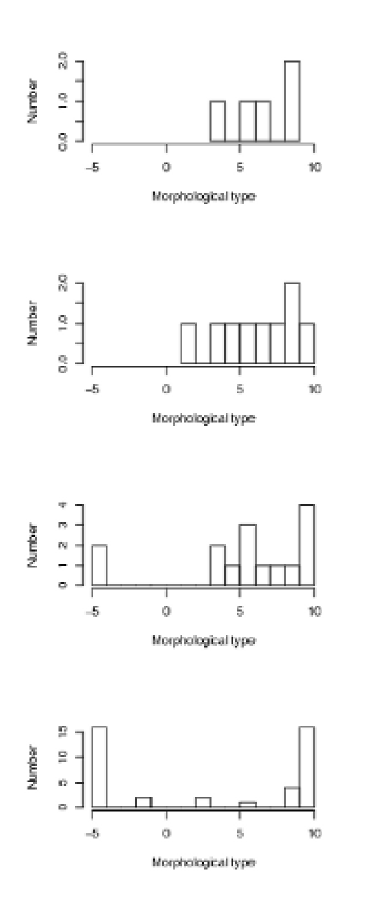
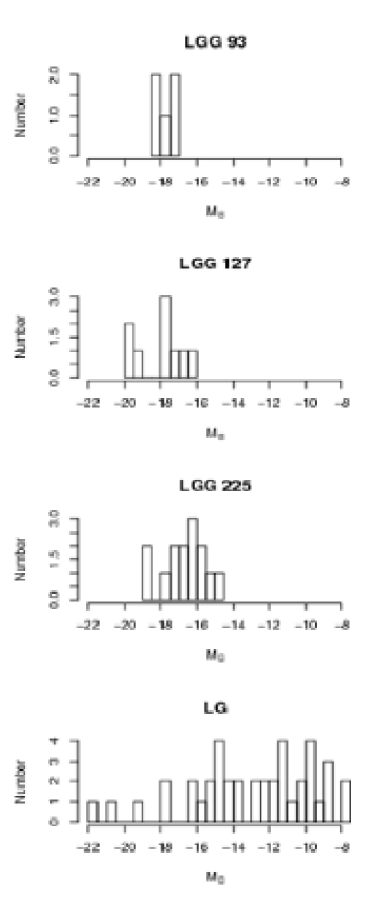
The morphological type and absolute B magnitudes distributions of group members and, for comparison, of our LG are shown in Figure 1. For the LG members, we used the list of galaxies by Pasetto & Chiosi (2007). The list of our group members does not include galaxies fainter than MB= -15 which are the larger fraction in the LG. Such faint galaxies are below the detection limits of our source catalogues (see e.g. Garcia 1993). Most of the LG galaxies with Type=-5 are dwarf spheroidal galaxies, clearly different in magnitude (and mass) range from early-type galaxies present in LGG 225. Our groups show an overabundance of intermediate luminosity galaxies with respect to LG and a lack of bright (M-20), M31 and MW-like, members.
In the recent group compilations, of Tago et al. (2008), based on SDSS data release 5, and Eke et al. (2004) from the Two-degree Field Galaxy Redshift Survey, the majority (81%, and 76%, respectively) of groups have less than 4 members. The percentage of groups with 4 to 10 members drops to 17% and 21% respectively, and to 2% and 3%, for groups with 11 to 20 members. In this context, although the above group compilations suffer of some biases, the most important of which is a redshift-dependent bias underlined e.g. by Plionis et al. (2006), LGG 225, dominated by spirals with at least 15 members, may be considered among the more rare and richest groups.

3 Observations
The UV imaging was obtained with GALEX (Martin et al. 2005; Morrissey et al. 2007) in two ultraviolet bands, FUV (1344 – 1786 Å) and NUV (1771 – 2831 Å). The instrument has a very wide field of view (1.25 degrees diameter) and a spatial resolution 42 and 53 FWHM in FUV and NUV respectively, sampled with 1515 pixels (Morrissey et al. 2007).
We observed our sample groups as part of GALEX GI2 program 121, P.I. L.M. Buson. In order to analyze all members of the three groups we also searched for other observations in the public GALEX archive (see Table 2). The exposure times of our sample range from 100 sec for All Sky Survey (AIS) archival data (limiting AB magnitude in FUV/NUV of 19.9/20.8) to 8 ksec. AIS archival data used to complete the sample have exposure times 20 times shorter than our GI data, therefore a 3.2 mag brighter limit.
We used FUV and NUV background-subtracted intensity images from the GALEX pipeline to compute integrated photometry of the galaxies and light profiles, as described in the next Section. Background counts were estimated from the sky background image and high resolution relative response map provided by the GALEX pipeline (Section 4.2).
In addition, we used optical Sloan Digital Sky Survey (SDSS) archival data (Adelman-McCarthy et al. 2008) in the u [2980-4130 Å], g [3630-5830 Å], r [5380-7230 Å], i [6430-8630 Å], z [7730-11230 Å] bands available for LGG 225, and B magnitudes from Table 1 for the other two groups.
|
 |
 |
 |
 |
 |
|
|
 |
 |
 |
 |
 |
|
|
 |
 |
 |
 |
 |
|
|
 |
 |
 |
 |
 |
|
 |
 |
 |
 |
 |
|
|
 |
 |
 |
 |
 |
|
|
 |
 |
 |
| Group | FUV | NUV | (FUV - NUV) |
|---|---|---|---|
| galaxy | [AB mag] | [AB mag] | [AB mag] |
| LGG 93 | |||
| NGC 1249 | 14.10 0.07 | 13.66 0.04 | 0.44 0.09 |
| NGC 1311 | 15.10 0.08 | 14.68 0.05 | 0.42 0.10 |
| IC 1933 | 14.34 0.07 | 13.96 0.04 | 0.39 0.08 |
| IC 1954 | 14.34 0.07 | 13.87 0.04 | 0.47 0.08 |
| IC 1959 | 14.74 0.08 | 14.42 0.05 | 0.32 0.09 |
| LGG 127 | |||
| NGC 1744 | 13.68 0.07 | 13.31 0.04 | 0.37 0.08 |
| NGC 1792 | 14.10 0.07 | 13.31 0.04 | 0.79 0.08 |
| NGC 1800 | 14.91 0.08 | 14.56 0.05 | 0.35 0.09 |
| NGC 1808 | 14.68 0.08 | 13.94 0.04 | 0.74 0.09 |
| NGC 1827 | 15.38 0.09 | 14.58 0.04 | 0.80 0.10 |
| ESO305-009 | 14.97 0.08 | 14.66 0.05 | 0.31 0.09 |
| ESO305-017 | 16.23 0.09 | 15.91 0.05 | 0.31 0.11 |
| ESO362-011 | 15.14 0.11 | 15.52 0.04 | 0.62 0.12 |
| ESO362-019 | 15.70 0.21 | 15.39 0.12 | 0.32 0.25 |
| LGG 225 | |||
| NGC 3370 | 14.65 0.08 | 14.31 0.04 | 0.34 0.08 |
| NGC 3443 | 15.85 0.07 | 15.48 0.04 | 0.37 0.07 |
| NGC 3447 | 14.82 0.05 | 14.55 0.03 | 0.27 0.06 |
| NGC 3447A | 15.83 0.06 | 15.72 0.03 | 0.11 0.06 |
| NGC 3454 | 17.22 0.07 | 16.60 0.04 | 0.62 0.08 |
| NGC 3455 | 15.34 0.06 | 14.77 0.03 | 0.56 0.06 |
| NGC 3457 | 20.23 0.13 | 17.76 0.05 | 2.48 0.14 |
| NGC 3501 | 16.67 0.09 | 16.12 0.05 | 0.55 0.11 |
| NGC 3507a | 14.55 0.07 | 14.13 0.04 | 0.42 0.08 |
| NGC 3522 | 19.92 0.12 | 18.03 0.05 | 1.90 0.13 |
| UGC 6022 | 17.82 0.07 | 17.51 0.04 | 0.31 0.08 |
| UGC 6035a | 16.85 0.06 | 16.52 0.04 | 0.33 0.07 |
| UGC 6083 | 18.01 0.13 | 17.48 0.07 | 0.53 0.15 |
| UGC 6112 | 16.28 0.09 | 15.85 0.05 | 0.42 0.10 |
| UGC 6171a | 16.41 0.09 | 16.23 0.05 | 0.18 0.10 |
Note: To avoid overlap in the elliptical apertures, coordinates and major and minor axes of NGC 3447A and NGC 3447 have been positioned as shown in Figure 4. aMagnitude of the foreground star have been subtracted. Magnitudes are not corrected for galactic extinction.
| Galaxy | u | g | r | i | z | |
|---|---|---|---|---|---|---|
| [AB mag] | [AB mag] | [AB mag] | [AB mag] | [AB mag] | ||
| NGC 3370 | 13.31 0.06 | 12.31 0.02 | 11.85 0.03 | 11.59 0.03 | 11.38 0.06 | |
| NGC 3443b | 15.91 0.14 | 14.79 0.05 | 14.33 0.05 | 14.11 0.06 | 13.90 0.18 | |
| NGC 3447b | 14.47 0.12 | 13.22 0.04 | 12.90 0.05 | 12.78 0.06 | 12.06 0.10 | |
| NGC 3447A | 15.34 0.16 | 14.89 0.09 | 14.71 0.13 | 14.65 0.19 | 14.32 0.44 | |
| NGC 3454 | 15.08 0.12 | 13.84 0.03 | 13.23 0.03 | 12.91 0.04 | 12.66 0.09 | |
| NGC 3455 | 13.98 0.09 | 13.02 0.03 | 12.66 0.04 | 12.50 0.05 | 12.31 0.12 | |
| NGC 3457 | 14.69 0.06 | 13.05 0.02 | 12.37 0.02 | 12.01 0.02 | 11.77 0.04 | |
| NGC 3501 | 14.41 0.07 | 13.06 0.02 | 12.40 0.02 | 11.99 0.03 | 11.68 0.05 | |
| NGC 3507a,b | 12.16 0.02 | 10.75 0.02 | 10.18 0.02 | 9.78 0.02 | 9.62 0.03 | |
| NGC 3522 | 15.16 0.11 | 13.59 0.03 | 12.88 0.02 | 12.52 0.03 | 12.37 0.06 | |
| UGC 6022 | 16.94 0.35 | 15.84 0.11 | 15.52 0.14 | 15.38 0.19 | 15.07 0.51 | |
| UGC 6035a | 13.77 0.11 | 12.90 0.04 | 12.21 0.06 | 11.75 0.05 | 10.92 0.13 | |
| UGC 6083 | 16.31 0.17 | 15.17 0.05 | 14.71 0.06 | 14.43 0.07 | 14.35 0.23 | |
| UGC 6112b | 15.22 0.14 | 14.29 0.05 | 13.94 0.06 | 13.76 0.08 | 13.75 0.31 | |
| UGC 6171a | 15.50 0.15 | 13.41 0.05 | 13.03 0.06 | 12.79 0.06 | 12.69 0.14 |
Note:a Magnitude of the foreground star have been subtracted. b Galaxy is near SDSS edge, magnitudes have been computed in a reduced area (elliptical aperture with a=0.5′, b=0.3′ for NGC 3443, with a=1.6′, b=0.8′ for NGC 3447, with a=1′, b=0.4′ for UGC 6112 and aperture of radius 0.9′ for NGC 3507 respectively, and scaled to the total area using the UV ratio to derive their mass.
4 Morphology and photometry
4.1 UV morphology
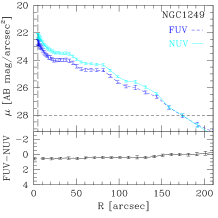
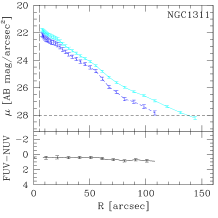
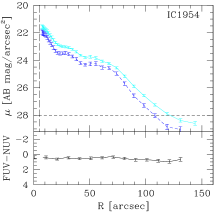
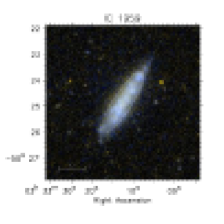
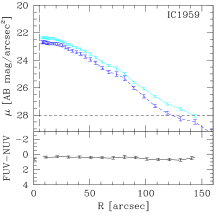
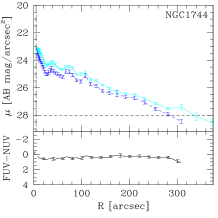
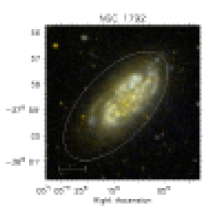
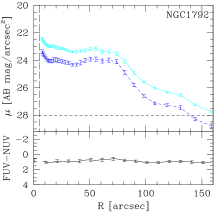
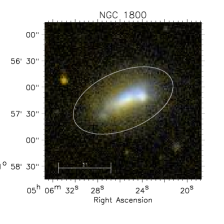
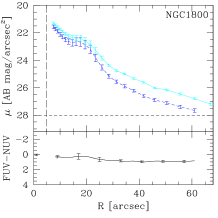
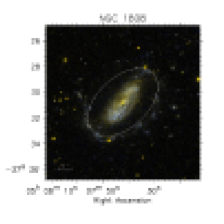
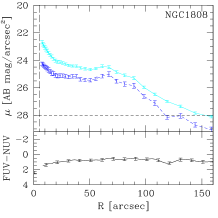
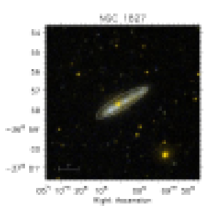
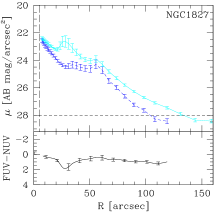
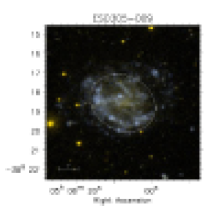
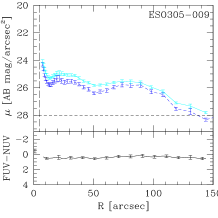
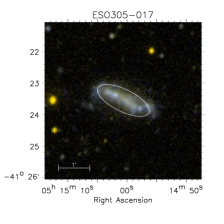
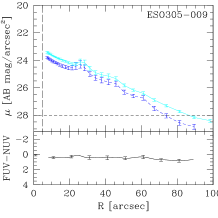
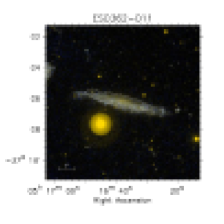
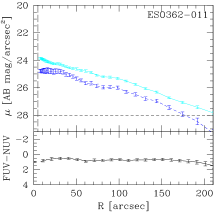
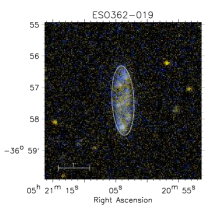
Figures 2 and 3 show the composite GALEX FUV and NUV images and the light
profiles of individual galaxies members of LGG 93 and LGG 127.
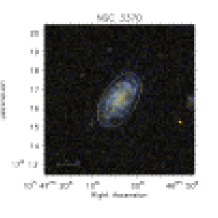
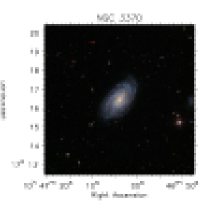
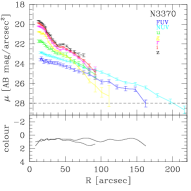
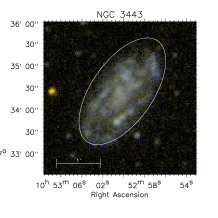
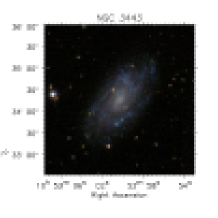
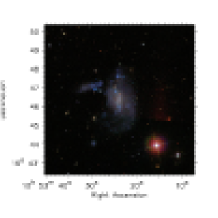
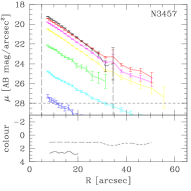
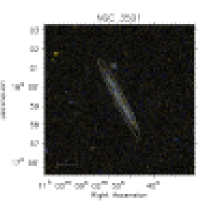
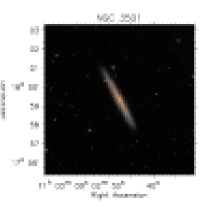
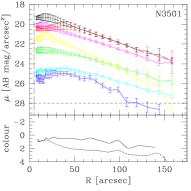
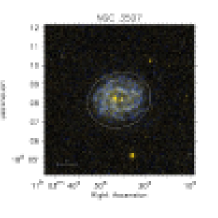
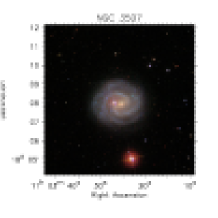
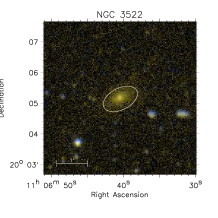
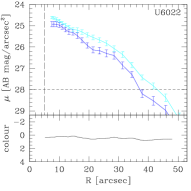
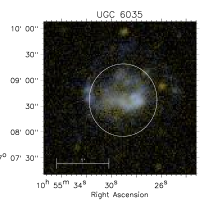
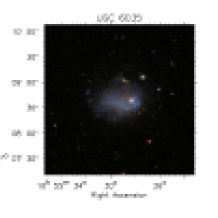
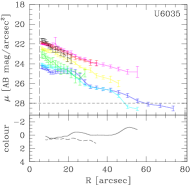
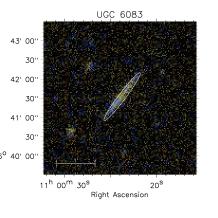
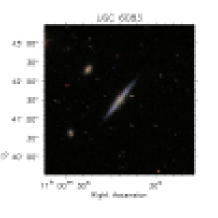
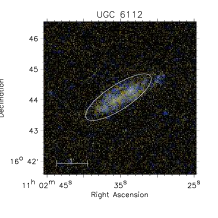
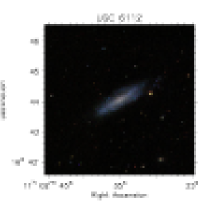
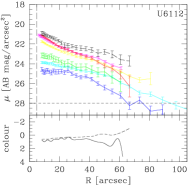
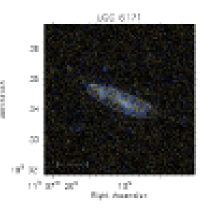
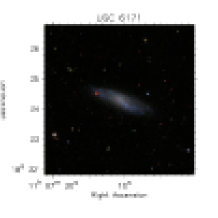
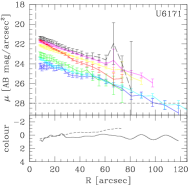
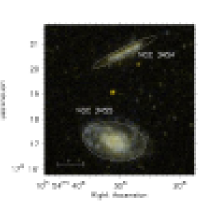
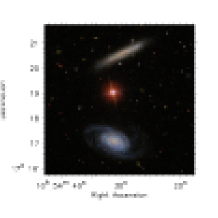
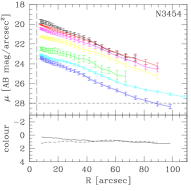
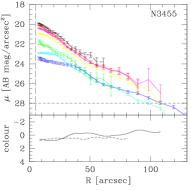
Figure 4 shows the composite GALEX and SDSS
images, surface brightness profiles, (FUV - NUV) and g - i colors of LGG 225 galaxies.
LGG 93 This is the poorest group of our sample and the analysis is exclusively based on data from the public GALEX archive.
All galaxies are late-type spirals seen at different, although high, inclination angles (58 90∘). The FUV and NUV images are basically indistinguishable.
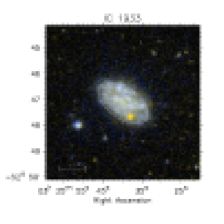
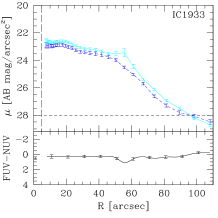
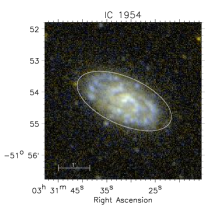
IC 1954 shows a relatively small bulge and extended, S-shaped, inner arms. The morphology appears undistorted although there is evidence of multiple arms. IC 1933 is classified as ”Sd” by Sengupta & Balasubramanyam (2006). The galaxy in both UV bands appears flocculent without a clear spiral arm structure.
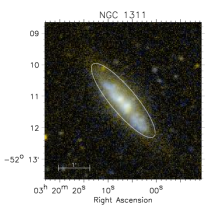
The spiral NGC 1249 shows a bar in both NUV and FUV bands, multiple arms and signatures of asymmetry. IC 1959 and NGC 1311 are viewed edge-on. In both galaxies the disk structure appears undistorted. Meurer et al. (2006) describe IC 1959 and NGC 1311 as galaxies with an elongated shape mixed with gas and a large number of regions of active star formation, also prominent in Hα. The presence of dust in NGC 1311 gives a ‘broken’ appearance to its body, in both the NUV and FUV images. The UV images of IC 1959 and NGC 1311 do not show clear evidence of bars, while they are classified as barred in the RC3 catalog.
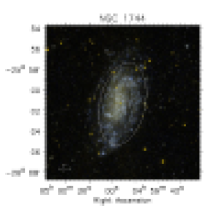
LGG 127 Nine identified members are shown in Figure 3. NUV and FUV morphology of all the galaxies are very similar, suggesting that the stellar populations are young.
Both the FUV and NUV images of NGC 1744 are very similar to the R-band and Hα images in Meurer et al. (2006). The galaxy has a bar from which grand design, open spiral arms depart. Star forming regions are visible in all parts of the galaxy. A bar structure is present also in the spiral ESO305-009.
NGC 1800 is classified Sd in the RC3 catalog but does not show signatures of arms in either UV band. Rather it has a bar-like structure in both NUV and FUV images.
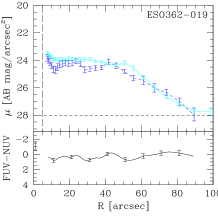
NGC 1792 and ESO362-019 have a bulge-less flocculent appearance, while NGC 1808 has an outer ring-like structure and an extended multiple-arms structure.
None of galaxies show unambiguous morphological distorsions due to interaction, while most of them show outer asymmetric structures and bars which are often associated to past interactions events (see simulations of Noguchi 1987).
LGG 225 Our two GALEX fields cover eight members of the group LGG 225, including its brightest galaxy population. Other seven members are included in archival images (Table 2) with significantly shorter exptime, and 3 mag brighter detection limit.
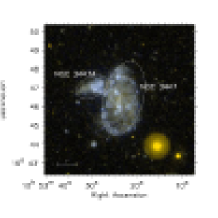
NGC 3447A (FUV-NUV=0.110.08, see next Section) is the bluest galaxy and is strongly interacting with NGC 3447. A bar is still visible in NGC 3447, while both the underlying disk and the (multiple?) arms are tidally distorted. Interaction is so strong that for NGC 3447A it is even difficult to figure out whether the original morphological type was irregular or late-type spiral.
NGC 3443 has no nearby companions, nevertheless the northern half of the galaxy is completely different from the southern one.
NGC 3454 and NGC 3455 are close both in projection and in redshift space (Table 1). The first galaxy displays a clean edge-on spiral morphology while the outer eastern arms of NGC 3455 appear tidally distorted.
UGC 6022 appears irregular and distorted. UGC 6035 has a foreground star superimposed on its main body, it appears also very irregular and probably distorted by an interaction event.
NGC 3501, UGC 6083, UGC 6112 and UGC 6171 are seen nearly edge-on and show signature of distortion as in the case of NGC 3370 and NGC 3507, this latter seen, in contrast, nearly face-on.
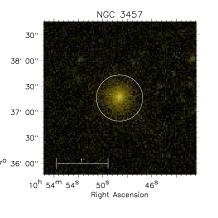
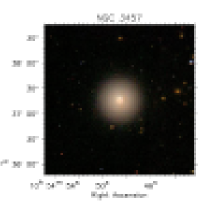
The two early-type galaxies members of the group, NGC 3457 and NGC 3522 do not show signatures of distortion.
Summarizing, although cases of morphological distortion/asymmetries and multiple arms are present in all groups, only in LGG 225 there is a direct evidence of tidal distortion, as in the cases of pairs NGC 3447/NGC 3447A and NGC 3454/NGC 3455.
Furthermore the UV emission in NGC 3447/NGC 3447A, in NGC 3455 and UGC 6035 extends much farther out than the respective optical images (Figure 4).
4.2 UV and optical photometry
Table 3 gives the GALEX FUV and NUV magnitudes of the observed members of the three groups. AB magnitudes were measured from GALEX background-subtracted intensity images, within the ellipses shown in Figures 2, 3 and 4. The major and minor axes as well as the P.A. of the ellipses are reported in Table 1, columns 8, 9 and 10.
FUV and NUV magnitudes were computed as m(AB)UV = -2.5 log CRUV + ZP where CR is the dead-time corrected, flat-fielded count rate, and the zero points ZP=18.82 and ZP=20.08 in FUV and NUV respectively (Morrissey et al. 2007). In order to estimate the errors on UV magnitudes, we propagated the Poisson statistical errors on source and background counts. In addition to the statistical error, we added an uncertainty to account for systematic inaccuracies in the zero-point of the absolute calibration of 0.05 and 0.03 magnitudes for FUV and NUV respectively (Morrissey et al. 2007). For the three galaxies in our sample (NGC 1800, NGC 1808 and NGC 3522) in common with the sample of Gil de Paz et al. (2007), the measured magnitudes are consistent within errors with those measured by Gil de Paz et al. (2007) in d25.
For LGG 225, we registered the SDSS images (corrected frames
subtracted by the ‘soft bias’ of 1000) to the corresponding GALEX
ones using the IRAF tool sregister.
We then computed the SDSS magnitude in the u, g, r, i and z bands in
the same elliptical apertures used for the UV.
We converted SDSS counts to magnitudes following the recipe provided
in http://www.sdss.org/dr7/algorithms/fluxcal.html#
counts2mag.
Table 4 lists the SDSS AB magnitudes of the LGG 225 members.
Due to the proximity of some galaxies to the SDSS image boundaries, for six
galaxies the UV elliptical apertures were reduced to be the same of the SDSS ones
(see note in Table 4).
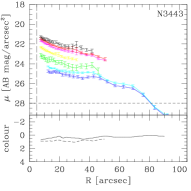
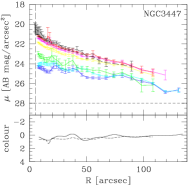
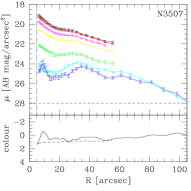
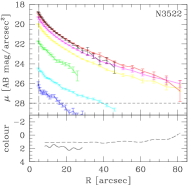
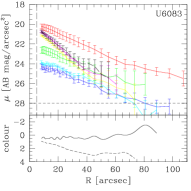
Surface photometry was also carried out on the background subtracted GALEX and SDSS images for LGG 225 with the ELLIPSE fitting routine in the STSDAS package of IRAF. ELLIPSE computes a Fourier expansion for each successive isophote (Jedrzejewski 1987), resulting in the surface photometric profiles. The UV and SDSS luminosity and (FUV-NUV) and () color profiles are plotted in the right panels of Fig. 4. The profiles are plotted versus galactocentric distance along the semi-major axis.
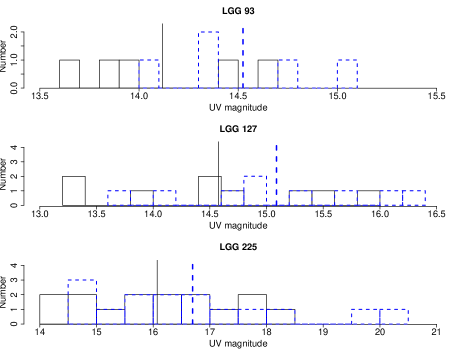
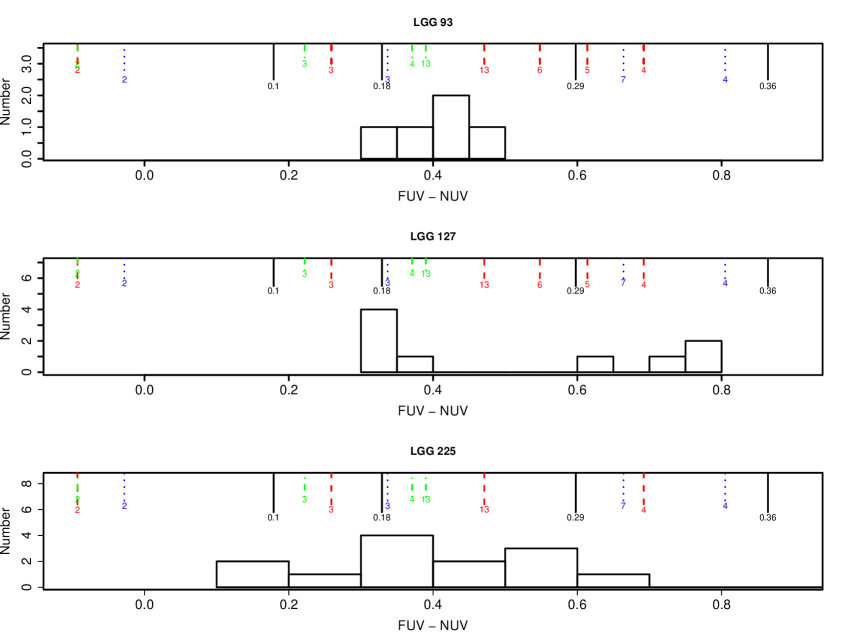

Figures 5 and 6 show the distribution of NUV and FUV magnitudes and (FUV-NUV) colors for the three groups. The five members of LGG 93 have very similar total apparent magnitudes in both UV bands (=14.120.42, =14.520.40) and their (FUV-NUV) colors (see Table 3) show a small dispersion (0.410.06), IC 1954 being the reddest galaxy (FUV-NUV=0.470.08) and IC 1959 the bluest (FUV-NUV=0.320.09). The mean NUV and FUV magnitudes of LGG 127 and LGG 225 are =14.580.93, =15.090.87 and =16.071.27, =16.701.73 respectively. The (FUV-NUV) colors of LGG 127 (Table 3) show a large dispersion, NGC 1827 being the reddest galaxy with (FUV-NUV)=0.800.10 and ESO305-009 and ESO305-017 the bluest with (FUV-NUV)=0.310.11. Also for LGG 225, the (FUV-NUV) colors show a large dispersion, the two ellipticals (NGC 3457 and NGC 3522) being the UV-faintest and reddest galaxies in the sample, however their magnitudes have a large uncertainty due to the short exposure times. For comparison, we also show in Figure 6 the synthetic colors for Single Stellar Population (SSP) at representative ages and for GRASIL models of spirals at 2 inclinations and extinctions, computed as described in the next Section.
In Figure 7 we plot the (FUV-NUV) colors as a function of morphological type for all group members. We also include three irregulars belonging to our LG (Gil de Paz et al. 2007). The solid line represents the best linear fit for spirals obtained by Gil de Paz et al. (2007). Spiral members (FUV-NUV) colors agree well with the best fit, early-spiral are redder than late-type spirals and irregular galaxies. The two early-type members are located in the upper left region of the plot.
|
|
|---|---|
|
|
|
|


5 Analysis
5.1 FUV - NUV color profiles in member galaxies
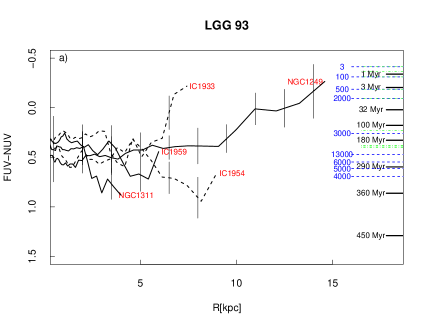
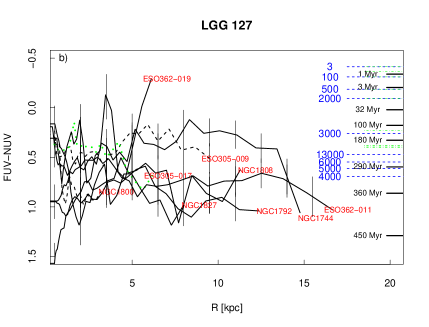
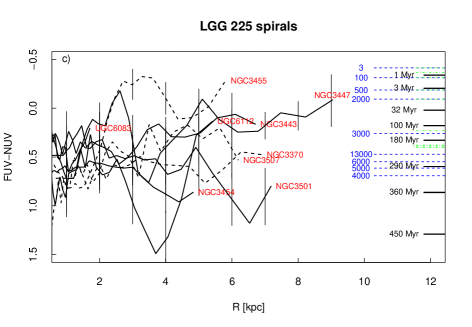
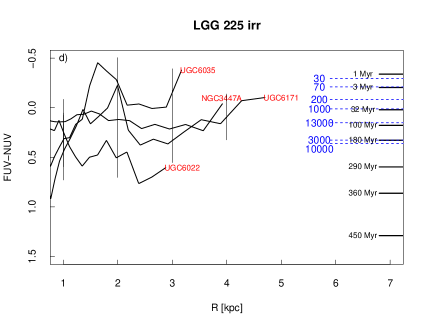
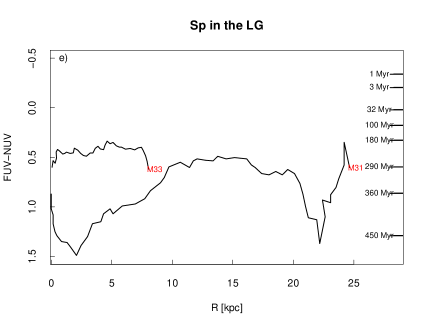
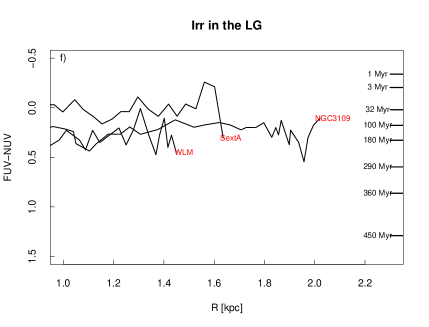
In Figure 8 (top and middle panels) we show (FUV - NUV) radial color profiles of the three groups. We evaluated color profiles within isophotes out to radii where the uncertainty in the surface brightness was less than 0.3 mag/arcsec2. The color profile of galaxies of each group is plotted as a function of the linear projected distance from the galaxy center. For comparison, synthetic colors for SSP and for spirals computed with the GRASIL model code (Silva et al. 1998) at representative ages are also shown (see next Section for spirals that account for internal reddening). Spirals with inclination larger or smaller than 60∘ are plotted in Figure 8 with solid and dashed lines respectively. In panel b) of the same figure, the green dotted line marks the only irregular in LGG 127. For comparison, in the bottom panels of Figure 8, we show the (FUV-NUV) color profiles of M31 and M33 presented by Thilker et al. (2005) and of three irregulars in the LG (Gil de Paz et al. 2007). Extinction certainly affects the color: a signature is clearly visible in the ‘broken’ appearance of NGC 1311’s disk (see Figure 2). The (FUV-NUV) color is essentially reddening free for average Milky Way extinction with Rv=3.1 (Bianchi et al. 2005, 2007) and thus gives a direct indication of age. Panel ) in Figure 8 shows color profiles of spirals in the LGG 93 group. All galaxies have similar (high) inclination. Most of the galaxy centers in LGG 93 show indication of young stellar populations. NGC 1249 and IC 1933 color profiles became bluer in the outskirts suggesting the presence of young stellar populations. Color profiles of the group LGG 127 are shown in panel ) of Figure 8. The general trend of the (FUV-NUV) radial profiles in LGG 127 spirals, in particular that of NGC 1744 and NGC 1792, is not very dissimilar from that of M33. (FUV-NUV) colors profiles in LGG225 suggest that irregular galaxies (panel d) host younger stellar populations than spiral members (panel c). Blue color profiles of the interacting pair NGC 3454/NGC 3455, and NGC 3447/NGC 3447A, suggest that recent star formation events could be triggered by tidal interaction. This could be also the case of the strongly distorted galaxy UGC 6035, whose (FUV-NUV) color suggests the presence of very young stellar population. The (FUV-NUV) color profiles of three irregulars of the LG, studied by Gil de Paz et al. (2007), namely WLM (IB, RC3 Type =10), Sextans A (IB RC3 Type=10) and NGC 3109 (SBS9 RC3 Type=9) show a color profile quite flat (Figure 8 panel f)) similar to UGC 6171 and NGC 6022 in LGG 225.
5.2 The spectral energy distributions of LGG225 galaxies
LGG225 is the only group for which we have measurements of spectral energy distributions (SEDs) from UV to near-infrared (NIR). Figure 9 shows the SED of LGG225 members arranged by morphological types, top panels show the spirals with inclination larger and smaller than 60∘ respectively, and bottom panels irregulars and ellipticals. The SEDs of the spiral galaxies are qualitatively similar, especially at optical wavelengths, but show a range of slopes at near-UV and far-UV wavelengths, indicative of a range of ‘ages’ of the composite population, i.e. of a varying relative contribution of the UV-emitting younger populations. Note the ‘broken’ appearance of the SED of NGC 3447. Most of the irregulars also show a similar SED in optical bands while UV bands have different slopes. In addition to the amount of recent star formation, a major factor affecting the SED in the UV is the extinction by interstellar dust. As expected, the SED of the spirals seen edge-on (Figure 9 top left panel) appears in general ‘redder’ than the spirals with low (60∘) inclination (Figure 9 top right panel). In order to interpret the effects of evolution (‘age’ of the integrated population) and extinction we computed grids of models using the GRASIL code (Silva et al. 1998).
5.3 Model grids
Full details of GRASIL code are given in Silva et al. (1998). Here we briefly
describe the main characteristics.
The code works in two steps: first, the history of the
star formation rate, the Initial Mass Function (IMF), the metallicity and
the residual gas fraction are assumed.
The main parameters of this step are the baryonic mass of the galaxy,
the gas infall time-scale (tinf) and the
star formation efficiency () of the assumed Schmidt law. We adopted the Salpeter IMF
and the typical parameters regulating the star formation history (SFH) for spiral,
irregular and elliptical types
from Silva et al. (1998).111available on the web
at
http://adlibitum.oat.ts.astro.it/silva/grasil/modlib/modlib.html.
The main SFH parameters for the different morphology types are
given in Table 5, all other parameters of the code have been kept
to their default values.
In the second step, the integrated SED is computed taking into account all
the stars and the gas at any given age (tG). An important feature of GRASIL
is that it includes the effect of age-dependent extinction with young stars being
more affected by dust. In particular, it takes into account several environments with different dust
properties and distributions, such as the AGB envelopes, the diffuse interstellar medium and the
molecular clouds.
New stars are born in Molecular Clouds (MC) and progressively dissipate them,
the fundamental parameter that describes this process
is the time-scale tesc.
The geometry of the spiral galaxies in GRASIL is described as a
superposition of an exponential disc component
and a bulge component with a King profile for spirals. For ellipticals and irregulars
a spherically symmetric distribution for both stars and dust with a King profile is adopted.
The total gas mass (diffuse and MCs) of the galaxy at a
given age come from the chemical
evolution model.
The relative fraction of molecular gas is a free parameter of the code (fmc)
and is set to zero for early-type galaxies.
5.4 Comparison of the observed SEDs with GRASIL models
From the model spectra we computed synthetic broad-band magnitudes in the GALEX FUV, NUV and SDSS u, g, r, i, z filters over a large range of ages. The resulting SEDs at some representative ages are shown in Figure 10 to illustrate the effects of evolution (left panels) and extinction (right panels). As said in Sect. 5.3, GRASIL models take into account internal extinction by interstellar dust, in computing the emerging flux. In figure 10 (left panels) the model magnitudes are shown without additional foreground extinction. In the right panel of the same figure, we show the effects of additional foreground extinction applied to the models of some representative ages. The comparison of the left panels with the right panels shows the advantage of using UV plus optical bands. Evolution and extinction affect in different way the SED in the UV part of the spectrum (FUV, NUV and u).
The comparison of the observed SEDs in Figure 9 (top panels) to the model grids in Figure 10 indicates that ages younger than 3 Gyrs and older than 6 Gyr can be excluded for spirals if no additional extinction (to the GRASIL estimated internal extinction) is assumed. In both cases, thanks to the UV part of the SED, it is possible exclude extinction (Rv=3.1) greater than E(B-V)=0.1.
While Figure 10 illustrates the effects of population evolution and dust extinction, for a typical SFH of each morphological type, in practice we used the model grid from a few Myr to 13 Gyr to estimate by fitting the best ‘age’ of the composite population for each observed SED, and we used the best-fit model result to estimate the galaxy current stellar mass. We performed the SED model fitting in two ways: first, assuming foreground extinction as given in Table 1, which is minimal, in addition to the internal extinction estimated by GRASIL and, second, by treating the ‘age’ of the population and a foreground extinction component, both as free parameters. As we do not attempt in this work to derive the exact SFH history of the galaxies, we consider the results from these two options to bracket the range of possible solutions with a good approximation. This is supported by the fact that a very different SFH we explored (the “Irr” type as described by Silva et al. (1998) and given in table 5) cannot produce satisfactory fits to the observed SEDs of spirals (Figure 9 left panel). The overall results characterize the galaxy populations of the LGG 225 group: the composite populations of spirals have evolutionary times spanning between a few Gyrs to 6 Gyrs, and the total mass (sum of the stellar mass of all galaxies measured) is estimated between 5 and 35 M⊙, with the assumed SFH in our model analysis.
Lacking SDSS observations for LGG 93 and LGG 127, we used FUV, NUV from Table 3 and B magnitudes from Table 1 to estimate the stellar mass using the same GRASIL grids. The estimated total stellar masses are 4 M⊙ for LGG 93 and 4 M⊙ for LGG 127. Uncertainties affecting derived masses of LGG 93 and LGG 127 are larger than those derived for LGG 225, not only because we use only three bands in the SED fits but also because the B magnitude is the total magnitude while FUV and NUV are d25 magnitudes.
5.5 Are there rejuvenation signatures in the Elliptical members of LGG225?
Local early-type galaxies (hereafter ETGs) are considered the fossil record of the processes of galaxy formation (see for a review: Renzini 2006). At the same time, there is growing evidence that the assumption of passive evolution of ETGs may be too simplified, especially for the ETGs population in low density environments (hereafter LDEs).
Several studies point to the galaxy environment as a possible ingredient in their evolution (see e.g. Clemens et al. 2009). At odds with cluster counterparts, ETGs in LDEs frequently show significant signatures of relatively recent activity as indicated by the presence of distorted morphologies (Reduzzi et al. 1996; Colbert et al. 2001) and of kinematical sub-components (Emsellem et al. 2004, and reference therein). The analysis of line-strength indices (Trager et al. 2000; Longhetti et al. 2000; Kuntschner 2000; Thomas et al. 2003; Denicoló et al. 2005; Annibali et al. 2007; Rampazzo et al. 2007) shows that ETGs in LDE have a large dispersion in their luminosity weighted age, from a Hubble time to 1 Gyr. About 40% of ETGs in the Annibali et al. (2007) sample have a luminosity weighted age 6 Gyr, and 10% 3 Gyr.
Simulations show that ETGs may have formed through subsequent accretion or merging episodes that leave their signatures in a younger stellar population. The ETGs morphological fine structures as well as their kinematical sub-components almost certainly formed as the result of either accretion (e.g. Barnes 2002; Bournaud et al. 2005; Naab et al. 2006) or interactions episodes sometimes with gas-rich neighbors (van Gorkom & Schiminovich 1997). Some ETGs are also known to have detectable amounts of cold gas (see e.g. Morganti et al. 2006). Rejuvenation episodes may then be common among ETGs. However, it is still unclear how significant and frequent they have been during the Hubble time.
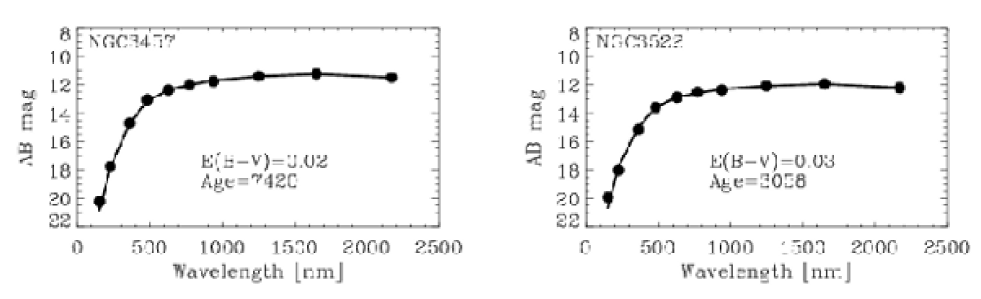
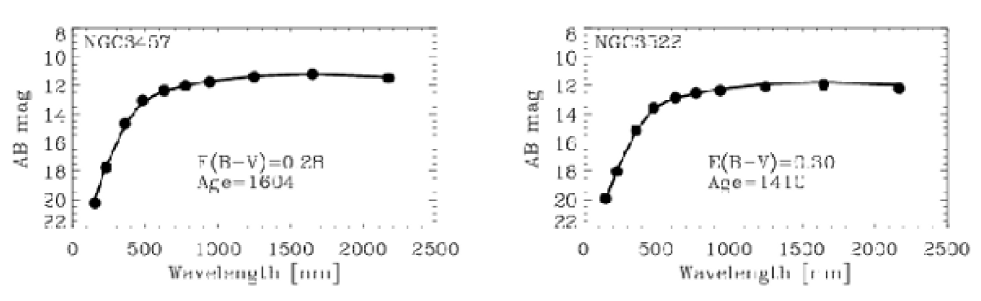
In this context, although no morphological peculiarities are shown by both NGC 3457 and NGC 3522, we investigated the galaxies SEDs (see Figure 9) since FUV and NUV bands are a sensitive probe of young stellar populations (e.g. Bianchi et al. 2007; Bianchi 2009). In addition to GALEX and SDSS data we also included 2MASS J, H, Ks magnitudes taken from the Extended Source Catalog (Jarrett et al. 2003). Figure 11 shows the measured SEDs from FUV to IR and the best-fit models obtained for the two ellipticals. The top panels show SED fit results imposing the values from Table 1 (column 6) for the foreground extinction, in the bottom panels both age and the value of the foreground E(B-V) were treated as free parameters. In the first case, NGC 3457 has a derived age close to the oldest of the range found for spirals and it is about three times more massive than NGC 3522. The fit with the models of passive evolution reproduces well the optical-IR SED of both galaxies, but a small FUV excess is seen in both objects. This may indicate a different SFH than simply passive evolution. The much younger ages in the second case are an effect of the higher E(B-V). Allowing for a higher foreground E(B-V) component, the whole wavelength range is reproduced quite well. However such a higher E(B-V) with respect to previous estimates is hard to explain, and different SFHs will be explored in a subsequent work, together with spectroscopy, to remove the degeneracy age-extinction.
The derived masses, (between 2 and 4 109 M⊙ for NGC 3457 and 1-2 109 M⊙ for NGC 3522) are comparable to the least massive spirals in LGG 225 and to the ellipticals in our LG (NGC 205, M32, Mateo 1998). The mass of the most massive spirals in LGG 225 is comparable to M33, therefore LGG 225 group may be considered an analog of our LG except for lacking of the brightest spirals.
| Type | tinf | tesc | fmc | IMF mass | |
| [Gyr-1] | [Gyr] | [Myr] | [M ⊙] | range | |
| Elliptical | 2 | 0.1 | 100 | 0 | 0.15 - 120 |
| Spiral | 0.6 | 4 | 18 | 0.5 | 0.1 - 100 |
| Irregular | 0.8 | 9 | 20 | 0.5 | 0.2 - 100 |
| Group | Center | Vgroup | Velocity | D | Harmonic | Virial | Projected | Crossing | Group |
|---|---|---|---|---|---|---|---|---|---|
| name | of mass | dispersion | radius | mass | mass | timeH0 | Lumin. | ||
| RA [deg] Dec | [km/s] | [km/s] | [Mpc] | [Mpc] | [1013 M⊙] | [1013 M⊙] | [1011 L⊙] | ||
| LGG 93NUV | 50.7510 -52.32828 | 95090 | 20061 | 12.66 | 0.450.04 | 1.960.44 | 7.6 5.2 | 0.110.10 | 1.940.03 |
| LGG 93B | 50.7847 -52.32504 | 96685 | 19058 | 12.87 | 0.470.04 | 1.870.45 | 7.2 5.4 | 0.120.12 | 0.110.01 |
| LGG 127NUV | 76.5414 -34.27129 | 100065 | 19846 | 13.33 | 0.520.03 | 2.220.33 | 26.216.3 | 0.450.17 | 4.280.07 |
| LGG 127B | 76.6130 -35.80034 | 105058 | 17540 | 14.00 | 0.340.03 | 1.140.33 | 27.910.6 | 0.450.17 | 0.500.03 |
| LGG 225NUV | 164.0016 17.44647 | 110427 | 10519 | 14.72 | 0.110.02 | 0.140.26 | 3.1 1.3 | 0.350.07 | 2.530.03 |
| LGG225B | 164.1968 17.74061 | 112530 | 11821 | 15.00 | 0.290.03 | 0.450.27 | 4.1 2.1 | 0.410.08 | 0.200.04 |
aEach quantity is computed weighting for NUV and B magnitudes, as marked on the top of the name groups.
5.6 Group kinematic and luminosity–weighted dynamical properties
A characterization of the group evolutionary phase requires a kinematical and dynamical analysis. We derived the kinematical and dynamical properties of our three groups, following the luminosity-weighted approach described in Firth et al. (2006). This approach allow us to describe in an homogeneous way the properties of our groups and to compare them with that of nearby groups.
Firth et al. (2006) analysis considered six nearby groups having a central dominant galaxy and broad density range. These groups have both spiral and early-type members as dominant galaxies. In particular LGG 263 group is dominated by the Antennae (NGC 4038/4039), the on-going merger of two spirals. The groups is mainly populated by late-type galaxies with a scanty presence of lenticulars (ESO572-23, NGC 4024) and elliptical (NGC 4033) galaxies. This kind of galaxy population is similar to our LGG 225 group showing interacting (NGC 3447/NGC 3447a) and/or distorted galaxies (NGC 3443, NGC 3454, NGC 3507) and a scanty population of early-type (NGC 3457 and NGC 3552).
The results of the kinematical and dynamical analysis are summarized in Table 6. All mass-related quantities are obtained by luminosity-weighting the contribution from each member galaxy. According to Firth et al. (2006), after luminosity weighting, missing dwarf galaxies will not significantly alter the group velocity dispersion, virial mass estimates or crossing times. The dynamical calculations are based on the formulae given in Firth et al. (2006, (their Table 6)). Each galaxy is weighted by its relative luminosity evaluated from the NUV-band magnitude converted to relative luminosity. For comparison with the Firth et al. (2006) groups we repeat the dynamical analysis using also the B-band total magnitudes given Table 1. As shown in Table 6, the B-band and the NUV-band dynamical analysis provide comparable results within the errors.
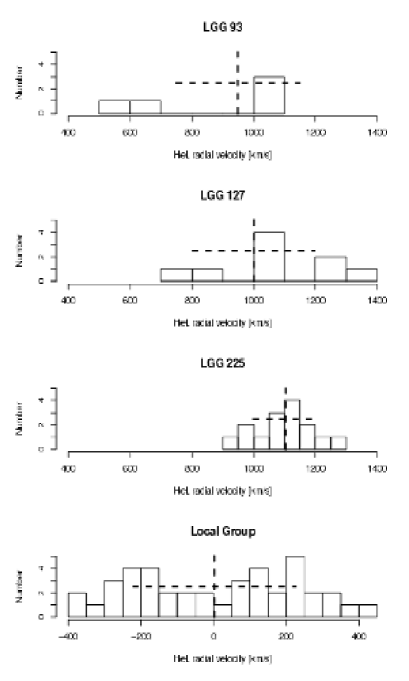
The coordinate of the center of mass in column 2 of Table 6 are obtained by averaging the NUV and B luminosity-weighted coordinates of the group members. The NUV and B luminosity-weighted mean velocity and velocity dispersion are given in columns 3 and 4 of Table 6 respectively. Fig. 12 shows the distribution of the mean heliocentric radial velocity, with overlapped the luminosity-weighted mean velocity and the velocity dispersion of the three groups and of the LG. The mean velocity of the three groups does not differ significantly while the velocity dispersion of LGG 93 and LGG 127, which are comparable to that of the LG, are two times higher than that of LGG 225.
In order to obtain a measure of the compactness of the three groups, we have computed the harmonic mean radius (column 6 of Table 6) using the projected separations rij between the i-th and j-th group member: Figure 13 shows the relative positions of the groups members in each group on a linear spatial scale. The NUV luminosity-weighted harmonic radius, centered on the group center of mass is also drawn. For comparison we show in the same Figure (right panel) the spatial distribution of galaxies in the three groups.


Columns 7 and 8 of Table 6 give the estimates of the virial mass and of the projected mass for the three groups. The differences between the virial and the projected mass are quite high, with the projected mass higher than the virial mass. This difference is expected in systems where individual galaxies are close in projection. Heisler et al. (1985) found that the virial mass underestimates the mass while the moment of the projected mass gives more accurate values. Another reason for this difference could be that the groups are not virialized. The crossing time is usually compared to the Hubble time to determine whether the groups are virialized (Ferguson & Sandage 1990). The crossing time is smaller than the Hubble time, suggesting that the groups are gravitationally bound systems. However, following Firth et al. (2006), the crossing times of LGG 127 and LGG 225 exceed 0.2 Hubble times, suggesting that they could be yet unvirialized.
Assuming Gaussian distributions for all input measurements, errors in Table 6 are computed using Montecarlo simulations. Galaxy coordinates were considered accurate. We generated a set of 10000 groups having the respective number of members of the three groups and a Gaussian distribution of respective mean velocity and dispersion given in Table 6 to derive a set of Gaussian output distributions.
Summarizing, the kinematical and dynamical analysis suggest that our three groups can be considered loose although gravitationally bound groups. As NGC 4038 and NGC 4697, studied by Firth et al. (2006), LGG 127 and LGG 225 are likely in a pre-virial collapse phase and probably still undergoing a dynamical relaxation. The luminosity–weighted virial mass estimate may be therefore questionable for these groups. LGG 93 luminosity–weighted analysis suggest that the group is likely virialized with crossing time and harmonic radius similar to that of NGC 5084 and Dorado in the Firth et al. (2006) sample.
6 Discussion and conclusions
We analyzed the UV photometric properties of three nearby groups dominated by late-type galaxies, LGG 93, LGG 127 and LGG 225. The UV data-set was integrated by SDSS optical photometry in the case of LGG 225.
FUV and NUV morphologies are very similar in most galaxies indicating that very young populations dominate their emission. UV and optical classifications are typically consistent. Bars are easily recognizable in the UV bands, although both NGC 1311 and IC 1959, indicated as barred galaxies in the RC3 classification, do not show a bar in our UV images.
Some LGG 225 members display unambiguously interacting (NGC 3447/NGC 3447A, NGC 3454/NGC 3455) and distorted morphologies (UGC 6035) particularly evident in the UV imaging. Furthermore, UV images reveal young stellar populations in extreme outskirts of these galaxies, extending much farther out than in the optical images, as found in about 30% of spiral galaxies by Thilker et al. (2007); Bianchi (2009).
A possible signature of past interaction events is the presence of a bar structure, seen in LGG 127’s, NGC 1744 and ESO305-009 which show in addition open arms, and multiple arms, as NGC 1808 in the same group. Numerical simulations (e.g. Noguchi 1987) show that a bar structure and open arms may develop in a disk galaxy after few galactic rotations, close to the passage of a companion.
(FUV-NUV) colors suggest very recent episodes of star formation. There is evidence that such episodes are triggered by on-going interaction as in the case of NGC 3447A or NGC 3454/NGC 3455. The (FUV-NUV) color profile of neither M 31 or M 33 suggests the presence of such young components, visible in the color profile of M 51 (Bianchi et al. 2005).
We derived ages and masses by fitting the observed SEDs of LGG 225 galaxy members, that extends from far-UV to NIR, with populations synthesis models. The UV bands proved to be crucial in disentangling evolution and extinction effects.
Almost all galaxies in LGG 93 and LGG 127 are detected or have upper limit fluxes at 60m and 100m in the IRAS faint source catalogue (Moshir et al. 1990). Only two galaxies in LGG 225 are detected by IRAS. Their cold dust masses are estimated in the range - M⊙ with a mean ratio =-4.650.92 typical of late-type galaxies (Bettoni et al. 2003). All galaxy members of LGG93, eight out of nine of LGG 127 and only seven out of fifteen of LGG 225 are detected in J, H, Ks bands in the 2MASS survey, NGC 3447 is not detected. The average color of the detected objects, of =3.020.65 is bluer than the typical (B-Ks) color of a 10-15 Gyr old disk (3.5, see Mazzei et al. 1992) but in agreement with our GRASIL model predictions for 3-4 Gyr spirals of 2.98B-Ks3.54, confirming our composite population SED analysis.
The Spitzer MIPS f24μm 1.7 mJy (Temi et al. 2009) of the elliptical NGC 3522 is compatible with that expected from our best fit shown in Fig. 10. No Spitzer public data are yet available for LGG 225.
We investigated the group luminosity-weighted dynamics. The comparison with Firth et al. (2006) groups suggests that ours are physically bound loose groups. The crossing times and harmonic radii indicate that LGG 127 and LGG 225 are likely in a pre-virial phase, not dissimilar from other nearby groups like NGC 4038, NGC 4697 groups, which, at odd with ours, are dominated by a central galaxy. LGG 93 is likely virialized. The unvirialized phase of LGG 127 and in particular of LGG 225 could explain the active star formation in this latter group and the indication of interactions in LGG 127. Plionis et al. (2006) computed the median dynamical characteristics of the Eke et al. (2004) group sample. For groups with and 4-30 galaxy members they found velocity dispersion of 15735 km s-1 and virial mass of ( M⊙) comparable, within errors, to our groups. In particular their median crossing time is 1.3109 yr comparable to our value for LGG 93, the likely virialized group (see Table 6). The stellar masses of the three groups estimated from the multiband photometry range from a few 109 to 1010 M⊙, although for two groups only three photometric bands are available. Dynamical masses are higher (see Table 6), comparable to the LG mass estimated to be between 1.8 and 5.3 1012 M⊙ (Li & White 2008). However for the two groups, LGG 127 and LGG 225 yet unvirialized, dynamical mass estimates are questionable. The most massive galaxy in LGG 225 is comparable to M33 in the LG, no very massive spirals are found.
Dynamical analyses of large sets of poor groups (e.g. Tovmassian & Plionis 2009, and references therein) suggest that groups in the local universe are a family of cosmic structures presently at various stages of their virialization processes. The morphology-density relation found at high density regimes (Dressler 1980) is at work also at the group scale (Postman & Geller 1984). As galaxy-galaxy interactions and merging events proceed, the host group dynamically evolves and the fraction of early-type galaxies should appear high in dynamically advanced, high velocity dispersion groups (e.g. Tovmassian et al. 2004; Aguerri et al. 2007).
Recent studies suggest that the galaxy evolution in low density environments, like loose groups, is in delay with respect to high density ones (e.g. Clemens et al. 2009, and references therein). Groups offer then the possibility to investigate the main mechanisms that drive galaxies towards the passive evolution we measure in dense structures. We are extending our multi-wavelength analysis to a large number of groups with different characteristics. In particular a group sample ranging from LGA to groups containing an increasing fraction of early-type galaxies.
Acknowledgements.
A.M. acknowledges the support of the Italian Scientists and Scholars in North America Foundation (ISSNAF) through an ISSNAF fellowship in Space Physics and Engineering, sponsored by Thales Alenia Space. We want to thank the referee for useful comments. GALEX is a NASA Small Explorer, launched in April 2003. This work is based on GALEX data from GI program 121 and archival data. We gratefully acknowledge NASA’s support for construction, operation and science analysis of the GALEX mission, developed in cooperation with the Centre National d’Etudes Spatiales of France and the Korean ministry of Science and Tecnology. Some of the data presented in this paper were obtained from the Multimission Archive at the Space Telescope Science Institute (MAST). STScI is operated by the Association of Universities for Research in Astronomy, Inc., under NASA contract NAS5-26555. Support for MAST for non-HST data is provided by the NASA Office of Space Science via grant NAG5-7584 and by other grants and contracts. We acknowledge the usage of the HyperLeda database (http://leda.univ-lyon1.fr).Facilities: GALEX, Sloan
References
- Adelman-McCarthy et al. (2008) Adelman-McCarthy, J. K., Agüeros, M. A., Allam, S. S., et al. 2008, ApJS, 175, 297
- Aguerri et al. (2007) Aguerri, J. A. L., Sánchez-Janssen, R., & Muñoz-Tuñón, C. 2007, A&A, 471, 17
- Annibali et al. (2007) Annibali, F., Bressan, A., Rampazzo, R., Zeilinger, W. W., & Danese, L. 2007, A&A, 463, 455
- Barnes (2002) Barnes, J. E. 2002, MNRAS, 333, 481
- Belokurov et al. (2006) Belokurov, V., Zucker, D. B., Evans, N. W., et al. 2006, ApJ, 642, L137
- Bettoni et al. (2003) Bettoni, D., Galletta, G., & García-Burillo, S. 2003, A&A, 405, 5
- Bianchi (2009) Bianchi, L. 2009, Ap&SS, 320, 11
- Bianchi et al. (2007) Bianchi, L., Rodriguez-Merino, L., Viton, M., et al. 2007, ApJS, 173, 659
- Bianchi et al. (2005) Bianchi, L., Thilker, D. A., Burgarella, D., et al. 2005, ApJ, 619, L71
- Blitz et al. (1999) Blitz, L., Spergel, D. N., Teuben, P. J., Hartmann, D., & Burton, W. B. 1999, ApJ, 514, 818
- Bournaud et al. (2005) Bournaud, F., Jog, C. J., & Combes, F. 2005, A&A, 437, 69
- Brüns et al. (2005) Brüns, C., Kerp, J., Staveley-Smith, L., et al. 2005, A&A, 432, 45
- Clemens et al. (2009) Clemens, M. S., Bressan, A., Nikolic, B., & Rampazzo, R. 2009, MNRAS, 392, L35
- Colbert et al. (2001) Colbert, J. W., Mulchaey, J. S., & Zabludoff, A. I. 2001, AJ, 121, 808
- de Vaucouleurs (1991) de Vaucouleurs, G. 1991, Science, 254, 1667
- Denicoló et al. (2005) Denicoló, G., Terlevich, R., Terlevich, E., Forbes, D. A., & Terlevich, A. 2005, MNRAS, 358, 813
- Dressler (1980) Dressler, A. 1980, ApJ, 236, 351
- Eke et al. (2004) Eke, V. R., Baugh, C. M., Cole, S., et al. 2004, MNRAS, 348, 866
- Emsellem et al. (2004) Emsellem, E., Cappellari, M., Peletier, R. F., et al. 2004, MNRAS, 352, 721
- Ferguson & Sandage (1990) Ferguson, H. C. & Sandage, A. 1990, AJ, 100, 1
- Firth et al. (2006) Firth, P., Evstigneeva, E. A., Jones, J. B., et al. 2006, MNRAS, 372, 1856
- Garcia (1993) Garcia, A. M. 1993, A&AS, 100, 47
- Gil de Paz et al. (2007) Gil de Paz, A., Boissier, S., Madore, B. F., et al. 2007, ApJS, 173, 185
- Giuricin et al. (2000) Giuricin, G., Marinoni, C., Ceriani, L., & Pisani, A. 2000, ApJ, 543, 178
- Grillmair (2006) Grillmair, C. J. 2006, ApJ, 651, L29
- Heisler et al. (1985) Heisler, J., Tremaine, S., & Bahcall, J. N. 1985, ApJ, 298, 8
- Huchra & Geller (1982) Huchra, J. P. & Geller, M. J. 1982, ApJ, 257, 423
- Ibata et al. (2001) Ibata, R., Lewis, G. F., Irwin, M., Totten, E., & Quinn, T. 2001, ApJ, 551, 294
- Jarrett et al. (2003) Jarrett, T. H., Chester, T., Cutri, R., Schneider, S. E., & Huchra, J. P. 2003, AJ, 125, 525
- Jedrzejewski (1987) Jedrzejewski, R. I. 1987, MNRAS, 226, 747
- Kuntschner (2000) Kuntschner, H. 2000, MNRAS, 315, 184
- Li & White (2008) Li, Y.-S. & White, S. D. M. 2008, MNRAS, 384, 1459
- Longhetti et al. (2000) Longhetti, M., Bressan, A., Chiosi, C., & Rampazzo, R. 2000, A&A, 353, 917
- Martin et al. (2005) Martin, D. C., Fanson, J., Schiminovich, D., et al. 2005, ApJ, 619, L1
- Mateo (1998) Mateo, M. L. 1998, ARA&A, 36, 435
- Mazzei et al. (1992) Mazzei, P., Xu, C., & de Zotti, G. 1992, A&A, 256, 45
- McConnachie et al. (2009) McConnachie, A. W., Irwin, M. J., Ibata, R. A., et al. 2009, Nature, 461, 66
- Meurer et al. (2006) Meurer, G. R., Hanish, D. J., Ferguson, H. C., et al. 2006, ApJS, 165, 307
- Moore et al. (1999) Moore, B., Lake, G., Quinn, T., & Stadel, J. 1999, MNRAS, 304, 465
- Morganti et al. (2006) Morganti, R., de Zeeuw, P. T., Oosterloo, T. A., et al. 2006, MNRAS, 371, 157
- Morrissey et al. (2007) Morrissey, P., Conrow, T., Barlow, T. A., et al. 2007, ApJS, 173, 682
- Moshir et al. (1990) Moshir, M., Kopan, G., Conrow, T., et al. 1990, in Bulletin of the American Astronomical Society, Vol. 22, Bulletin of the American Astronomical Society, 1325
- Naab et al. (2006) Naab, T., Khochfar, S., & Burkert, A. 2006, ApJ, 636, L81
- Nidever et al. (2008) Nidever, D. L., Majewski, S. R., & Burton, W. B. 2008, ApJ, 679, 432
- Noguchi (1987) Noguchi, M. 1987, MNRAS, 228, 635
- Odenkirchen et al. (2001) Odenkirchen, M., Grebel, E. K., Rockosi, C. M., et al. 2001, ApJ, 548, L165
- Pasetto & Chiosi (2007) Pasetto, S. & Chiosi, C. 2007, A&A, 463, 427
- Paturel et al. (2003) Paturel, G., Petit, C., Prugniel, P., et al. 2003, A&A, 412, 45
- Plionis et al. (2006) Plionis, M., Basilakos, S., & Ragone-Figueroa, C. 2006, ApJ, 650, 770
- Postman & Geller (1984) Postman, M. & Geller, M. J. 1984, ApJ, 281, 95
- Ramella et al. (2002) Ramella, M., Geller, M. J., Pisani, A., & da Costa, L. N. 2002, AJ, 123, 2976
- Rampazzo et al. (2007) Rampazzo, R., Marino, A., Tantalo, R., et al. 2007, MNRAS, 381, 245
- Reduzzi et al. (1996) Reduzzi, L., Longhetti, M., & Rampazzo, R. 1996, MNRAS, 282, 149
- Renzini (2006) Renzini, A. 2006, ARA&A, 44, 141
- Sengupta & Balasubramanyam (2006) Sengupta, C. & Balasubramanyam, R. 2006, MNRAS, 369, 360
- Silva et al. (1998) Silva, L., Granato, G. L., Bressan, A., & Danese, L. 1998, ApJ, 509, 103
- Tago et al. (2008) Tago, E., Einasto, J., Saar, E., et al. 2008, A&A, 479, 927
- Temi et al. (2009) Temi, P., Brighenti, F., & Mathews, W. G. 2009, ArXiv e-prints
- Thilker et al. (2007) Thilker, D. A., Bianchi, L., Meurer, G., et al. 2007, ApJS, 173, 538
- Thilker et al. (2005) Thilker, D. A., Hoopes, C. G., Bianchi, L., et al. 2005, ApJ, 619, L67
- Thomas et al. (2003) Thomas, D., Maraston, C., & Bender, R. 2003, MNRAS, 339, 897
- Tovmassian & Plionis (2009) Tovmassian, H. M. & Plionis, M. 2009, ApJ, 696, 1441
- Tovmassian et al. (2004) Tovmassian, H. M., Plionis, M., & Andernach, H. 2004, ApJ, 617, L111
- Trager et al. (2000) Trager, S. C., Faber, S. M., Worthey, G., & González, J. J. 2000, AJ, 120, 165
- Tully (1987) Tully, R. B. 1987, ApJ, 321, 280
- van Gorkom & Schiminovich (1997) van Gorkom, J. & Schiminovich, D. 1997, in Astronomical Society of the Pacific Conference Series, Vol. 116, The Nature of Elliptical Galaxies; 2nd Stromlo Symposium, ed. M. Arnaboldi, G. S. Da Costa, & P. Saha, 310–+
- Vollmer et al. (2002) Vollmer, B., Balkowski, C., & Cayatte, V. 2002, Ap&SS, 281, 359
- Yanny et al. (2003) Yanny, B., Newberg, H. J., Grebel, E. K., et al. 2003, ApJ, 588, 824
- Zabludoff & Mulchaey (1998) Zabludoff, A. I. & Mulchaey, J. S. 1998, ApJ, 498, L5