The spontaneous emergence of ordered phases in crumpled sheets
Abstract
X-ray tomography is performed to acquire 3D images of crumpled aluminum foils. We develop an algorithm to trace out the labyrinthian paths in the three perpendicular cross sections of the data matrices. The tangent-tangent correlation function along each path is found to decay exponentially with an effective persistence length that shortens as the crumpled ball becomes more compact. In the mean time, we observed ordered domains near the crust, similar to the lamellae phase mixed by the amorphous portion in lyotropic liquid crystals. The size and density of these domains grow with further compaction, and their orientation favors either perpendicular or parallel to the radial direction. Ordering is also identified near the core with an arbitrary orientation, exemplary of the spontaneous symmetry breaking.
pacs:
42.30.Wb, 89.75.Fb, 89.75.KdCrumpling is capable of producing a highly rigid structure with a record minimum of material. Every child knows how to make a baseball out of a crumpled newspaper. Even with the assistance of a dutiful parent, its interior shall remain roughly 80% vacantNeil1 . In addition to this application, equally fascinating and puzzling phenomena related to crumpling abound in a wide range of length scales, for instance, how DNA is packed in the tiny capsule of virusesDNA or the practical challenge for the auto industry to come up with a better design to protect the safety of drivers during car accidentscar_crash .
The enormous resistance of a crumpled ball can be attributed to the geometrical constraint and the self-avoidance. The former refers to the inevitable development of D-cones due to the unstretchability of a thin sheetWitten07 ; single . However, beyond the geometric and mechanical properties of a single and two-cone interactiondouble , collective behavior of the microstructures such like ridges and vertices remains unexplored. Previous simulationsGompper have identified the phantom and self-avoiding sheets as belonging to different universality classes because the universal exponent of their force-size relation is differernt. To clarify the effect of self-avoidance, x-ray tomography becomes highly desired because it enables us to study the evolution of the internal structure systematically and perform calculations with its dataCream_layer ; tomography .
It is knownWitten07 that the macroscopic properties are shaped more by the collective behavior rather than individual ridges and vertices. This is because these singularities are linked by not just the tensile force and bending rigidity, but also correlated by the strong hard core interactionGompper ; Timonen . When a flat sheet is subject to a gentle force, the first deformation due to the buckling is of a conical shapeTimonen2 . As the compaction progresses, the single cone deformation is followed by a large number of ridges and verticesNeil1 , while the facets they encircle also begin to align. In this Letter, we present the first systematic analysis of the local and global structural ordering inside the crumpled aluminum ball. An algorithm is developed to trace out the curves in x-ray tomography and reconstruct the cross-section view without destroying the sample. Through the buckling and ordering, we study how they accumulate and affect the final configuration in this highly non-Markov process.
Nine sheets of aluminum foil with different diameter (= 3, 4, 5, 6, 6.5, 7, 8, 9, 10) are randomly folded by hand first and then squeezed by the flat tip tweezer at different directionsBalankin1 into balls of the same final radius 1.5 . To determine whether they still belong to the thin sheet regime, we calculate their Foppl-von Karman numberWitten07 , where is the Poisson ratio and is the thickness of the foil. Ranging from to , they turn out to be of the same order as in previous workGompper ; Timonen ; Timonen2 ; Neil1 .
A special version of microtomography is employed, based on the high intensity x-ray from synchrotronhwu1 . It provides a standard resolution between 1-2 m which shows clear reconstructed images for our analysis. The experiment is performed at the 01A beamline of National Synchrotron Radiation Research Center in Taiwan. The beamline provides unmonochromatic x-rays whose energy distribution is 8-15 keV. Image acquisition time per projection is about 10ms, which is captured by a CCD with 2X optical lens focused on a CdWO4 single crystal scintillator. The resulted reconstruction consists of a data matrix of 120012001200 pixels of size 3 m.
To study the packing configuration quantitatively, it is necessary to vectorize the data points. This segmentation method is complex and case-dependentpath . The most challenging part in tracing the crumpled surface is to distinguish two contact planes. According to previous workEric which concluded that cross sections through different angles share the same statistics, we are assured that each of these cross sections is representative of the bulk configuration. Therefore, we can focus on the development of 2D tracing algorithm and present its result as a precursor for a full 3D construction from these images.
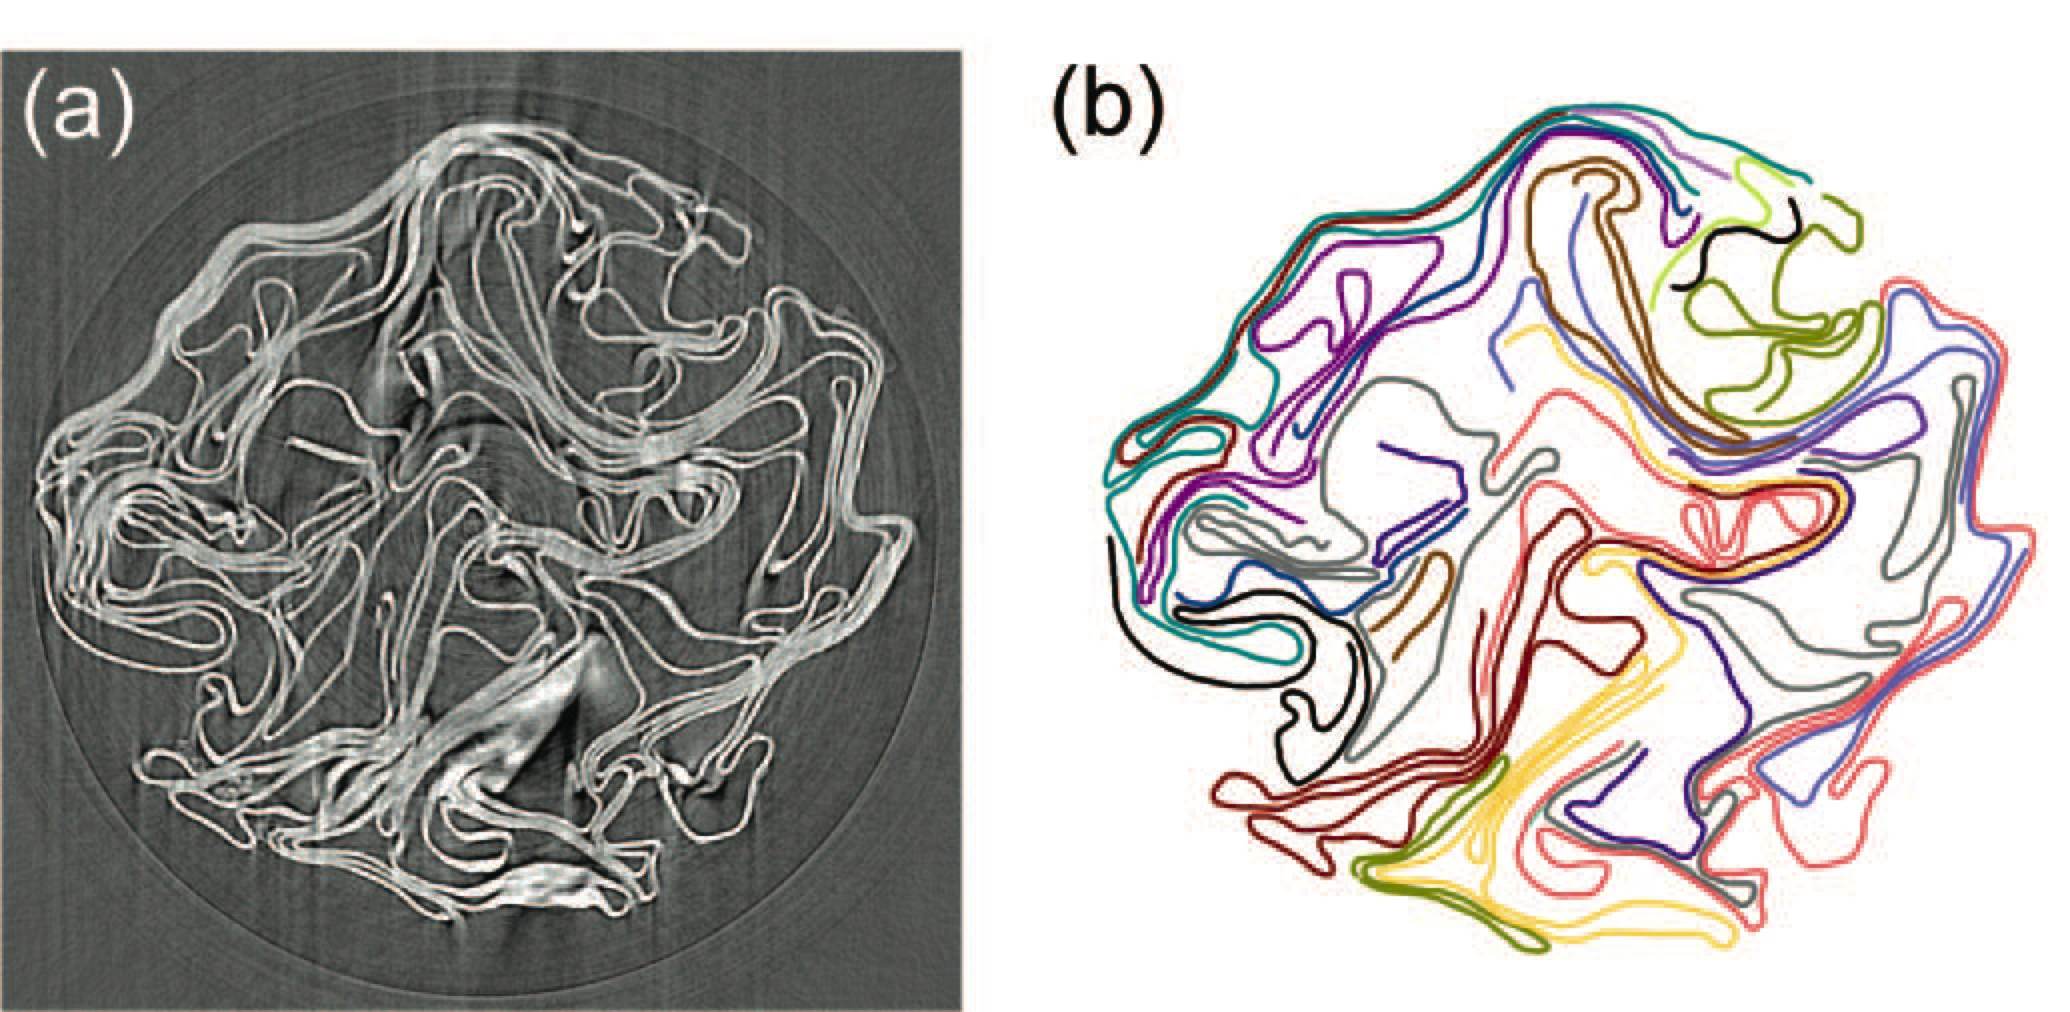
After all the images have been reconstructed into 3D data matrices, we resample three perpendicular cross sections which are X-Y, Y-Z, Z-X planes of the sample. Briefly, the procedures of tracing algorithm are mainly divided into three parts: random seeding, identifying solutions, and labeling traced points. We start with a circle around the seed point with an radius of 24 pixels, and then find all crossing points between its perimeter and the paths. Since many paths can be close to each other, multiple solutions frequently occur. When this happens, we select the point that is joined to the seed point from all candidate solutions. The traced points are marked immediately to avoid double tracing with the forest-fire simulation. After all the points have been vectorized, we perform a high order Beizer fitting to resample the segmented points to reduce irregularities and increase the sampling rate, see Fig.1. A more detailed description of the tracing algorithm and segmented images can be found in the online supplemental documentpath .
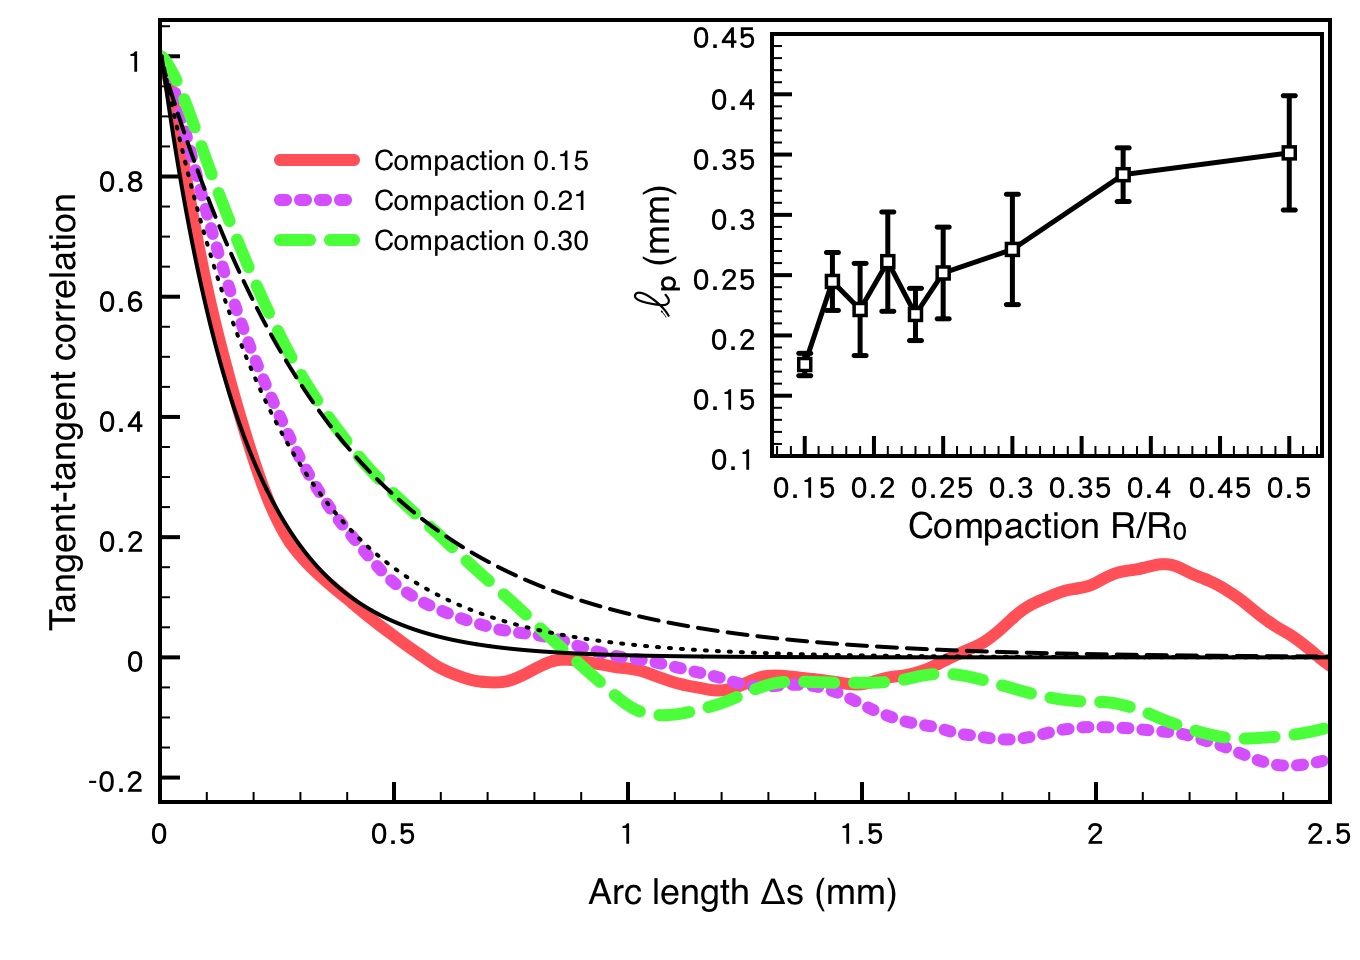
We start by calculating the tangent-tangent correlation function which is a basic statistical property related to the bucklingsemi of sheets. This function is defined as , where is the tangent vector at arc length in the curvilinear coordinate and is the position vector. It can be simplified to if the system exhibits translational invariance. This assumption was checked quantitatively to hold except at the end points where the fluctuations become large.
The function is found to decay exponentially in Fig.2 with an effective persistence length . This decay form can be derived from the random packing of facets. Borrowing the concept of tube model for polymersGennes , one can think of the sheet as moving inside two walls which model the confinement due to the hard core interaction from its neighboring portions of sheet. When we cut perpendicularly through the walls, the cross section will reveal a wiggling path with a static configuration similar to that of a polymer in the tube model. However, it should be noted that their dynamics are different because the path is, afterall, a projection of a 2D sheet. The movement of each segment needs to coordinate with the rest of the sheet, unlike the reptation model in which the polymer is confined in all sidewise directions by a static tube. The spacer width apparently decreases as we increase the crumpling force. Dividing this width by the segment length of the path gives the maximum angle between neighboring segments. Roughly, we can imagine the configuration as being mapped out by a random walk with a fixed stride but only two choices of angular deviations, . Then the probability of finding the relative angle between the th and zeroth segments equaling obeys the Gaussian distribution for a random walk after steps: . The function can be explicitly evaluated:
where . The inset of Fig.2 shows that shortens as decreases, which implies the crumpled structure becomes more disordered along the curvilinear direction. This observation also requires that the segment length not only depends on the bending rigidity of the material, but can be cut short by the compact packing.
The concept of an effective persistence length is similar to that in polymersGennes and the de Gennes coherence length in membranescoherence . However, different from the latter two cases, our crumpled ball is so macroscopicEdwards theory that the thermal temperature becomes irrelevant. Instead, it is the noise from the random folding that allows the sheet to appear rumpled. This zero-temperature randomizing effect also exists in the granular systemsEdwards .
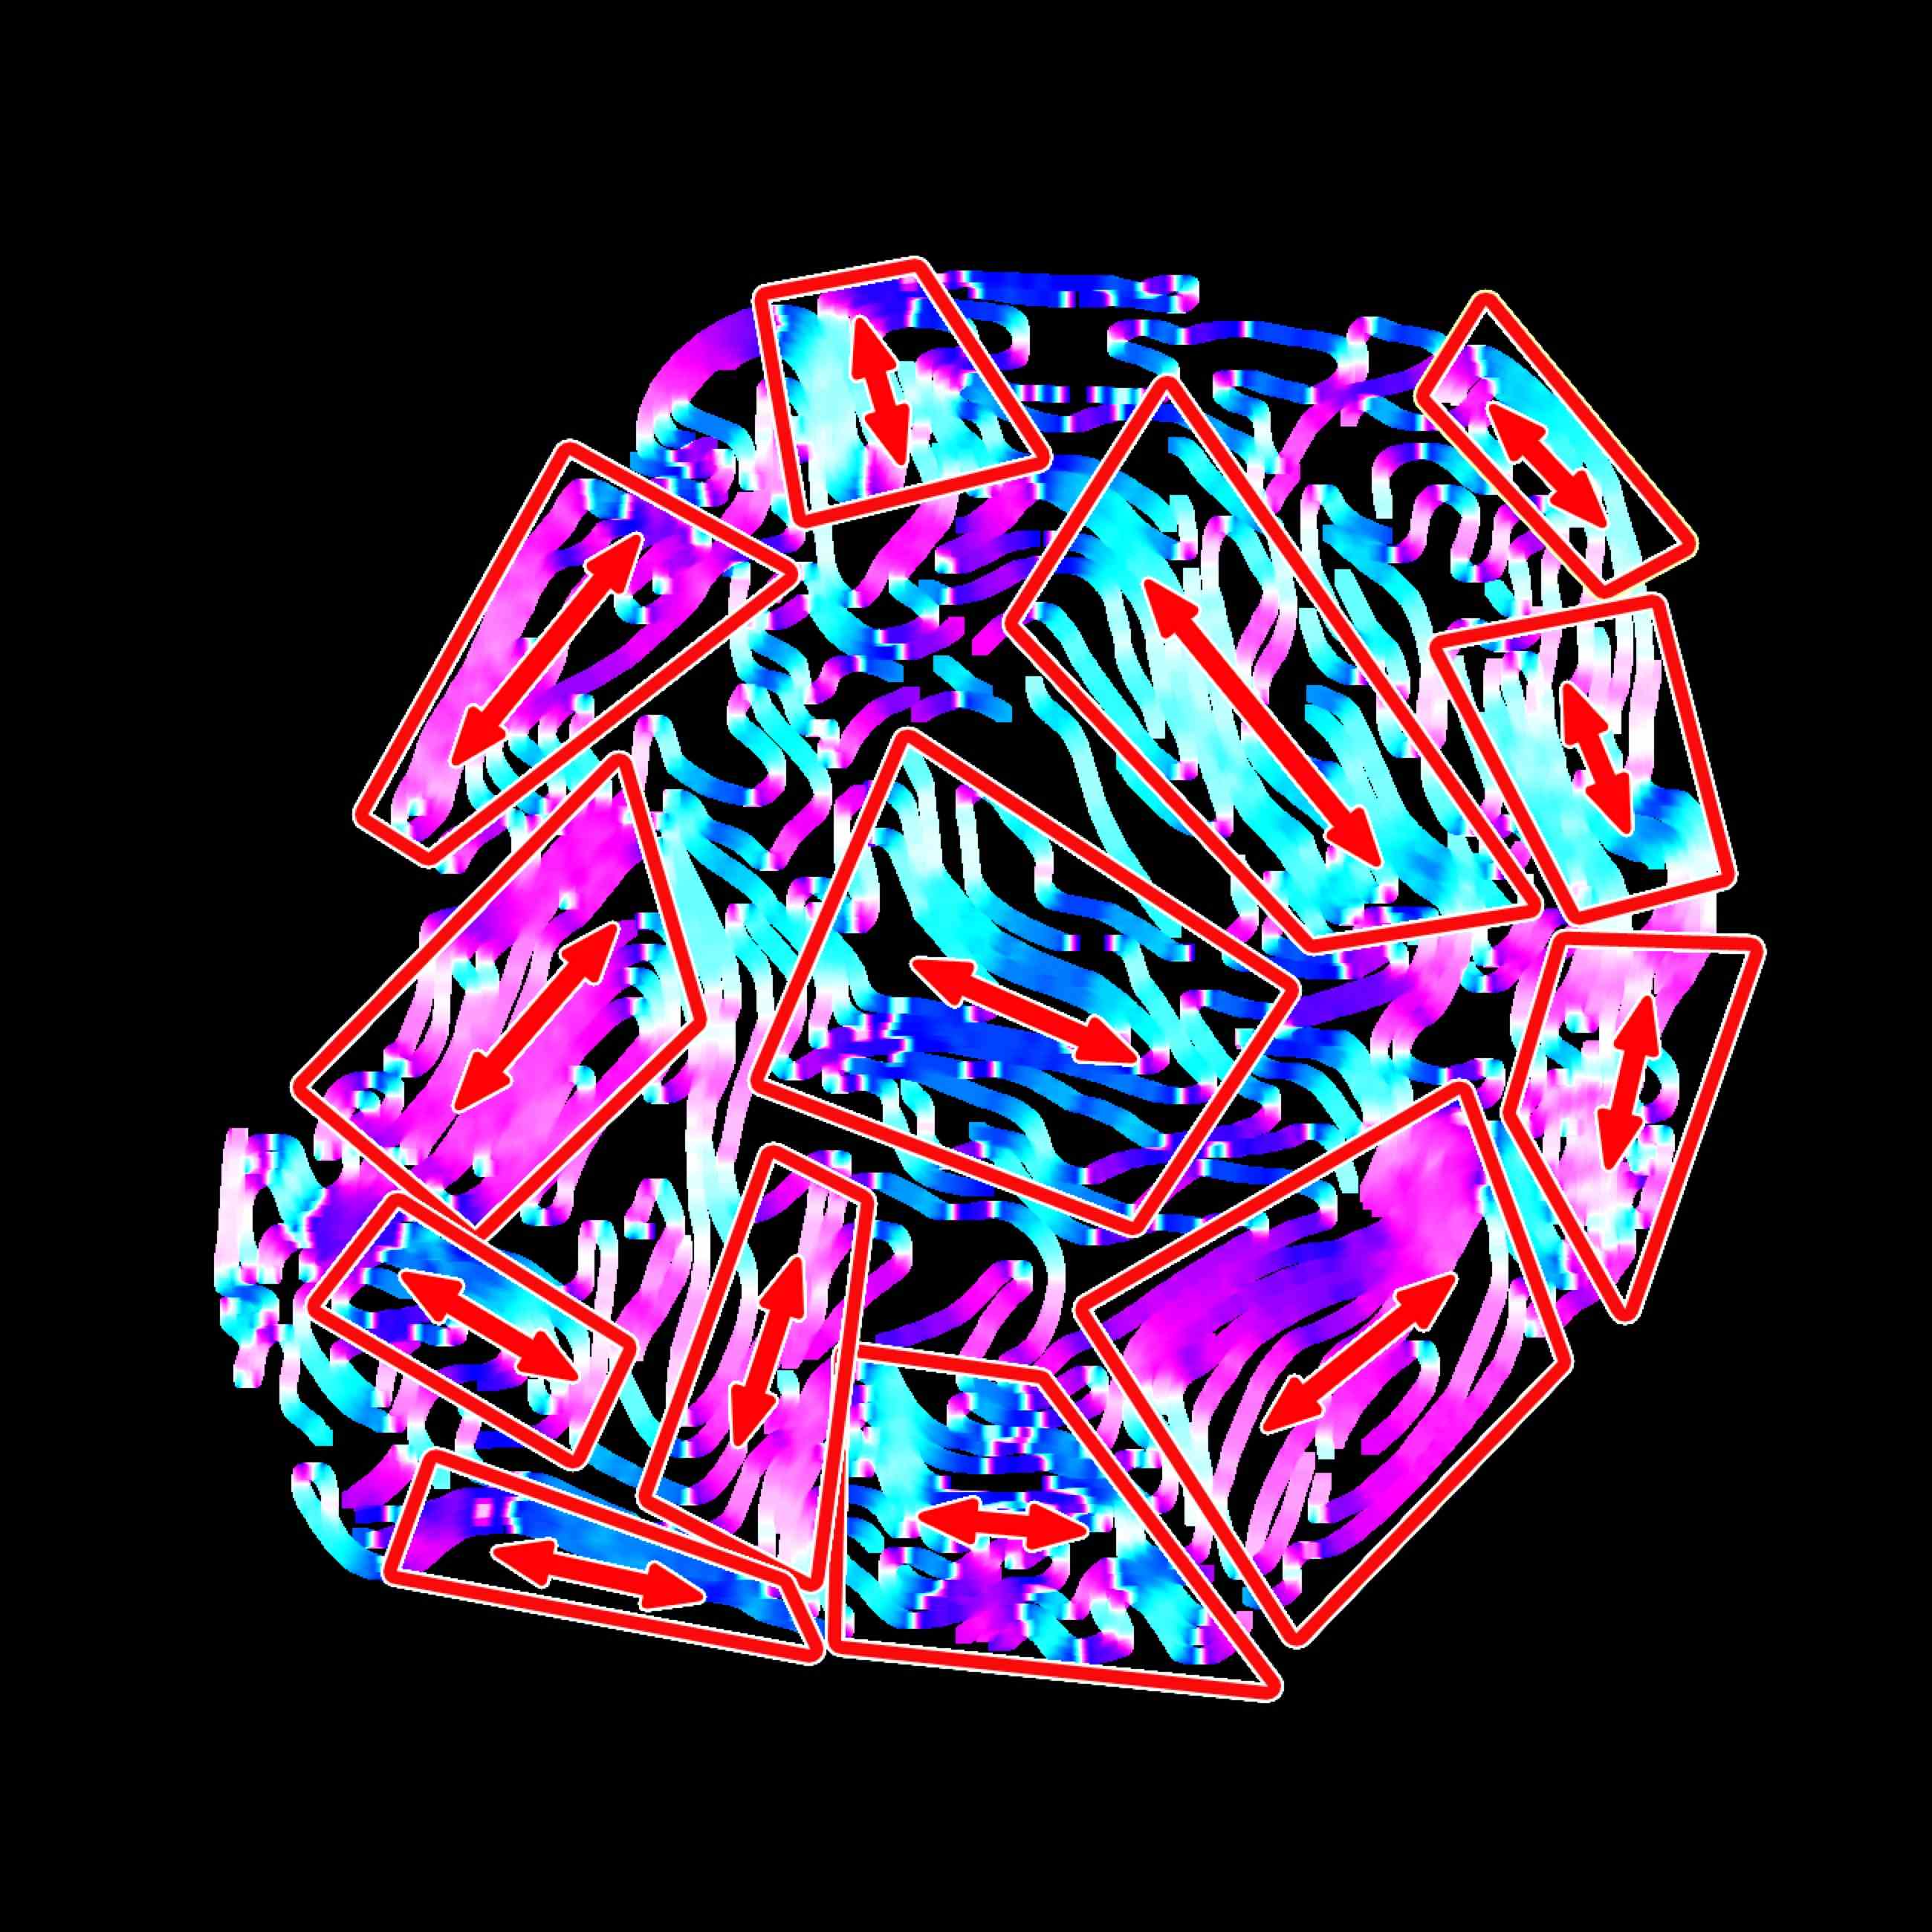
After calculating the order along the curvilinear coordinate, we turn to the cartesian plane. Note that locally ordered structures can be identified in Fig.1. The paths in the plane, which cut through the facets in the 3-D sample, show a tendency to align and form lamella-like phase. We can separate the ordered portion from the disordered one to define crystalline and amorphous regions. This classification is aided by the vectorized data. In Fig.3, all paths are denoted by different colors and brightnesses in grayscale to indicate different orientation to the direction. The neighboring facets with the same orientation are marked with the same color, and can be easily recognized as a lamella. To extract the domain boundaries, the Laplacian of the color brightness was first calculated with the local maxima signalizing the location of the divisions. Although the distribution of lamellae can in principle be derived by this method, manual identifications are still required when the color gradient is too noisy. Therefore, we use the quadrangles to label all lamellae with the reference of Laplacian field to obtain the data with a coherent format.
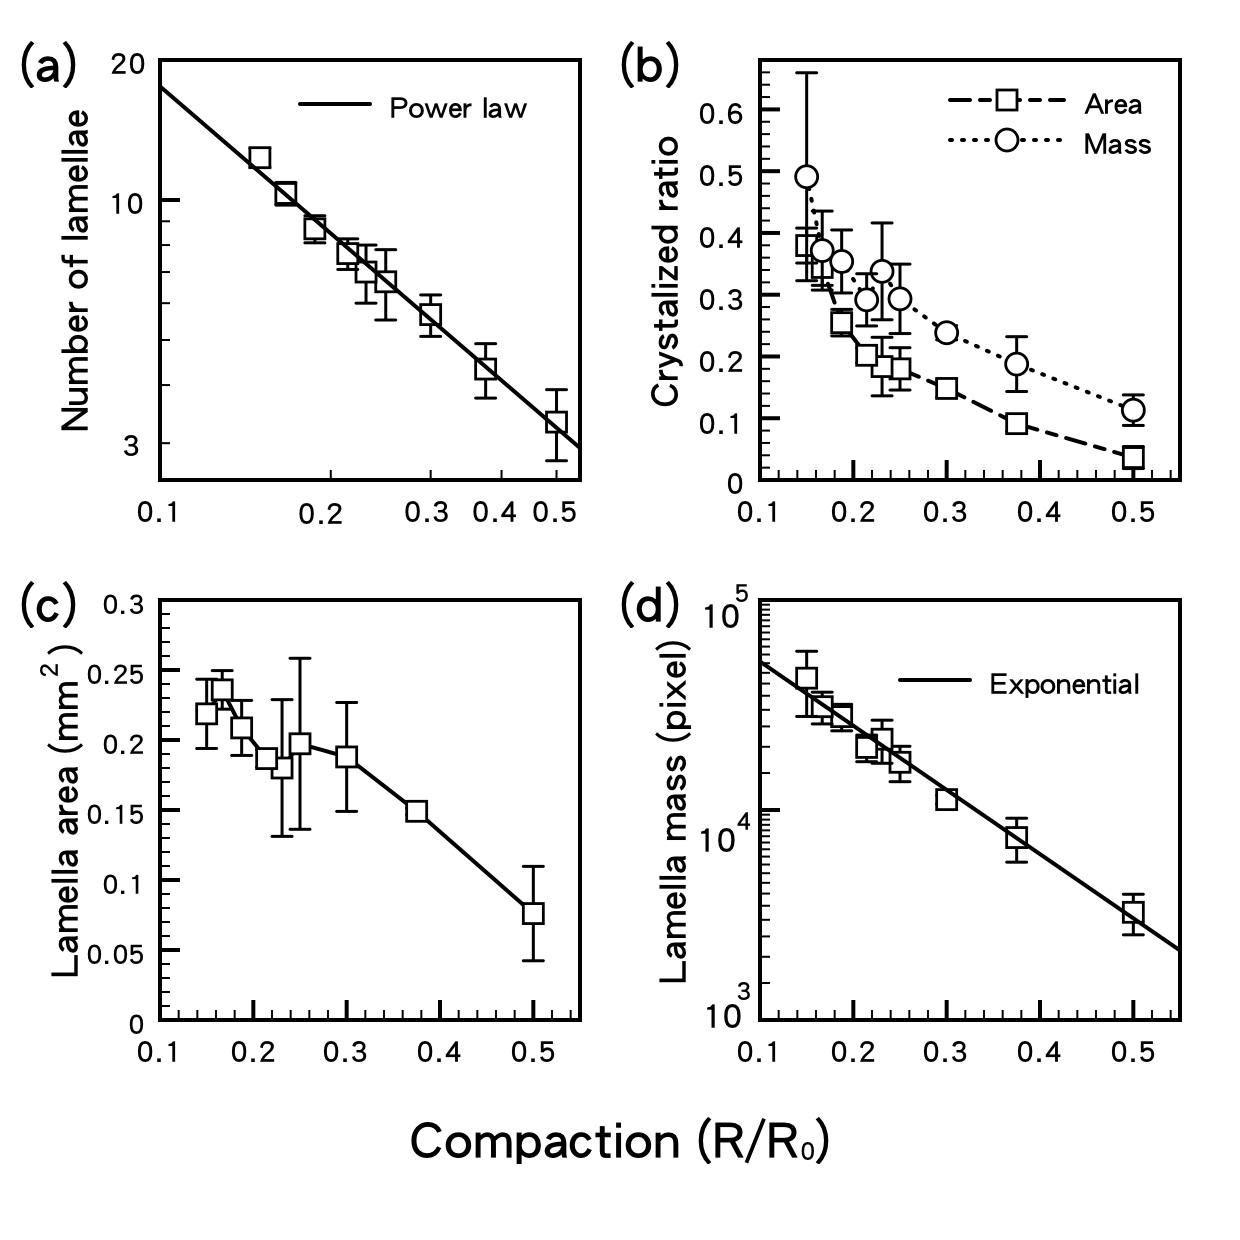
Using the data averaged over three perpendicular cross sections for each sample, we calculate four essential properties of the lamellae: their number, ratio of total area and mass they covered in the cross section, their size, and the mass encompassed in each lamella. We checked that the product of data in panels (a) and (c) equaled the area ratio in (b) times the cross section area, . Figure 4 shows that they all increase as decreases. Panel (a) indicates the number of lamellae is inversely proportional to . Two features are worth noting in (b): Firstly, the reason why the two lines are not plainly proportional is that the total mass grows as we fix and increase to achieve lower . In contrast, total area is unchanged. Furthermore, the alignment allows for more efficient packing inside the domain which explains why the mass ratio is larger. Secondly, both ratios never exceed 0.5. This is similar to supercooled liquid where the extent of ordering is hindered from being completeglass . One may wonder how a structure with so much amorphous region can be so hard. A possible explanation is that these ordered domains near the boundary interlock and act like a hard crust. Each domain consists of many aligned layers which greatly enhance the bending rigidity and make them more resistant to buckling.
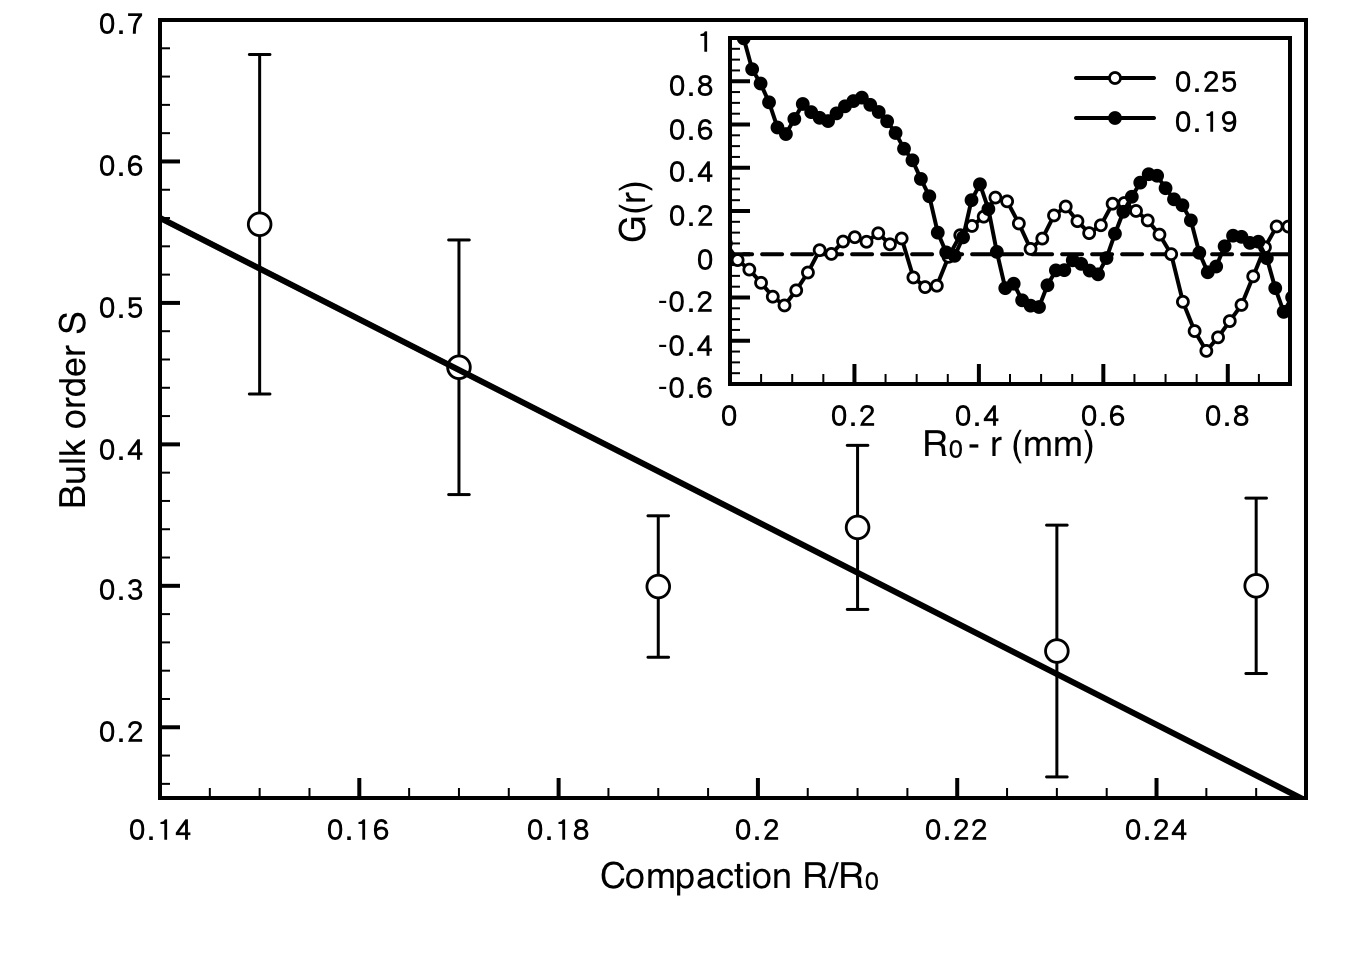
In the previous workJennifer that demonstrates a spontaneous patterning in vibrated rods, a wall-rod correlation function was defined to extract the size of the core or bulk area, where denotes averaging over and is the angle between the tangent vectors at point () and the boundary in the direction. We repeat the same definition to study the packing configuration near the core and plot the results in the inset of Fig.5. Since the external force acts from outside, it is natural that the correlation with the boundary decreases as we enter the core. The division between the bulk and shell regions is marked by the first vanishing of . Again, following the notation of Jennifer , an order parameter = is defined for the bulk where is the angle between the tangent vector and lamella direction of the bulk. We are surprised to find a spontaneous bulk ordering in Fig.5 where correlations with the boundary layer have considerably weakened. As decreases, the bulk order increases. The ordered phase induced by high concentration is similar to that happened in Jennifer and lyotropic liquid crystals. According to Onsageronsager , although parallel arrangements of anisotropic objects lead to a decrease in orientation entropy, there is a gain in positional entropy. Thus, a positional order is expected to become entropically favorable at sufficient rod concentrations.
Given that the deformations in aluminum are plastic and irreversible, crumpling can be viewed as a series of quenching process since not all configurations are accessible, nor equally probable. The noise introduced by the random folding still enables the sheet to slightly adjust its configuration to seek a local potential minimumET . This random process plays the role of vibration in the spontaneous patterning of vibrated rodsJennifer and slow shearing in granular systemsEdwards ; Makse . Since this large amount of facets are not only correlated by the sheet but also interact strongly via the bending potential, the geometrical constraint forbids our crumpled sheet from reaching the true ground staterod . Consequently, the bulk order parameter of our compact sample is still much lower than that of vibrated rodsJennifer .
In conclusion, we performed x-ray tomography to quantitatively study the inner structure of aluminum foils at different compactions. All paths in the three perpendicular cross sections are traced out and vectorized before calculating the statistical properties of their packing configuration. The tangent-tangent correlation of the path reveals an effective persistence length that decays with the compaction. A second length scale associated with the size of domains that emerges near the crust and mimics the lamella phase in lyotropic liquid crystals. Number of these domains and their area and mass grow monotonically with the compaction, and their orientation favors either perpendicular or parallel to the radial direction. We also identified an ordered domain near the core of the crumpled ball with an arbitrary orientation, exemplary of the spontaneous symmetry breaking.
We benefit from fruitful discussions with A. S. Balankin and Peilong Chen. Support by the National Science Council in Taiwan under Grant No. 95-2112-M007-046-MY3 and 98-2112-M007-005-MY3 is acknowledged.
References
- (1) Y. C. Lin, Y. L. Wang, Y. Liu and T. M. Hong, Phys. Rev. Lett. 101, 125504 (2008).
- (2) J. Kindt, S. Tzlil, A. Ben-Shaul and W. M. Gelbart, Proc. Natl. Acad. Sci. USA 98, 13674 (2001); C. R. Locker, S. D. Fuller, and S. C. Harvey, Biophys. J. 93, 2861 (2007).
- (3) E. Martinez, D. Tyrrell and J. Zolock, Proc. of ASME/IEEE Joint Railroad Conference (2003).
- (4) T. A. Witten, Rev. Mod. Phys. 79, 643 (2007).
- (5) S. Chaieb, F. Melo and J.-C. Gminard, Phys. Rev. Lett. 80, 2354 (1998).
- (6) E. Cerda, S. Chaieb, F. Melo and L. Mahadevan, Nature (London) 401, 46 (1999).
- (7) G. A. Vliegenthart and G. Gompper, Nature Mater. 5, 216 (2006).
- (8) Y. C. Lin, J. M. Sun, H. W. Yang, Y. K. Hwu, C. L. Wang, and T. M. Hong, Phys. Rev. E (accepted).
- (9) M. A. F. Gomes, C. C. Donato, S. L. Campello, R. E. de Souza, and R. Cassia-Moura, J. Phys. D 40, 3665 (2007).
- (10) T. Tallinen, J. A. strm and J. Timonen, Nature Mater. 8, 25 (2009).
- (11) T. Tallinen, J. A. strm and J. Timonen, Phys. Rev. Lett. 101, 106101 (2008).
- (12) This method was tested to give reliable and reproducible data by A. S. Balankin, I. C. Silva, O. A. Martnez and O. S. Huerta, Phys. Rev. E 75, 051117 (2007).
- (13) Y. Hwu, W. L. Tsai, A. Groso, G. Margaritondo and J. H. Je, J. Phys. D 35, R105 (2002).
- (14) For more technical details, see EPAPS Document No. [to be inserted by publisher] and our website at http://140.114.80.182/tomo/index.html.
- (15) E. Sultan and A. Boudaoud, Phys. Rev. Lett. 96, 136103 (2006).
- (16) Ya Liu and Bulbul Chakraborty, Phys. Biol. 5, 026004 (2008).
- (17) P. G. de Gennes, Scaling Concepts in Polymers Physics (Cornell University Press, Ithaca, NY, 1979).
- (18) P. G. de Gennes and C. Taupin, J. Phys. Chem. 86, 2294 (1982).
- (19) A. M. Gupta and S. F. Edwards, J. Chem. Phys. 98, 1588 (1993); T. Koga and S. F. Edwards, ibid. 120, 8283 (2004). For an application to granular materials, see S. F. Edwards in Granular Matter: An Interdisciplinary Approach, ed. A. Mehta (Springer, N.Y., 1994) page 121.
- (20) S. F. Edwards and R. B. S. Oakeshott, Physica A 157, 1080 (1989); A. Mehta and S. F. Edwards, ibid. 157, 1091 (1989).
- (21) P. G. de Gennes and J. Prost, The Physics of Liquid Crystals, 2nd ed. (Clarendon Press, Oxford, 1993).
- (22) A. S. Balankin and O. S. Huerta, Phys. Rev. E 77, 051124 (2008).
- (23) J. Galanis, D. Harries, D. L. Sackett, W. Losert and R. Nossal, Phys. Rev. Lett. 96, 028002 (2006).
- (24) L. Onsager, Ann. N.Y. Acad. Sci. 51, 627 (1949); C. C. Mounfield and S. F. Edwards, Physica A 210, 279 (1994).
- (25) S. Deboeuf, M. Adda-Bedia and A. Boudaoud, Europhys. Lett. 85, 24002 (2009).
- (26) P. Wang, C. Song and H. A. Makse, Nat. Phys. 2, 526 (2006); C. Song, P. Wang, and H. A. Makse, Proc. Natl. Acad. Sci. USA 102, 2299 (2005).
- (27) Laurent Boue and Eytan Katzav, Europhys. Lett. 80, 54002 (2007).