Quantitative Verification of a Force-based Model for Pedestrian Dynamics
Abstract
This paper introduces a spatially continuous force-based model for simulating pedestrian dynamics. The main intention of this work is the quantitative description of pedestrian movement through bottlenecks and in corridors. Measurements of flow and density at bottlenecks will be presented and compared with empirical data. Furthermore the fundamental diagram for the movement in a corridor is reproduced. The results of the proposed model show a good agreement with empirical data.
1 Introduction
One application of pedestrian dynamics is the enhancement of the safety of people in complex buildings and in big mass events e.g., sporting events, religious pilgrimages, etc. where there is a risk of disaster. Thanks to computer simulations, it is possible to forecast the emergency egress and optimise the evacuation of large crowds. Another aspect of pedestrian dynamics is the comfort of passengers in pedestrian facilities e.g., airports, railway stations, shopping malls, etc. Those facilities have to be designed in a way to ensure minimal travel times and maximal capacities. For these applications, robust and quantitatively validated models are necessary.
A wide spectrum of models have been designed to simulate pedestrian dynamics. Generally those models can be classified into macroscopic and microscopic models. In macroscopic models the system is described by mean values of characteristics of pedestrian streams e.g., density and flow, whereas microscopic models consider the movement of individual persons separately. Microscopic models can be subdivided into several classes e.g., rule-based and force-based models. For a detailed discussion we refer to Schadschneider2009a . In this work we focus on spatially continuous force-based models.
Force-based models take Newton’s second law of dynamics as a guiding principle. Thus, the movement of each pedestrian is defined by:
| (1) |
where denotes the repulsive force from pedestrian acting on pedestrian , is the repulsive force emerging from borders and is a driving force. is a constant with dimensions of mass and the number of neighbouring pedestrians. Repulsive forces model the collision-avoidance performed by pedestrians. Whereas the driving force models the intention of a pedestrian to move to some destination. The set of equations (1) for all pedestrians results in a high-dimensional system of second order ordinary differential equations. The time evolution of the positions and velocities of all pedestrians is obtained by numerical integration.
Most force-based models describe the movement of pedestrians qualitatively well. Collective phenomena like lane formations Helbing1995 ; Helbing2004 ; Yu2005 , oscillations at bottlenecks Helbing1995 ; Helbing2004 , the “faster-is-slower” effect Lakoba2005 ; Parisi2007 , clogging at exit doors Helbing2004 ; Yu2005 etc. are reproduced. These achievements indicate that these models are promising candidates. However, a qualitative description is not sufficient if reliable statements about critical processes, e.g., emergency egress, are requested. Moreover, implementations of models do not rely on one sole approach. Especially in high density situations simple numerical treatment has to be supplemented by additional techniques to obtain reasonable results. Examples are restrictions on state variables and sometimes even totally different procedures replacing the above equations of motion (1) to avoid partial and total overlapping among pedestrians Lakoba2005 ; Yu2005 or negative and high velocities Helbing1995 .
We address the possibility of describing reasonably and in a quantitative manner the movement of pedestrians, with a modelling approach as simple as possible. For a systematic verification of our model we measure the fundamental diagram, the flow through bottlenecks and the density inside and in front of the entrance of a bottleneck. In the next section, we propose such a model which is solely based on the equation of motion (1). Furthermore the model incorporates free parameters which allow calibration to fit quantitative data.
2 Definition of the model
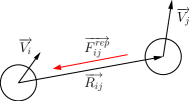
Our model is based on the Centrifugal Force Model (CFM) Yu2005 . The CFM takes into account the distance between pedestrians as well as their relative velocities. Pedestrians are modelled as circles with constant diameter. Their movement is a direct result of superposition of repulsive and driving forces acting on the centre of each pedestrian. Repulsive forces acting on pedestrian from other pedestrians in their neighbourhood and eventually from walls, stairs, etc. to prevent collisions and overlapping (Fig. 1). The driving force, however, adds a positive term to the resulting force, to enable movement of pedestrian in a certain direction with a given desired speed . The mathematical expression of the driving force as introduced initially in Helbing1995 is used:
| (2) |
with a time constant .
The definition of the repulsive force in the CFM expresses several principles. First, the force between two pedestrians decreases with increasing distance. In the CFM it is inversely proportional to their distance. Given the position of two pedestrians and , the direction vector between their centers is defined as:
| (3) |
Furthermore, the repulsive force takes into account the relative velocity between pedestrian and pedestrian . The following special definition provides that slower pedestrians are not affected by the presence of faster pedestrians in front of them:
| (4) |
As in general pedestrians react only to obstacles and pedestrians that are within their perception, the reaction field of the repulsive force is reduced to the angle of vision of each pedestrian (), by introducing the coefficient:
| (5) |
With the definitions in Eqs. (3), (4) and (5), the repulsive force between two pedestrians is formulated as:
| (6) |
In Chraibi2009a it was shown that the introduction of a “collision detection technique” (CDT), see Yu2005 for the definition, is necessary to mitigate overlapping among pedestrians.
In the following, we will discuss why volume exclusion is not guaranteed by Eq. (6) and meanwhile introduce our modifications of the repulsive force. Due to the quotient in Eq. (6) when the distance is small, low relative velocities lead to an unacceptably small force. Consequently, partial or total overlapping are not prevented. Introducing the intended speed in the numerator of the repulsive force eliminates this side-effect. Furthermore, the modified repulsive force and driving force (2) compensate at low velocities, which damps oscillations.
Since faster pedestrians require more space than slower pedestrians, due to increasing step sizes Seyfried2006 , the diameter of pedestrian depends linearly on its velocity:
| (7) |
with free parameters and . We define the distance between pedestrian and pedestrian as:
| (8) |
By taking these aspects into account, the definition of the modified repulsive force reads
| (9) |
where is a parameter which adjusts the strength of the force. Due to these changes we can do without the extra CDT which dominates the dynamics in Yu2005 in case of formation of dense crowds.
The repulsive force between two pedestrians and is infinite at contact and decreasing with increasing distance between and . Since the repulsive force as defined in Eq. (9) does not vanish, the summation over all other pedestrians leads to a complexity of . To deal with this problem and to consider a limited range of pedestrian interaction only the influence of neighbouring pedestrians is taken into account. Two pedestrians are said to be neighbours if their distance is within a certain cut-off radius . To guarantee robust numerical integration a two-sided Hermite-interpolation of the repulsive force is implemented (see Fig. 2).
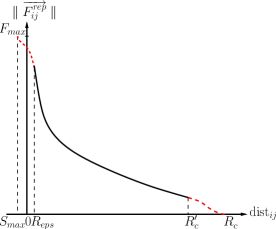
The interpolation guarantees that for each pair , with a distance in the interval the norm of the repulsive force between them decreases smoothly to zero. is set to . For distances in the interval the interpolation avoids an increase of the force to infinity, to reach a maximum value of . is set to and to .
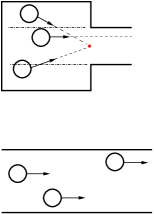
The desired direction of a pedestrian is set to be parallel to the walls of the corridor. In the bottleneck case it is set towards the centre of the entrance to the bottleneck if the pedestrian is outside the range of the bottleneck. That is if he can not “see” the exit of the bottleneck. Otherwise, the desired direction is chosen parallel to the length of the bottleneck (Fig. 2).
3 Simulation results
The initial value problem (1) was solved using an Euler scheme with fixed-step size s. The desired speeds of pedestrians are Gaussian distributed with mean and standard deviation . The constant in Eq. (2) is set to . For simplicity, the mass, is set to unity. Several parameter values were tested. The free parameters in Eqs. (9) and (7) are set to , . With this parameter set the results of the simulations are in good agreement with empirical data.
To verify the ability of the model to reproduce the fundamental diagram, measurements in corridors of different widths were performed. The length of the corridor is and its width is .
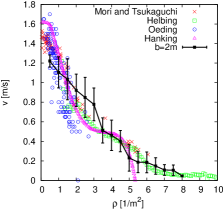
The shape of the reproduced velocity-density relation is in good agreement with the empirical data Mori1987 ; Helbing2007 ; Oeding1963 ; Hankin1958 , see Fig. 3).
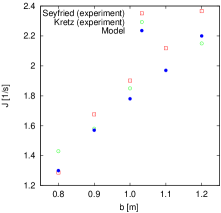
Furthermore, the flow of pedestrians through the bottleneck as described in Seyfried2009b was simulated. The width of the bottleneck was changed from m to m in steps of m (Fig. 3).
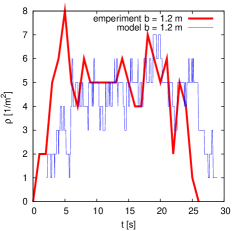
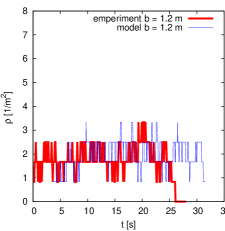
A third validation comes from measurements of density inside the bottleneck as well as in front of the entrance to the bottleneck. The density in front of the entrance to the bottleneck is presented in Fig. 4(a). The results are in good agreement with the experimental data in Seyfried2009b . Additionally, the measured density values inside the bottleneck are in accordance with the published empirical results in Rupprecht2007 , see Fig. 4(b). One remarks that the density in front of the bottleneck is much higher than the density in the bottleneck. This difference reflects typical dynamics at bottlenecks, which is reproduced by our model.
4 Conclusions
We have proposed modifications of a spatially continuous force-based model Yu2005 to describe quantitatively the movement of pedestrians in 2D-space. Besides being a remedy for numerical instabilities in CFM the modifications simplify the approach of Yu et al. Yu2005 since we can dispense with their extra “collision detection technique” without deteriorating performance. The implementation of the model is straightforward and does not use any restrictions on the velocity. Simulation results show good agreement with empirical data. Nevertheless, the model contains free parameters that have to be tuned adequately to adapt the model to a given scenario. Further improvement of the model could be made by including, for example, a density dependent repulsive force.
Acknowledgement
The authors are grateful to the Deutsche Forschungsgemeinschaft (DFG) for funding this project under Grant-Nr.: SE 1789/1-1.
References
- (1) Schadschneider A, Klingsch W, Klüpfel H, Kretz T, Rogsch C, Seyfried A (2009) Evacuation Dynamics: Empirical Results, Modeling and Applications. In: Meyers R A (ed.) Encyclopedia of Complexity and System Science. p. 3142-3176. Springer, Berlin Heidelberg
- (2) Helbing D, Molnár P (1995) Phys. Rev. E 51:4282–4286
- (3) Helbing D (2004) Computational Materials Science 30:180–187
- (4) Yu W J, Chen L Y, Dong R, Dai S Q (2005) Phys. Rev. E 72(2):026112
- (5) Lakoba T I, Kaup D J, Finkelstein N M (2005) Simulation 81:339–352
- (6) Parisi D R, Dorso C O (2007) Physica A 385(1):343–355
- (7) Chraibi M, Seyfried A, Schadschneider A, Mackens W (2009) Quantitative Description of Pedestrian Dynamics with a Force-based Model. In: IEEE/WIC/ACM International Joint Conference on Web Intelligence and Intelligent Agent Technology. p 583-586, vol 3
- (8) Seyfried A, Steffen B, Lippert T (2006) Physica A 368:232–238
- (9) Mori M, Tsukaguchi H (1987) Transp. Res. 21A(3):223–234
- (10) Helbing D, Johansson A, Al-Abideen H Z (2007) Phys. Rev. E 75:046109
- (11) Oeding D (1963) Verkehrsbelastung und Dimensionierung von Gehwegen und anderen Anlagen des Fußgängerverkehrs. Forschungsbericht 22, Technische Hochschule Braunschweig
- (12) Hankin B D, Wright R A (1958) Operational Research Quarterly 9:81–88
- (13) Seyfried A, Steffen B, Winkens T, Rupprecht A, Boltes M, Klingsch W (2009) Empirical data for pedestrian flow through bottlenecks. In Appert-Rolland C, Chevoir F, Gondret P, Lassarre S, Lebacque J P, Schreckenberg M (eds) Traffic and Granular Flow ’07. p. 189-199. Springer, Berlin Heidelberg
- (14) Rupprecht T, Seyfried A, Klingsch W, Boltes M (2007) Bottleneck capacity estimation for pedestrian traffic. In Proceedings of the Interflam 2007. p. 1423-1430. Intersience
- (15) Seyfried A, Rupprecht T, Passon O, Steffen B, Klingsch W, Boltes M (2009) Transportation Science 43:395–406