A long and homogeneous optical monitoring of the ’naked-eye’ burst
GRB 080319B with the Palomar-60 telescope
Abstract
GRB 080319B is one of the brightest and most extensively sampled bursts. It has good coverage at many wavelengths. Here we present the optical observations of the Palomar 60 inch telescope, which spans a long time interval after the burst. We augment the optical dataset with freely available Swift BAT and XRT observations reduced by us. We also compare our conclusions with the published parameters from the rich literature about this burst.
I Introduction
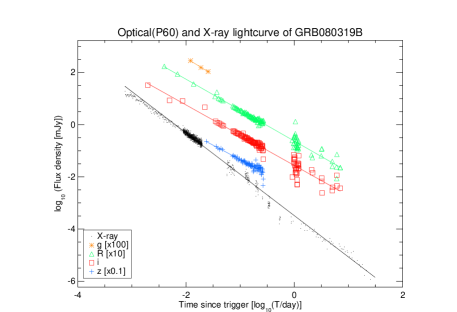
This is a Swift triggered burst and had a favorable position for early optical follow-up. Its redshift is z=0.937 P60 observations started at s and lasted for about days. The main optical data set was observed with four filters with the Palomar - 60 inch telescope. We revisit GRB080319B Palomar data, after it was published in part in Cenko et al. (2009). BAT and XRT data was obtained from the Swift websites. Reduction was carried out with the standard calibrating pipelines batgrbproducts and xrtpipeline. The most recent calibration files were used. We also made use of the count data at the XRT repository (Evans et al., 2007) and we used the count-to-flux-density conversion factor of Butler and Kocevski (2007).
II Optical data reduction
The quick fading nature and in general the low average brightness of the GRB optical transients did not glow the automated (pipeline) reduction method, in the case of the ”naked eye burst” oppositely the quite high brightness was the biggest problem. The shortcoming of automated methods are the difficulty in:
-
•
judging when to change from photometry of individual CCD frames to photometry of Co-added images
-
•
selecting the most reliable good seeing and good limiting magnitude frames
-
•
selecting the best set of comparison stars both in alignment and brightness range.
Due to these problems and the various alignment of the neighbor objects,
the most reliable and the quickest way we found is the individual photometry
of the individual frames. In the present work therefore we choose the sturdy
aperture photometric method, allowing us to reach our goal in the quickest way.
When should we change from the photometry of the individual CCD frames to the
photometry of the co-added images.
The selection of the most reliable, good seeing, good limiting magnitude
frames is much easier in a manual way.
Selecting the best set of comparison stars both in alignment and brightness
range is easier and quicker.
The non uniform nature of the optical CCD frames, twilight, dawn, Moon, bright
objects nearby, focusing problems, filter inhomogeneities etc. are the
heaviest arguments beside our choice.
Therefore in view of the relatively small amount of observational data,
the advantage of the manual method over the pipeline method is clear. The
photometric accuracy of the obtained brightness data are in same range where
the accuracy as the other methods. In some cases where the OT faded near to
the observational threshold the errors are much higher due to the very low
signal to noise ratio. The only way to get much more precise data and longer
datasets is the usage of much bigger telescopes.
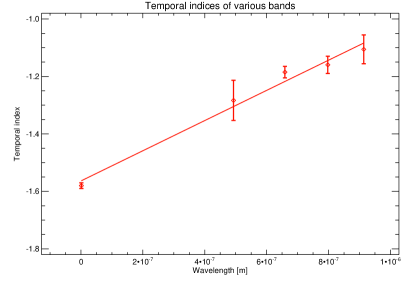
The slopes of the different observations show a gradual increase with decreasing energy band.
| Band | Slope | Error |
|---|---|---|
| X-ray | -1.58 | 0.01 |
| g-band | -1.28 | 0.07 |
| R-band | -1.18 | 0.02 |
| i-band | -1.16 | 0.03 |
| z-band | -1.11 | 0.05 |
III Other measurements
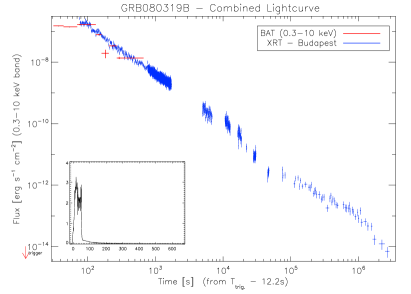
There is still significant emission in the BAT band up to seconds after the trigger. The extrapolated BAT flux seems to match well the XRT flux. On closer inspection we find that BAT photon indices are softer than the XRT indices in the five intervals of coincident measurement (). There are small hints of spectral evolution as well.
IV Discussion
GRB080319B is the brightest burst with known redshift. Without considering the two-component jet model (Racusin et al., 2008), we have fitted a power-law for the X-ray and the four optical bands. There is a hint of breaks only in the XRT lightcurve, the optical bands seem to follow a power-law decline. We found that the temporal indices scale approximately linearly with wavelength. X-ray and the extrapolated -ray measurements seem to agree, but there is a hint a of a break frequency.
V Acknowledgements
This research is supported by Hungarian OTKA grant K077795, by the Bolyai Scholarship (I. H.).
References
- Cenko et al. (2009) S. B. Cenko, J. Kelemen, F. A. Harrison, D. B. Fox, S. R. Kulkarni, M. M. Kasliwal, E. O. Ofek, A. Rau, A. Gal-Yam, D. A. Frail, et al., Astrophys. J. 693, 1484 (2009), eprint 0808.3983.
- Evans et al. (2007) P. A. Evans, A. P. Beardmore, K. L. Page, L. G. Tyler, J. P. Osborne, M. R. Goad, P. T. O’Brien, L. Vetere, J. Racusin, D. Morris, et al., A&A 469, 379 (2007), eprint arXiv:0704.0128.
- Butler and Kocevski (2007) N. R. Butler and D. Kocevski, Astrophys. J. 663, 407 (2007), eprint arXiv:astro-ph/0612564.
- Racusin et al. (2008) J. L. Racusin, S. V. Karpov, M. Sokolowski, J. Granot, X. F. Wu, V. Pal’Shin, S. Covino, A. J. van der Horst, S. R. Oates, P. Schady, et al., Nature (London) 455, 183 (2008), eprint 0805.1557.