Anomalous grouping of some short BATSE GRBs
Abstract
The power spectra of 457 short BATSE bursts were analyzed, focusing on the lightcurves’ tails in the low energy bands. Using MC simulations, 22 GRBs were identified with unusually high harmonic power above .
The sky distribution of these bursts shows an extraordinarily strong dipole moment with a significance.
I Data pre-processing
The shape of the gamma-ray burst’s lightcurves of the BATSE Gamma-Ray Burst Catalog (mee00, ) carry an immense amount of information. Here we focus on the possible SGR-like contamination in the BATSE data. We used data from the BATSE DISCSC dataset keeping in mind that the distant SGR signals could be very similar to the short GRBs: a bright short peak and a - probably weak, noisy - extended periodic emission in the low energy bands.
During the processing we’ve focused on the harmonic content of the GRB lightcurve. Therefore during the analysis
-
•
the three background-subtracted lowest energy bands (below keV) were joined to reduce the noise (the high energy ( keV) channel behaves differently (bag98, )). We used a quadratic background fit for each channel.
-
•
FFT was used to calculate the power spectrum with a window size of 1024 samples (). This sampling determines both the lowest frequency (, ) and the highest (, ).
-
•
the first data was excluded from the signal after the trigger (): this ensures that even the strongest short GRB lightcurve will decay and it does not interfere with any possible signal in the tail.
-
•
we generated as many data windows as possible. The starting point of the 1024-sample-sized sliding window was increased with 256 samples () until the window’s endpoint reaches the end of the data.
-
•
to reduce the power spectrums sensitivity to edge effects a Blackman window was used: this data windowing prevents leakage from the nearby frequency components press , and makes the power spectrum more regular. The window also reduces any spurious effects originating from the non-perfect background subtraction.
-
•
each data block was whitened before the FFT. No data winzorization was applied.
II Power spectrum analysis
Most of the data probably contains a Poissonian noise only, therefore to determine the significance of any probable signal a Monte-Carlo simulation was needed.
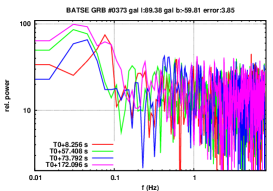
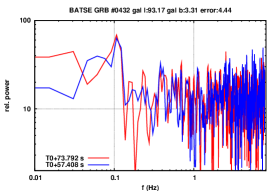
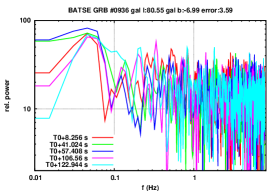
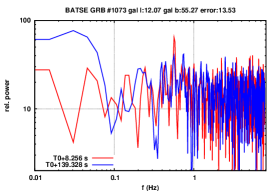
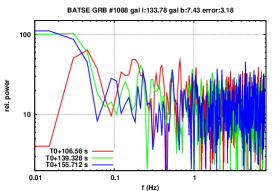
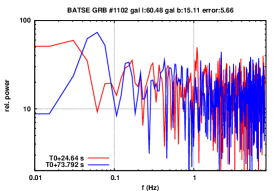
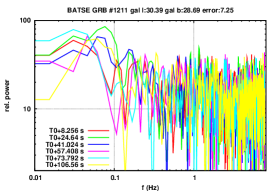
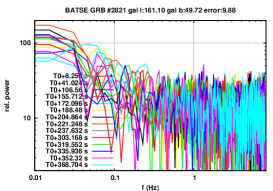
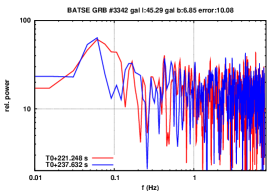
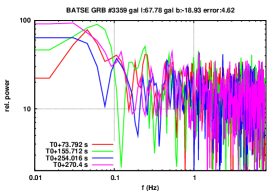
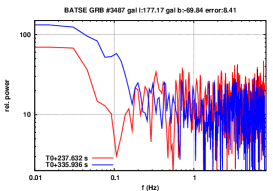
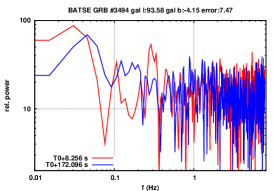
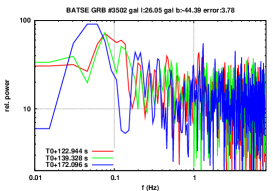
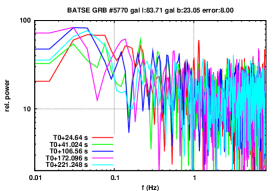
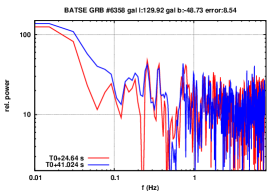
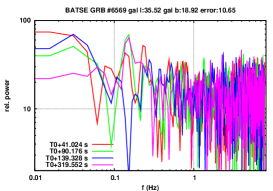
For each 1024 sample block random signals were generated 500 times by randomly shuffling the data: the maximum value in the power spectrum of each MC signal was compared with the real signal’s maximum value. We select only bursts where the real signal’s maximum power is bigger than any maximum in the MC signals. The candidate trigger also required to produce such harmonic power signal at least for two different window starting point (overlapping windows were not excluded).
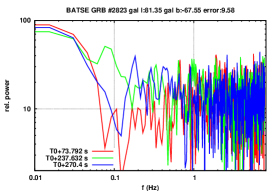
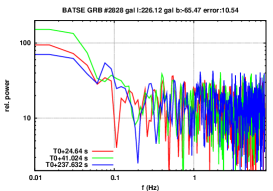
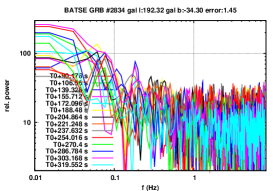
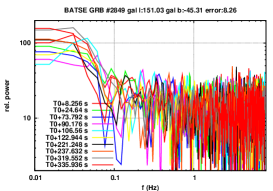
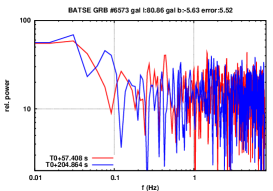
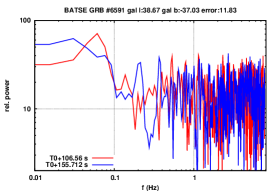
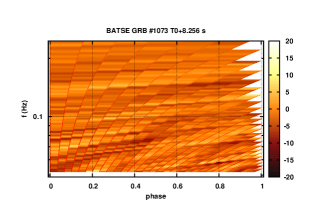
These requirements select 22 GRBs with unusually high harmonic power above . Fig. 1. shows the power spectra of these bursts with the corresponding window start times.
III Pulse shapes
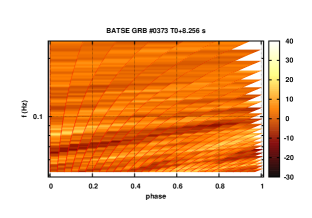
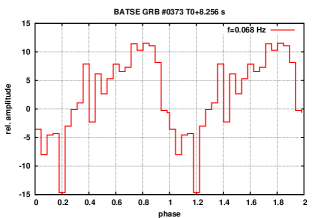
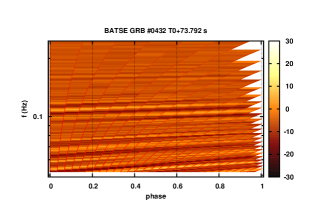
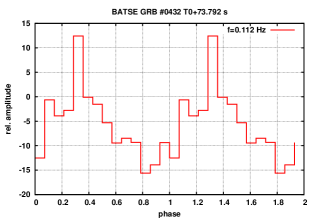
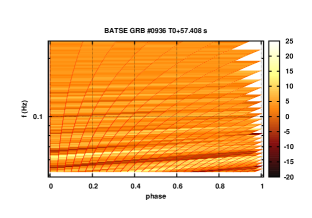
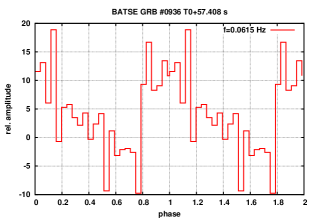
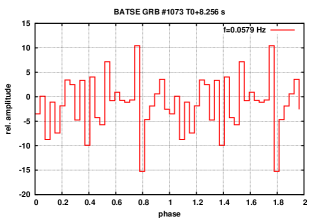
On Fig. 2. we show some triggers’ folded phase-frequency diagram and (selected) folded pulse shape. One can observe that some of the signals appears to be periodic: however we should keep in mind that for these triggers have only one kind of observation with fixed time resolution (), so it is very hard to assign real significance levels to these curves.
Triggers #0373 and #6591 show a broad signal, while #0434 and #3359 show more narrow peaks. It is remarkable that all suspicious frequencies are beyond any known BATSE periodic detector effect.
![[Uncaptioned image]](/html/0912.3913/assets/x31.png)
![[Uncaptioned image]](/html/0912.3913/assets/x32.png)
![[Uncaptioned image]](/html/0912.3913/assets/x33.png)
![[Uncaptioned image]](/html/0912.3913/assets/x34.png)
FIG. 2 (continued): Some folded phase-frequency diagrams and folded pulse shapes of the selected triggers.
IV Sky distribution
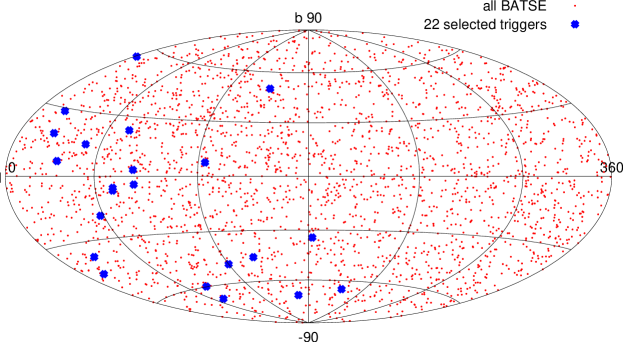
The sky distribution of the selected 22 triggers is plotted with on Fig. 3., with all the BATSE GRBs’ positions. The figure seems to be asymmetric: to check the randomness we calculated the dipole components from the selected subset and from cases of a random 22-element sample drawn from the complete BATSE database: this method fully eliminates the non-uniform sky-exposure function of the BATSE. We’ve got only 3 random cases where the dipole’s magnitude was bigger than the 22 triggers’ dipole. It gives a significance (approx. ) for the extraordinary dipole moment. The direction of the dipole is .
V Discussion
There are increasing evidence that all the GRBs do not represent a physically homogeneous group (ho98, ; muk98, ; hak00, ; ho02, ; bal03, ; hak03, ; ho06, ). In the last years the papers (ba98, ; me00a, ; me00b, ; li01, ) provided several different tests probing the sky distribution of GRB groups in BATSE Catalog. The celestial distribution of the short BATSE bursts shows anisotropic behavior (me00a, ; nor02, ; vav08, ). The direction of the dipole is not correlated with the supergalactic plane (not like nor02 ) and interestingly the dipole’s direction is only away from the the CMB dipole’s temperature minimum.
Our results suggests that some anomalous subgroups could be responsible for the weak anisotropic signals: for a more detailed answer a deeper study of this effect is necessary. We plan to provide it in a forthcoming paper.
VI Acknowledgments
Thanks are due to G. Tusnády for valuable discussions. This research is supported by Hungarian OTKA grant K077795, by the Bolyai Scholarship (I. H.), by the GAUK grant No. 46307, and by the Research Program MSM0021620860 of the Ministry of Education of the Czech Republic (A.M.).
References
- (1) Meegan C.A. et al., 2000, BATSE Gamma-Ray Bursts Catalog, http://gammaray.msfc.nasa.gov/batse/grb/catalog
- (2) Bagoly, Z., Mészáros, A., Horváth, I., Balázs, L.G. & Mészáros, P. 1998, ApJ, 498, 342
- (3) Press W.H., Flannery B.P., Teukolsky S.A., Vetterling W.T., 1992, Numerical Recipes, Cambridge University Press, Cambridge
- (4) Horváth I., 1998, ApJ, 508, 757
- (5) Mukherjee, S., et al. 1998, ApJ, 508, 314
- (6) Hakkila J., Haglin D.J., Pendleton G.N., Mallozzi R.S., Meegan C.A., Roiger R.J., 2000, ApJ, 538, 165
- (7) Horváth I., 2002, A&A, 392, 791
- (8) Balázs L.G., Bagoly Z., Horváth I., Mészáros A., Mészáros P., 2003, A&A, 401, 129
- (9) Hakkila, J., et al., 2003, ApJ, 582, 320
- (10) Horváth I., Balázs L.G., Bagoly Z., Ryde F., Mészáros A., 2006, A&A, 447, 23
- (11) Balázs L.G., Mészáros A., Horváth I., 1998, A&A, 339, 1
- (12) Mészáros A., Bagoly Z., Vavrek R., 2000a, A&A, 354, 1
- (13) Mészáros A., Bagoly Z., Horváth I., Balázs L.G., Vavrek R., 2000b, ApJ, 539, 98
- (14) Litvin, V.F., Matveev, S.A., Mamedov, S.V., & Orlov, V.V. 2001, Pis’ma v Astronomicheskiy Zhurnal, 27, 495
- (15) R. Vavrek, et al., 2008, MNRAS, 391, 1741-1748
- (16) Norris,, J.P. 2002, ApJ, 579, 386